


Monthly Sales Scorecard Powerpoint Presentation Slides





Try Before you Buy Download Free Sample Product
 Impress Your
 Audience
 100%
100% Editable
 Save Hours
 of Time


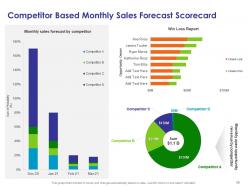
Monthly Sales Scorecard PowerPoint Presentation Slides is a highly visual tool tailor-made for sales executives and management. Showcase the opportunities created with the help of monthly sales BSC PPT theme. Our balanced scorecard for sales PowerPoint slideshow also assists users to assess unique visitors for each month. Demonstrate monthly performance scorecard of the regional sales team using this sales scorecard PPT template deck. You can even illustrate the performance of your sales staff through the strategic management sales BSC PowerPoint theme. Elucidate products monthly sales with respect to the service line and cumulative sales using our sales dashboard PPT templates. Designers of this eye-catching sales BSC PowerPoint theme follow a content-driven approach. The audience can skim the whole company sales scenario in a glance. Competitor based monthly sales forecast scorecard layout is loaded with pie charts, and bar graphs. Download our sales balanced scorecard PPT slideshow to showcase the sales endeavors of your organization in real-time.
People who downloaded this PowerPoint presentation also viewed the following :
Content of this Powerpoint Presentation
Slide 1: This slide introduces Monthly Sales Scorecard. State your Company name.
Slide 2: This slide showcases Monthly Scorecard for Sales Executives with Opportunities Created
Slide 3: This slide shows Company Monthly Sales Scorecard with Unique Visitors.
Slide 4: This slide showcases Regional Sales Team Monthly Performance Scorecard
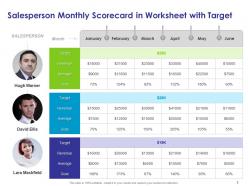
Slide 5: This slide presents Salesperson Monthly Scorecard in Worksheet with Target.
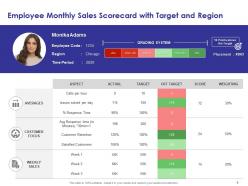
Slide 6: This slide presents Employee Monthly Sales Scorecard with Target and Region
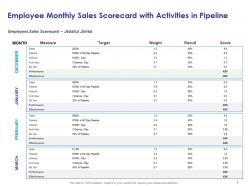
Slide 7: This slide showcases Employee Monthly Sales Scorecard with Activities in Pipeline
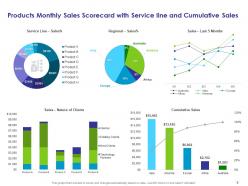
Slide 8: This slide presents Products Monthly Sales Scorecard with Service line and Cumulative Sales
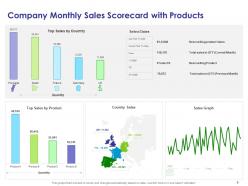
Slide 9: This slide presents Company Monthly Sales Scorecard with Products
Slide 10: This slide shows Competitor Based Monthly Sales Forecast Scorecard
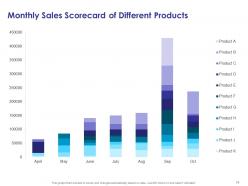
Slide 11: This slide showcases Monthly Sales Scorecard of Different Products.
Slide 12: This is Icons Slide for Monthly Sales Scorecard.
Slide 13: This slide is titled as Additional Slides for moving forward.
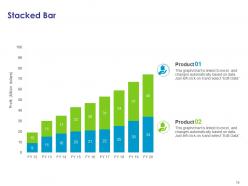
Slide 14: This slide showcases Stacked Bar chart with Products comparisons.
Slide 15: This slide showcases Column Chart with products comparisons.
Slide 16: This is Our Team slide with Names and Designations.
Slide 17: This is About Us slide to showcase Specifications.
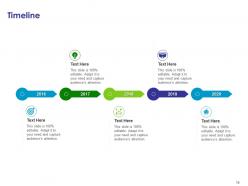
Slide 18: This is Timeline slide.
Slide 19: This slide displays Our Mission with Mission, Vision and Goal.
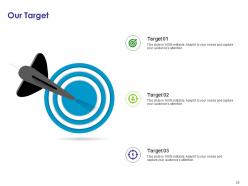
Slide 20: This slide displays Our Target.
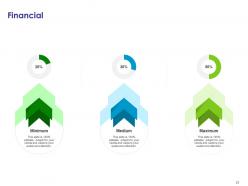
Slide 21: This is Financial slide to showcase finance related stuff.
Slide 22: This is Idea Generation slide. Highlight important ideas and beliefs.
Slide 23: This is Thank You slide with Address, Contact number, Email address.
Monthly Sales Scorecard Powerpoint Presentation Slides with all 23 slides:
Give your audience a fulfilling experience. They will find our Monthly Sales Scorecard Powerpoint Presentation Slides elevating.









FAQs for Monthly Sales Scorecard
Key metrics should include revenue performance, conversion rates, lead generation numbers, average deal size, sales cycle length, and individual rep performance against quotas. These metrics enable sales managers to identify trends, optimize resource allocation, and enhance team productivity, with many organizations finding that comprehensive scorecards ultimately deliver improved forecasting accuracy and competitive advantage.
A monthly sales scorecard reveals patterns in performance metrics, seasonal fluctuations, territory variations, product cycles, and team productivity trends through consistent tracking and comparison. By analyzing these data points across quarters and years, sales managers can anticipate market shifts, optimize resource allocation, and adjust strategies proactively, ultimately delivering predictable revenue growth and competitive advantage.
Customer segmentation enhances sales scorecard effectiveness by enabling targeted performance tracking, personalized sales strategies, customized KPI development, and segment-specific resource allocation across different customer categories. Through detailed segmentation analysis, organizations can identify high-value prospects, tailor approaches for enterprise versus SMB clients, and optimize territory management, ultimately delivering improved conversion rates and strategic competitive advantage.
Sales teams can utilize scorecards to set realistic monthly targets by analyzing historical performance data, tracking conversion rates, pipeline velocity, and seasonal trends. These metrics enable managers to establish achievable goals based on actual team capabilities, market conditions, and resource allocation, while identifying performance gaps and coaching opportunities that ultimately enhance forecasting accuracy and drive sustainable revenue growth.
Sales scorecard automation integrates CRM platforms, business intelligence tools, marketing automation software, data visualization dashboards, and API connectors for seamless data flow. These technologies streamline reporting by eliminating manual data entry, synchronizing real-time metrics, and delivering comprehensive performance insights, with many sales organizations finding that automated scorecards reduce reporting time while enhancing accuracy and strategic decision-making.
Monthly sales scorecard metrics should be reviewed quarterly for strategic adjustments, with performance data analyzed monthly to identify trends and immediate concerns. While core KPIs like revenue and conversion rates remain consistent, supporting metrics may need refinement based on market changes, with many sales organizations finding that regular quarterly assessments ensure scorecards stay aligned with evolving business objectives and competitive landscapes.
Best practices for visualizing sales data in monthly scorecards include clear KPI hierarchies, trend comparisons with previous periods, color-coded performance indicators, regional breakdowns, and interactive drill-down capabilities. These visualization approaches streamline decision-making by highlighting critical metrics, identifying underperforming territories, and enabling quick pattern recognition, with many sales organizations finding that strategic dashboard design ultimately delivers faster insights and enhanced team accountability.
Sales scorecards facilitate better communication by providing shared metrics, standardized reporting formats, and unified performance visibility that both teams can reference during strategy sessions. These tools streamline collaboration by tracking lead quality, conversion rates, and pipeline progression, enabling sales and marketing teams to align campaigns with closing patterns, ultimately delivering more qualified prospects and higher revenue conversion rates.
Common pitfalls include tracking too many metrics, focusing solely on lagging indicators, using inconsistent data sources, lacking clear targets, and ignoring regional variations. Organizations should streamline dashboards to essential KPIs, balance leading and lagging measures, and ensure data accuracy, with many sales teams finding that simplified, actionable scorecards drive better performance outcomes.
Scorecards can be customized by adjusting metrics, targets, and reporting frequencies to match each team's specific goals, market conditions, and regional characteristics. Sales teams in different sectors, such as enterprise software versus retail, benefit from tailored KPIs like deal size versus transaction volume, while regional teams require localized targets reflecting market maturity, ultimately delivering more accurate performance insights and strategic alignment.
Sales scorecards contribute to performance evaluations by providing objective, data-driven metrics that track individual achievements against targets, quota attainment, conversion rates, and customer acquisition numbers. These comprehensive assessments enable managers to identify top performers, coaching opportunities, and skill gaps, while ensuring fair, transparent evaluations that ultimately enhance team productivity and strategic goal alignment.
Monthly sales scorecard data for non-sales stakeholders requires visual simplification through dashboards, trend charts, and color-coded performance indicators that translate complex metrics into clear insights. These presentations should focus on business outcomes like revenue growth, customer acquisition costs, and market share expansion, with many organizations finding that storytelling approaches connecting sales performance to overall company objectives deliver better stakeholder engagement and strategic alignment.
Monthly sales scorecards support strategic decision-making by providing comprehensive performance visibility, identifying market trends, tracking goal progression, and revealing resource allocation opportunities. These strategic dashboards enable leadership to adjust pricing strategies, reallocate territories, modify product focus, and optimize sales processes, with many organizations finding that consistent scorecard analysis ultimately delivers faster market responses and sustained competitive advantage.
Organizations use sales scorecards to motivate teams by providing clear performance visibility, establishing competitive benchmarks, recognizing top performers, and identifying improvement opportunities through transparent metrics tracking. This gamification approach enables sales professionals to track progress against goals, compare performance with peers, and receive immediate feedback, with many companies finding that visual scorecard displays drive healthy competition and ultimately enhance team productivity and revenue achievement.
Potential biases include selection bias from incomplete data capture, confirmation bias when interpreting favorable results, recency bias overweighting recent performance, and survivorship bias focusing only on successful metrics. These analytical blind spots can distort strategic decision-making, with many organizations finding that diversified data sources, standardized review processes, and cross-functional validation help minimize bias impact, ultimately delivering more accurate performance insights and competitive advantage.
No Reviews