New product development and life cycle strategies process
To stay in competition a business house need to comprehend product life cycle theory in a precise way. Taking this into account here we have come up with a pre made sample of PPT presentation illustrating various stages of product life cycle. You can take advantage of this PowerPoint slide deck to illustrate purpose of product development life cycle so as to manage cash flow and resources in a better way. Additionally, you can portray results of your product life cycle analysis underlining marketing stage of a specific product. Creative presentation themes of Brand-Product matrix, Penetration pricing, Market communication mix, Building brand preference and many more like these are highlights of this PPT sample. In short, from product managers to marketing managers and product strategists all can rely on this good PPT example to deliver a jaw dropping PPT presentation. Get started now by downloading this pre made PPT model.
To stay in competition a business house need to comprehend product life cycle theory in a precise way. Taking this into acc..
- Google Slides is a new FREE Presentation software from Google.
- All our content is 100% compatible with Google Slides.
- Just download our designs, and upload them to Google Slides and they will work automatically.
- Amaze your audience with SlideTeam and Google Slides.
-
Want Changes to This PPT Slide? Check out our Presentation Design Services
- WideScreen Aspect ratio is becoming a very popular format. When you download this product, the downloaded ZIP will contain this product in both standard and widescreen format.
-

- Some older products that we have may only be in standard format, but they can easily be converted to widescreen.
- To do this, please open the SlideTeam product in Powerpoint, and go to
- Design ( On the top bar) -> Page Setup -> and select "On-screen Show (16:9)” in the drop down for "Slides Sized for".
- The slide or theme will change to widescreen, and all graphics will adjust automatically. You can similarly convert our content to any other desired screen aspect ratio.
Compatible With Google Slides

Get This In WideScreen
You must be logged in to download this presentation.
PowerPoint presentation slides
59 high resolution PowerPoint templates. Ready to use hence saves time. Creative presentation designs far above the ground. Fully editable graphics, text, font, colors and layout. Professionally designed colorful tables, graphs and diagrams. Easy to insert company logo, trademark, animation and more. Quick to download. Compatible with all softwares.
People who downloaded this PowerPoint presentation also viewed the following :
Content of this Powerpoint Presentation
Slide 1: This is an introductory slide to Product Life Cycle and Development. State your company name and begin.
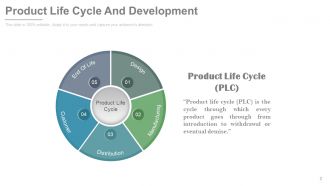
Slide 2: This slide shows Product Life Cycle with its definition and five components- Design, Manufacturing, Distribution, Customer, End Of Life.
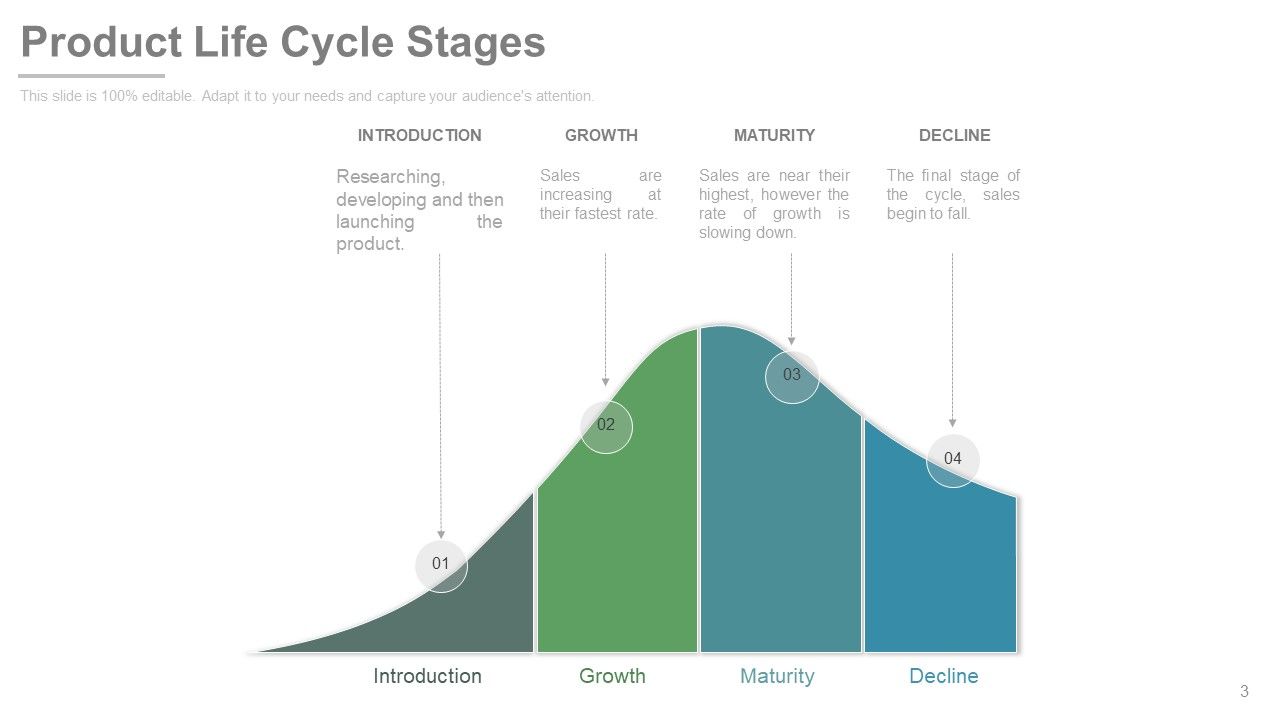
Slide 3: This slide shows Product Life Cycle Stages graph with four levels- Introduction, Growth, Maturity, Decline.
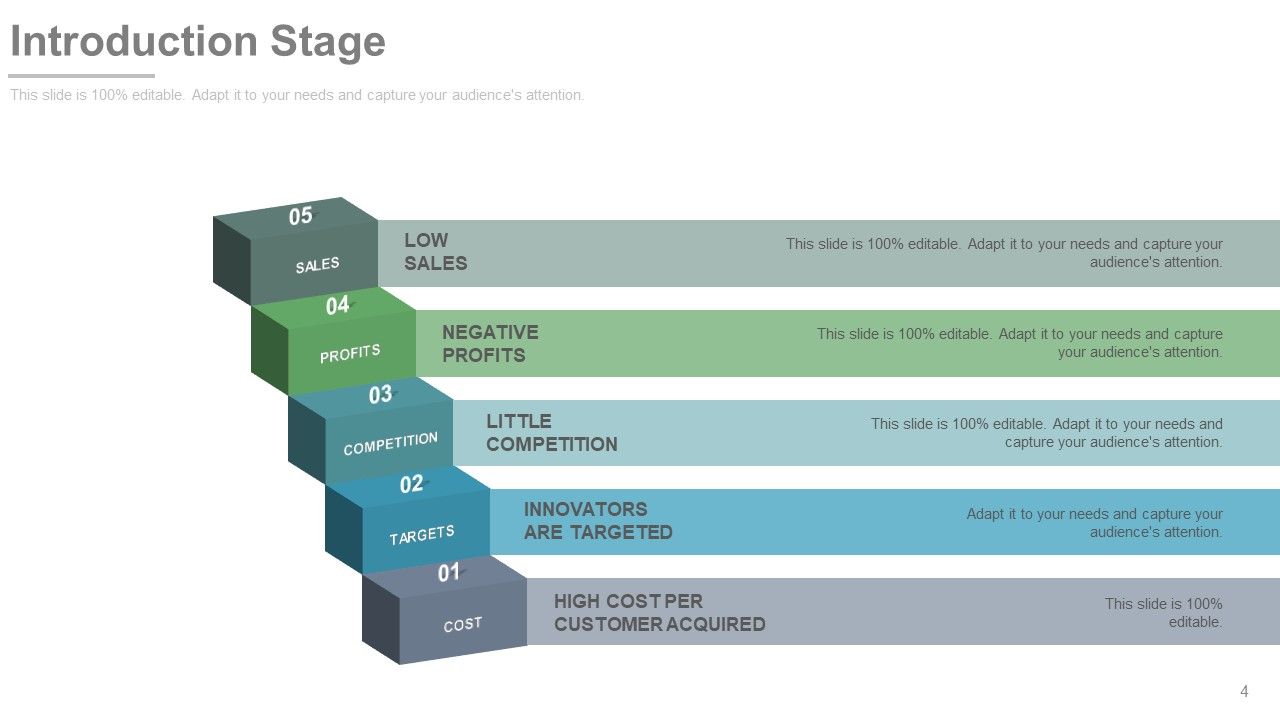
Slide 4: This slide shows Introduction Stage which consists of the following five levels- SALES, PROFITS, COMPETITION, TARGETS, COST.
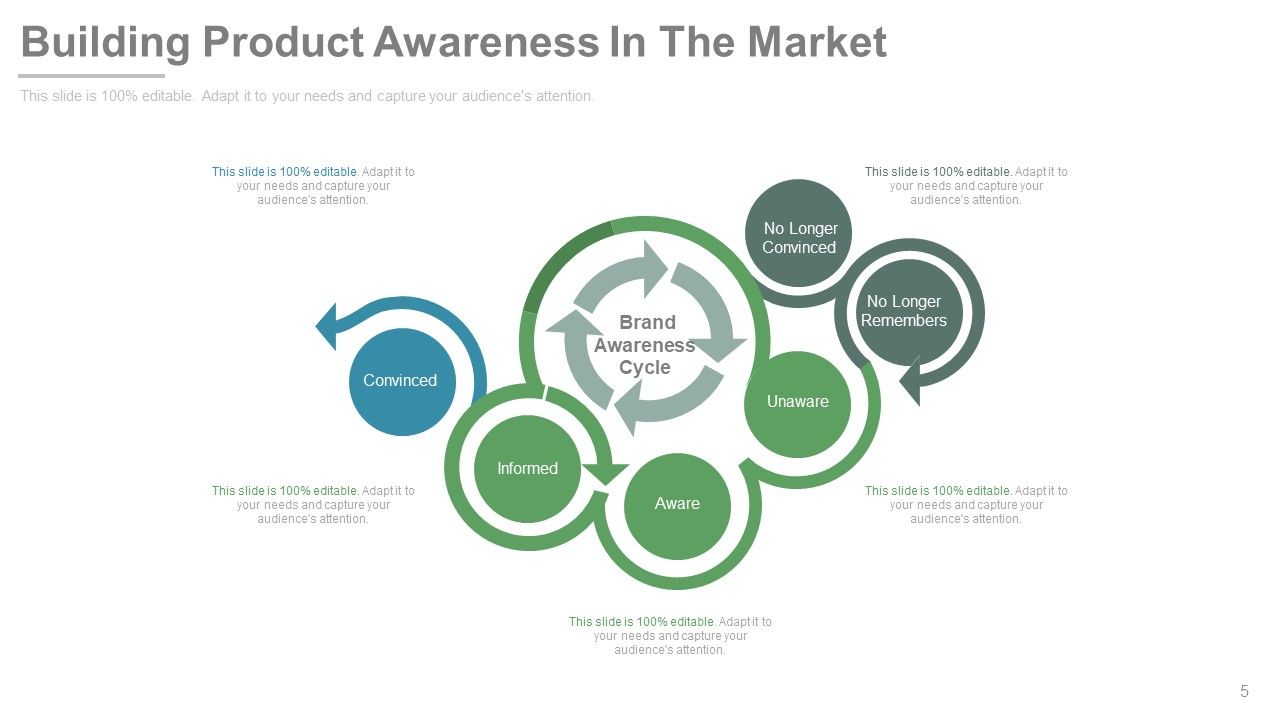
Slide 5: This is Building Product Awareness In The Market slide. It shows Brand Awareness Cycle with six parameters- No Longer Convinced, No Longer Remembers, Unaware, Aware, Informed, Convinced.
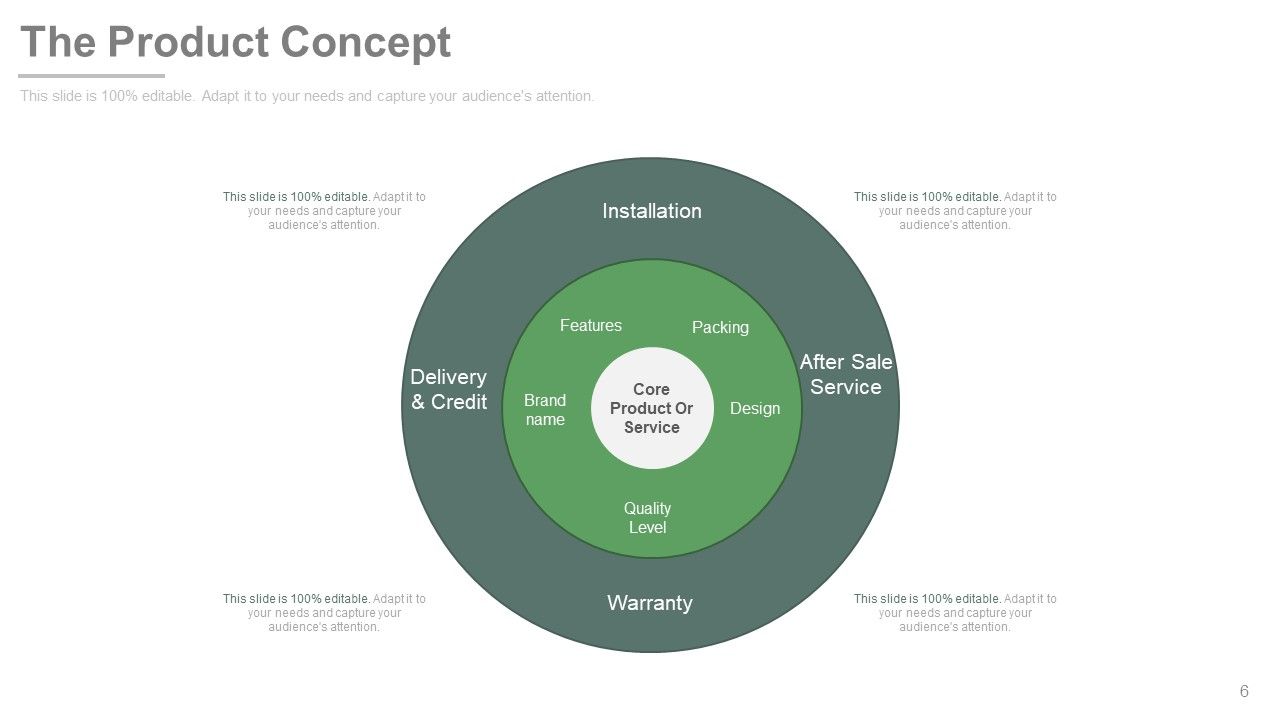
Slide 6: This slide shows The Product Concept by stating the Core Product Or Service. This further includes- Installation, After Sale Service, Warranty, Delivery & Credit, Packing, Features, Design, Quality Level, Brand name.
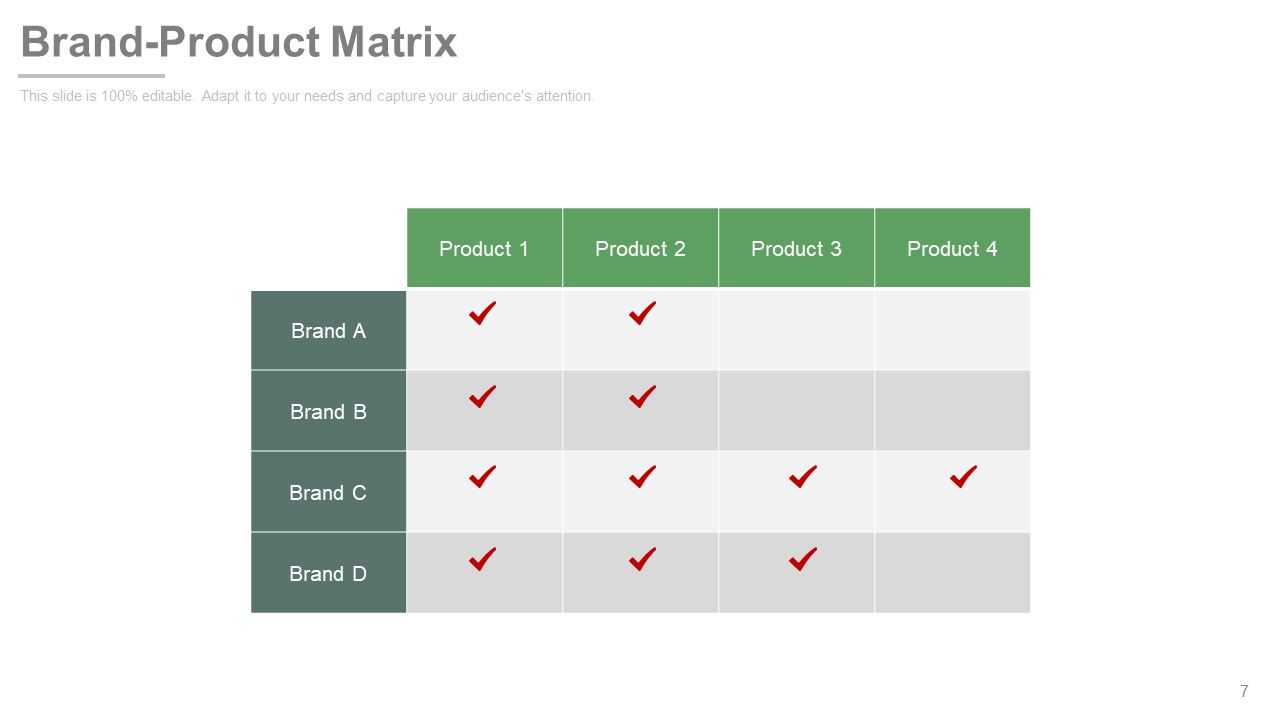
Slide 7: This slide shows the Brand-Product Matrix. Put relevant data in the given table and make use of it.
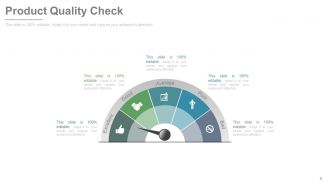
Slide 8: This slide shows Product Quality Check meter with the following five parameters- Excellent, Good, Average, Poor, Bad.
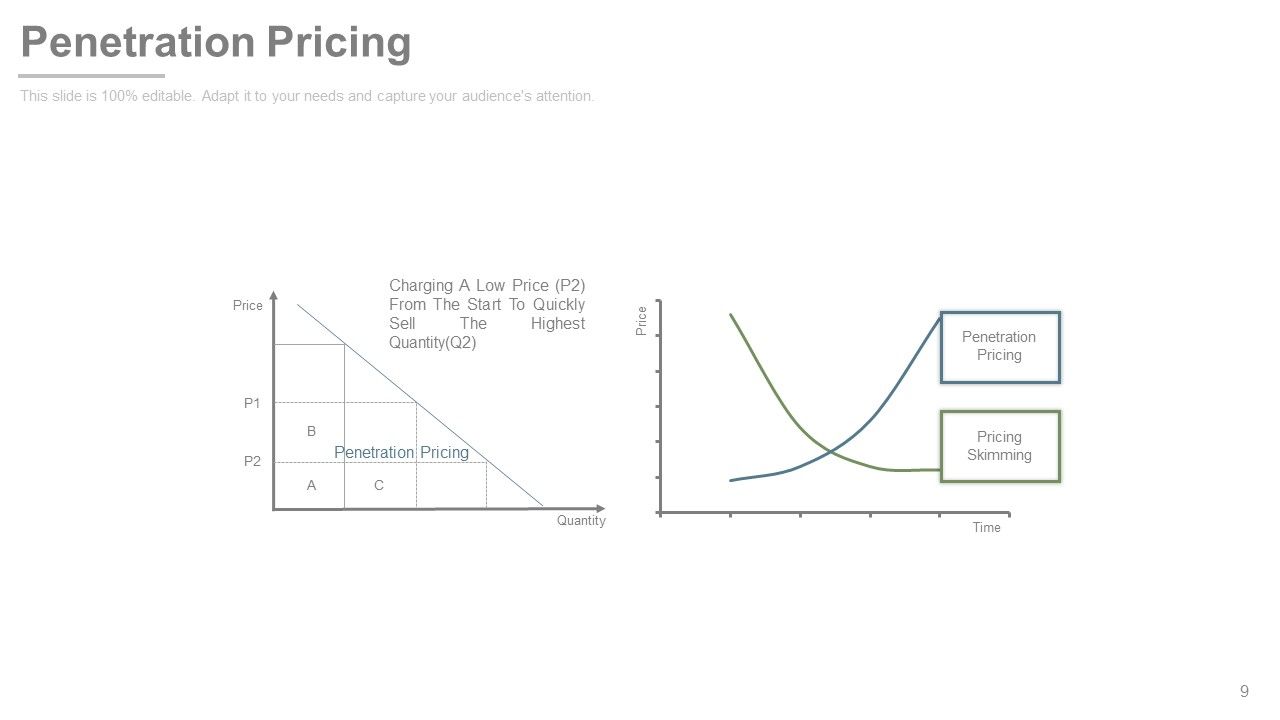
Slide 9: This slide presents Penetration Pricing in a graphical form.
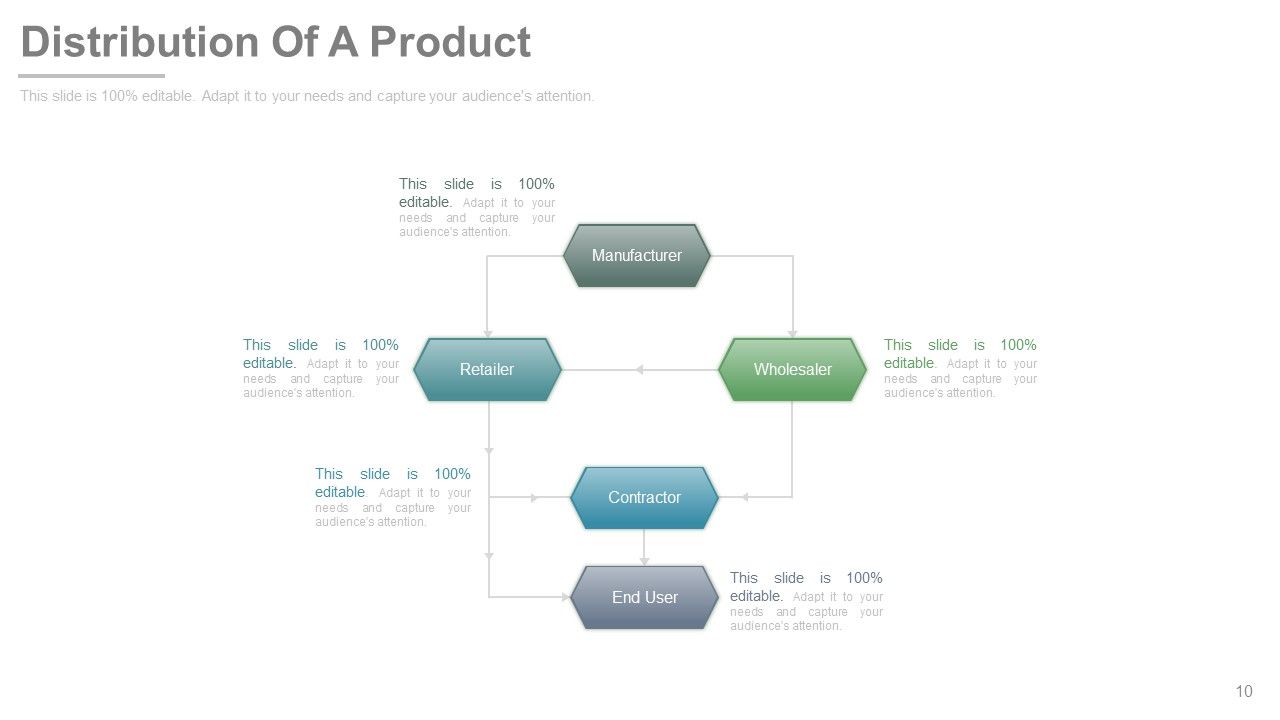
Slide 10: This slide presents Distribution Of A Product flow chart. It shows the various levels the product has to go through to reach the End User.
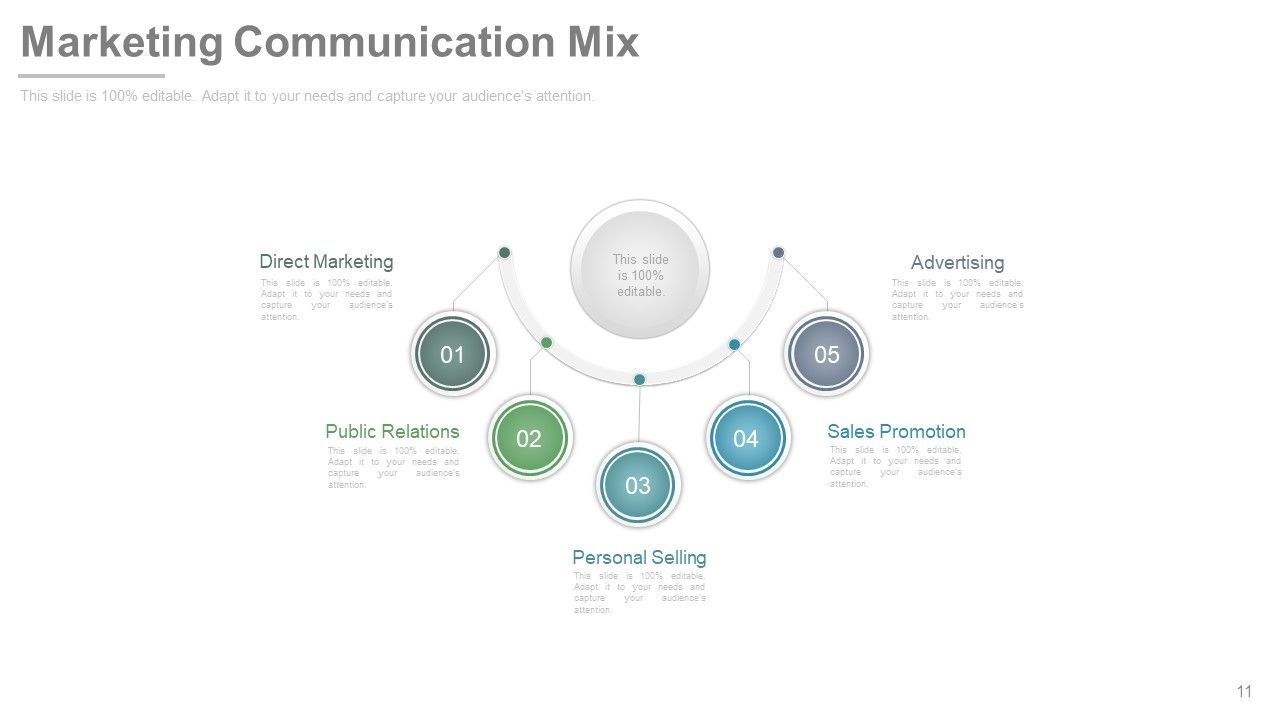
Slide 11: This slide shows Marketing Communication Mix which consists of- Advertising, Sales Promotion, Personal Selling, Public Relations, Direct Marketing.
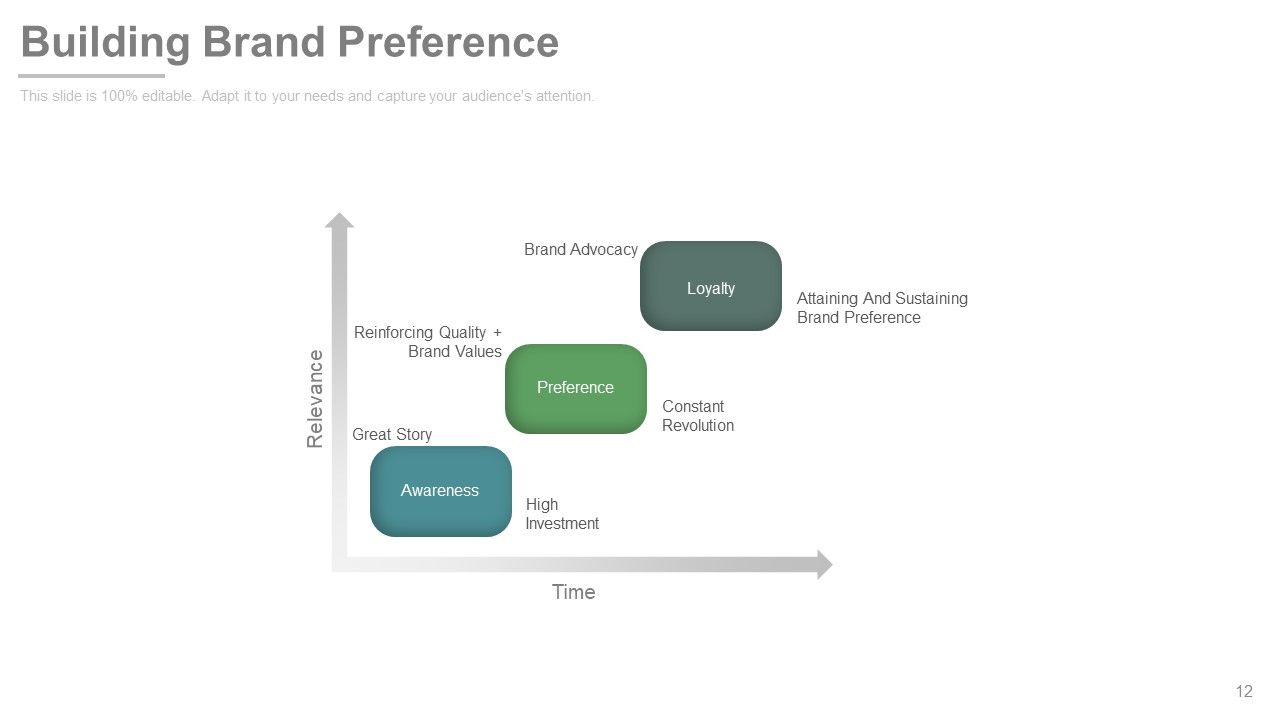
Slide 12: This slide shows Building Brand Preference graph. In this graph Time is shown on the x- axis and Relevance on the y- axis with three parameters- Loyalty, Awareness, Preference.
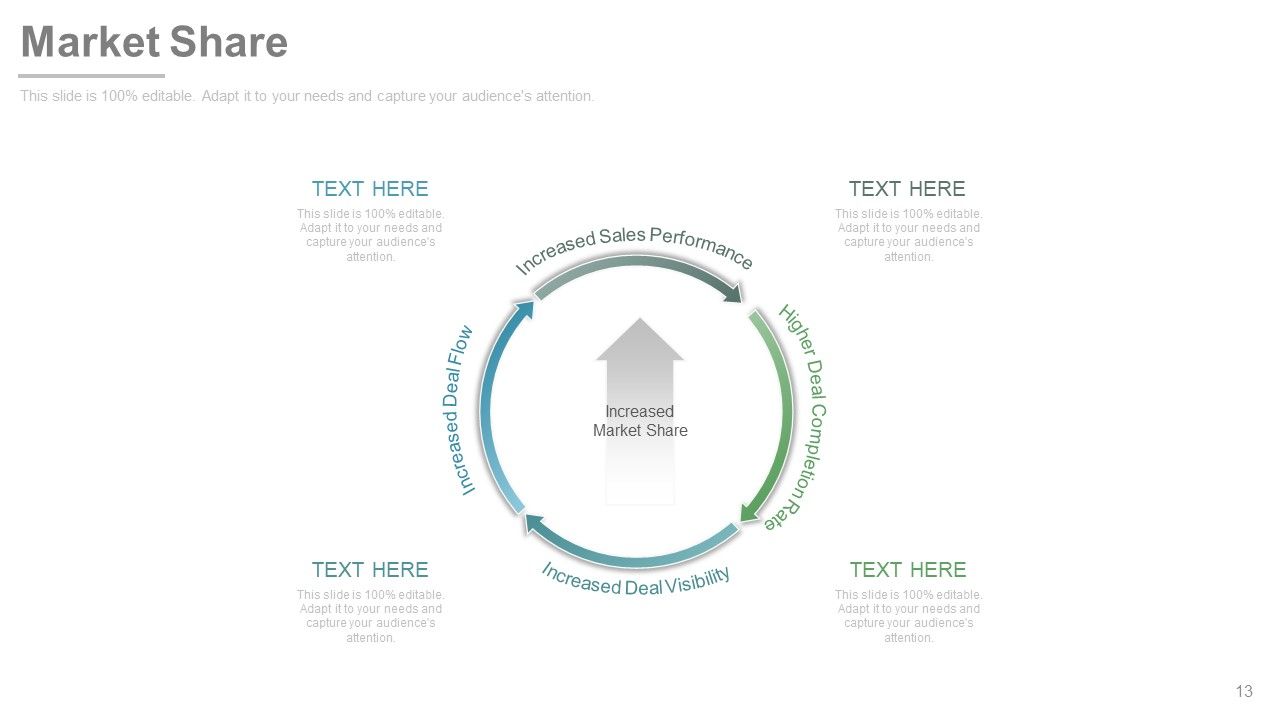
Slide 13: This is Market Share slide showing Increased Market Share with the following parameters- Increased Deal Visibility, Increased Sales Performance, Higher Deal Completion Rate, Increased Deal Flow.
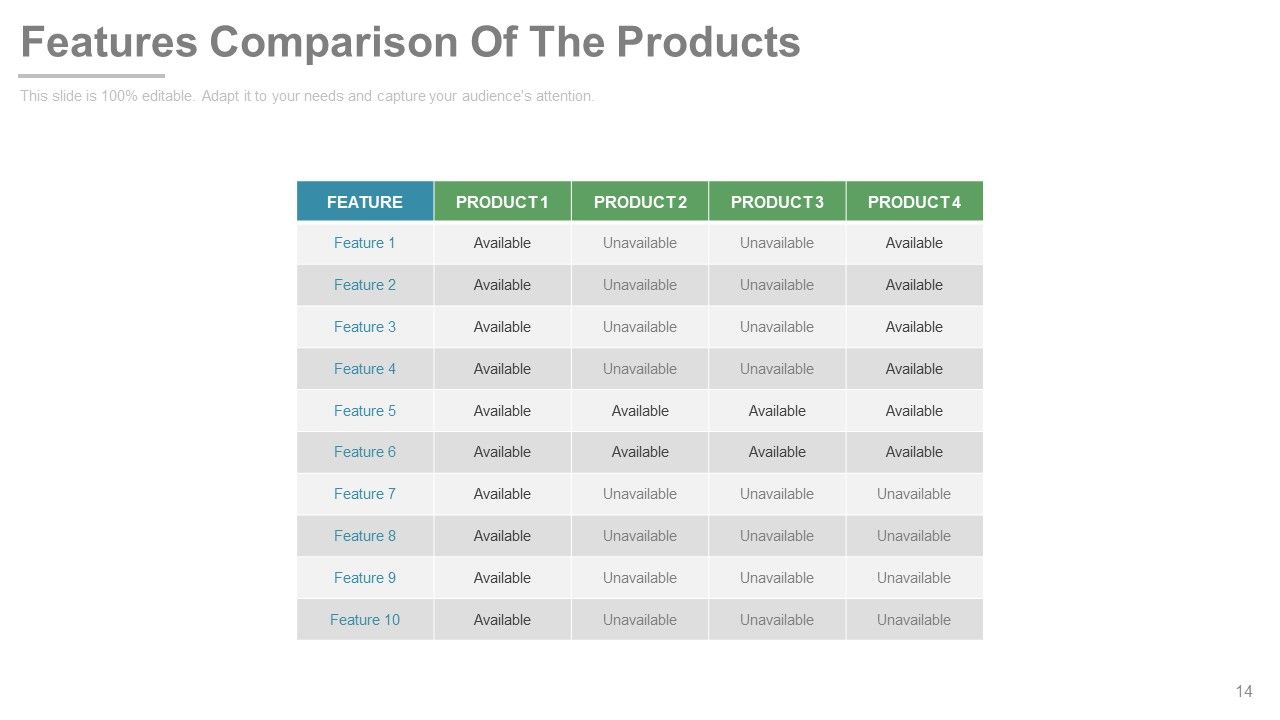
Slide 14: This slide Features Comparison Of The Products. Add relevant data in this table.
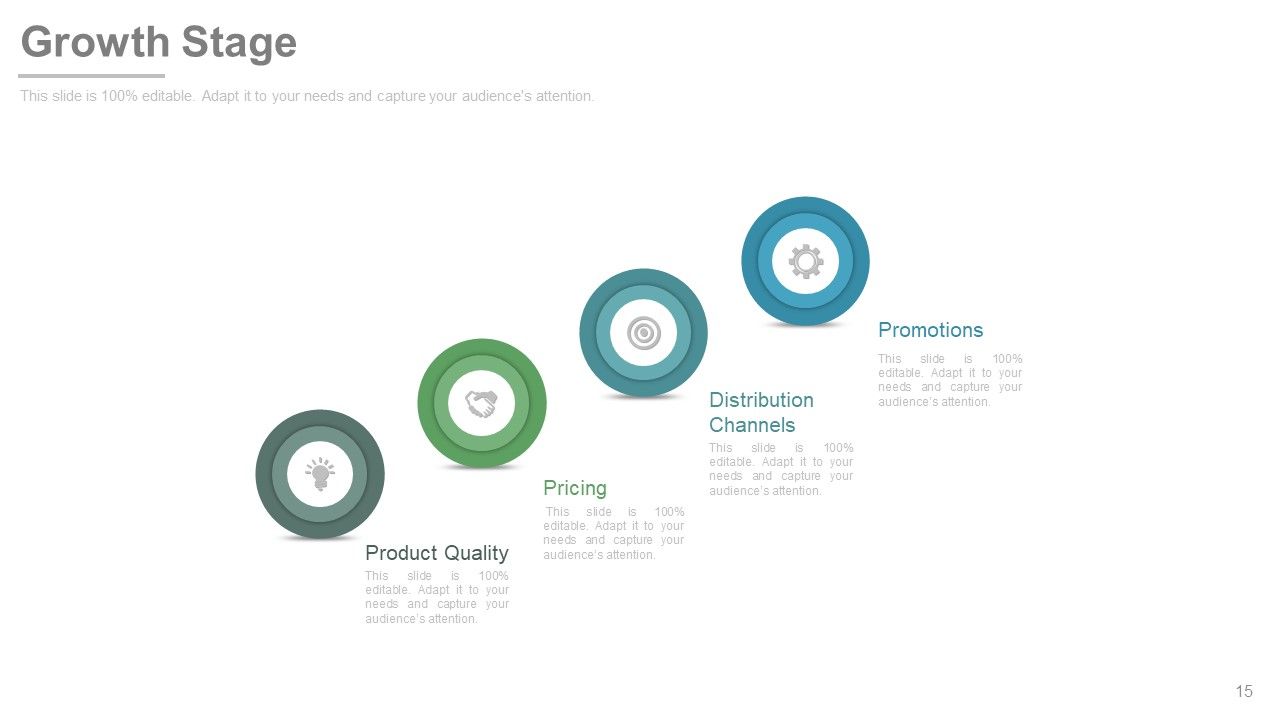
Slide 15: This slide shows four levels in the Growth Stage- Pricing, Distribution Channels, Product Quality, Promotions.
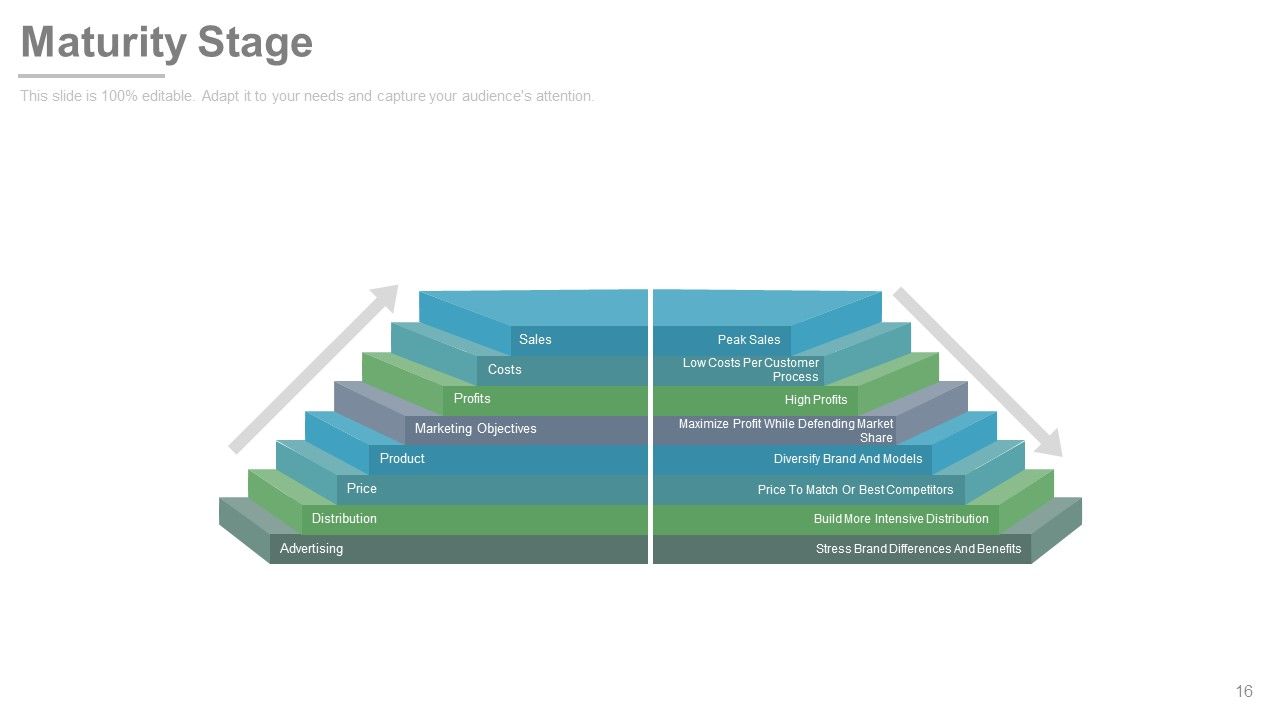
Slide 16: This slide shows Maturity Stage with various levels. Some of them are- Profits Sales Costs Marketing Objectives Product Price Distribution Advertising Low Costs Per Customer Process etc.
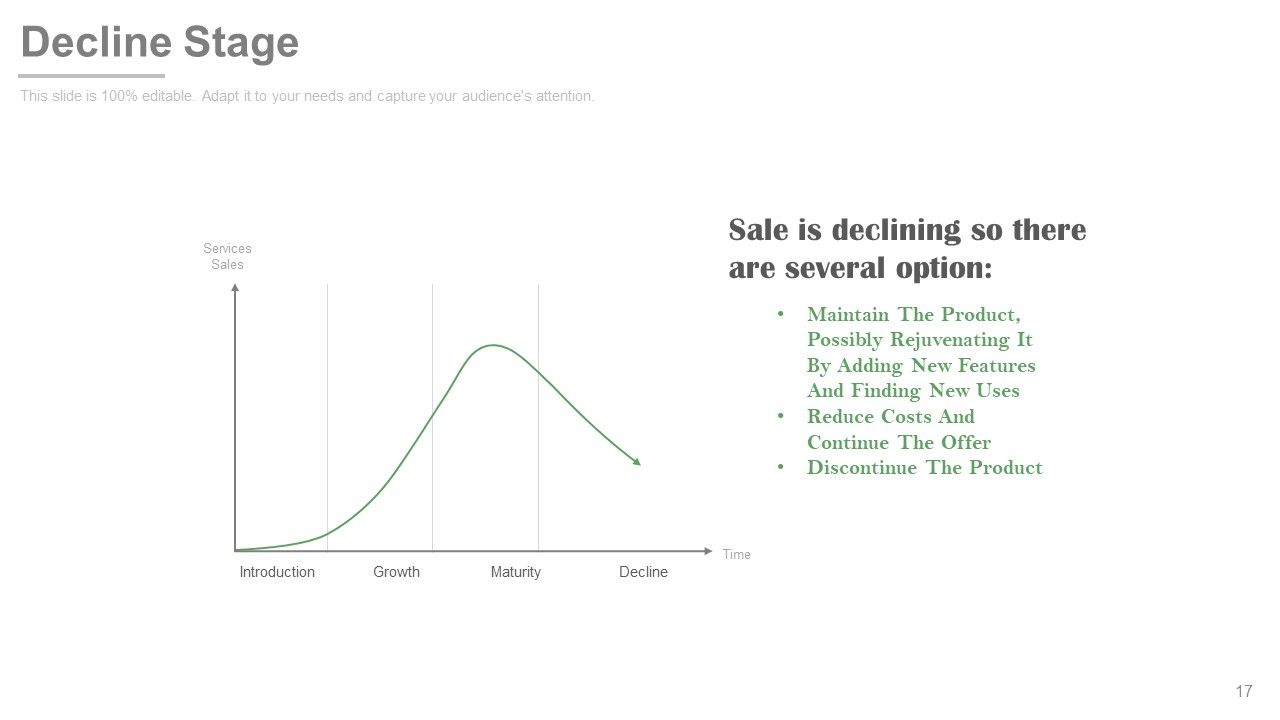
Slide 17: This slide showcases Decline Stage graphically with Time on the x-axis and Services sales on the y-axis. It also shows three options if the sales are declining- Maintain The Product, Possibly Rejuvenating It By Adding New Features And Finding New Uses, Reduce Costs And Continue The Offer, Discontinue The Product.
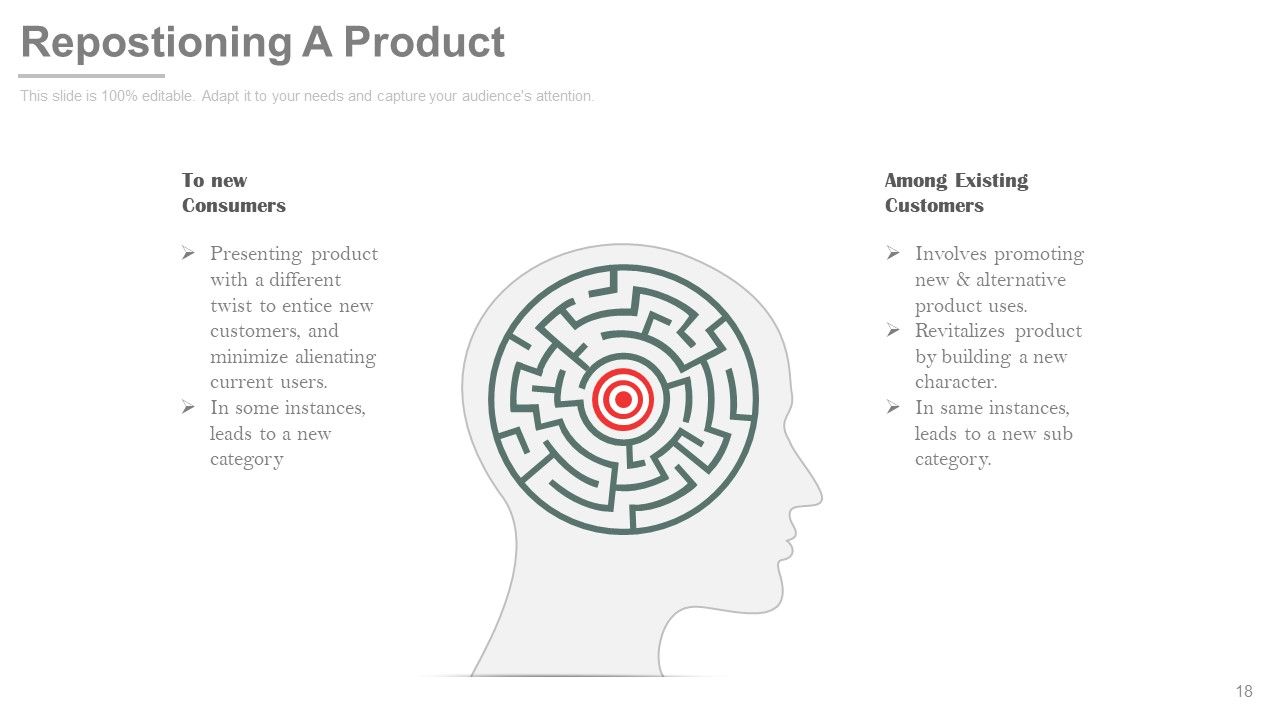
Slide 18: This is Repostioning A Product slide with creative human brain imagery. You can easily reposition your product as per your need on the basis of the following two parameters- Among Existing Customers, To new Consumers.
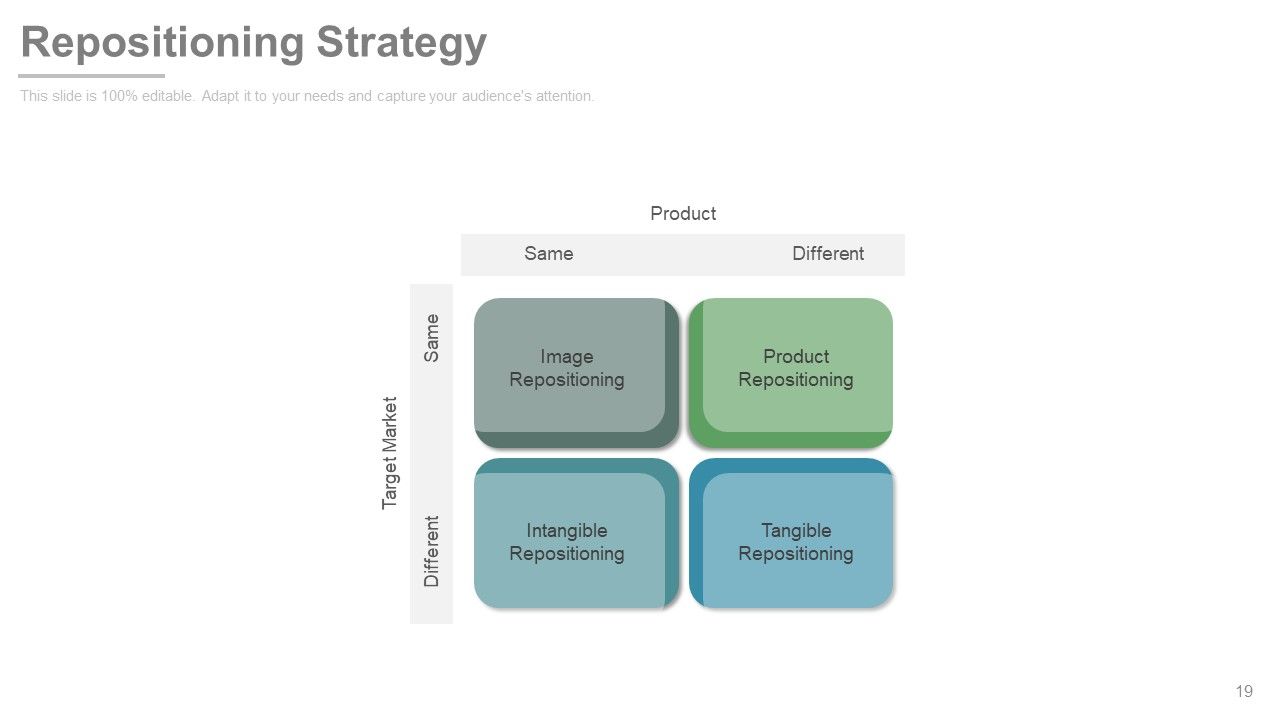
Slide 19: This slide presents Repositioning Strategy matrix which shows- Image Repositioning, Intangible Repositioning, Tangible Repositioning, Product Repositioning.
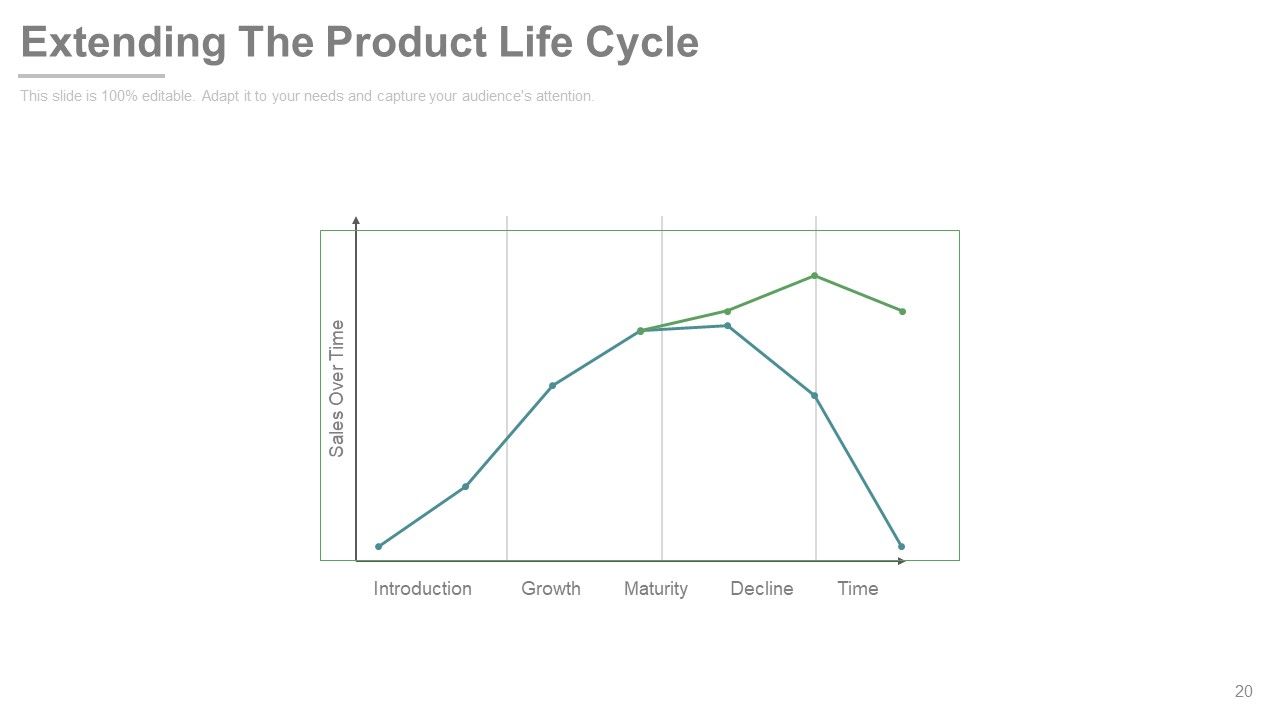
Slide 20: This is Extending The Product Life Cycle graph slide with the following stages to be shown/ displayed- Introduction, Growth, Maturity, Decline.
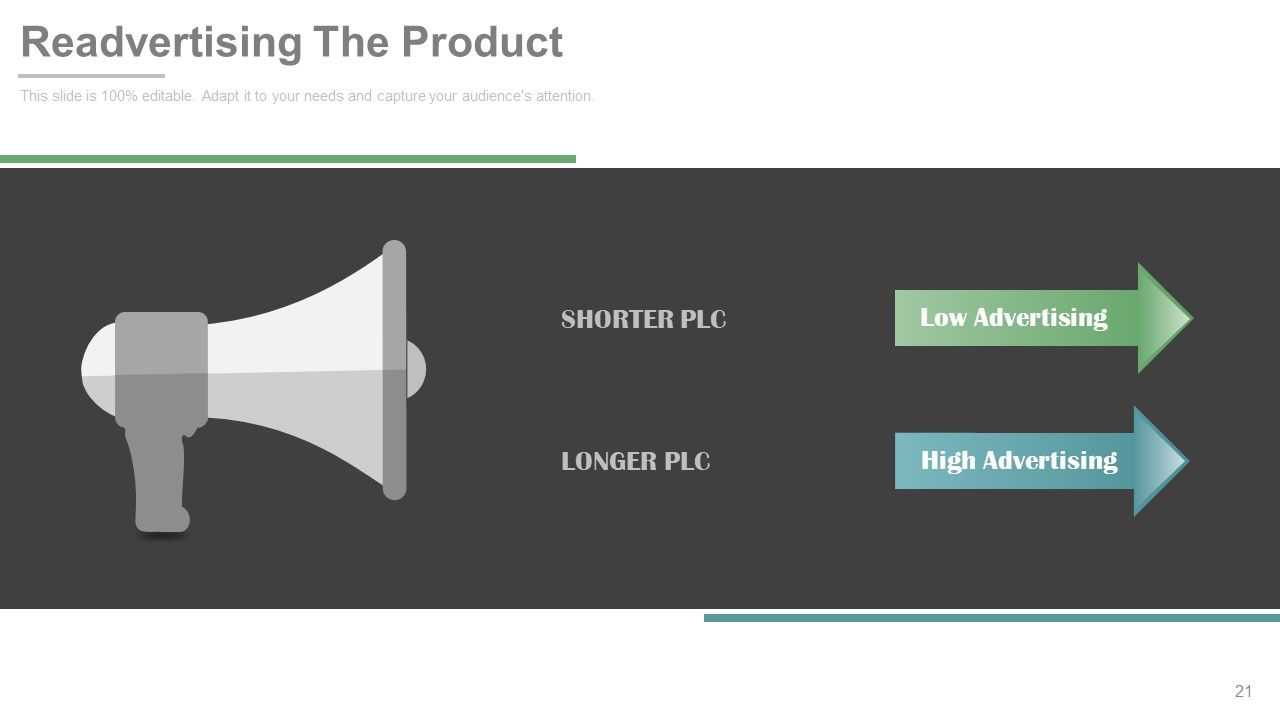
Slide 21: This slide shows Readvertising The Product with loudspeaker imagery.
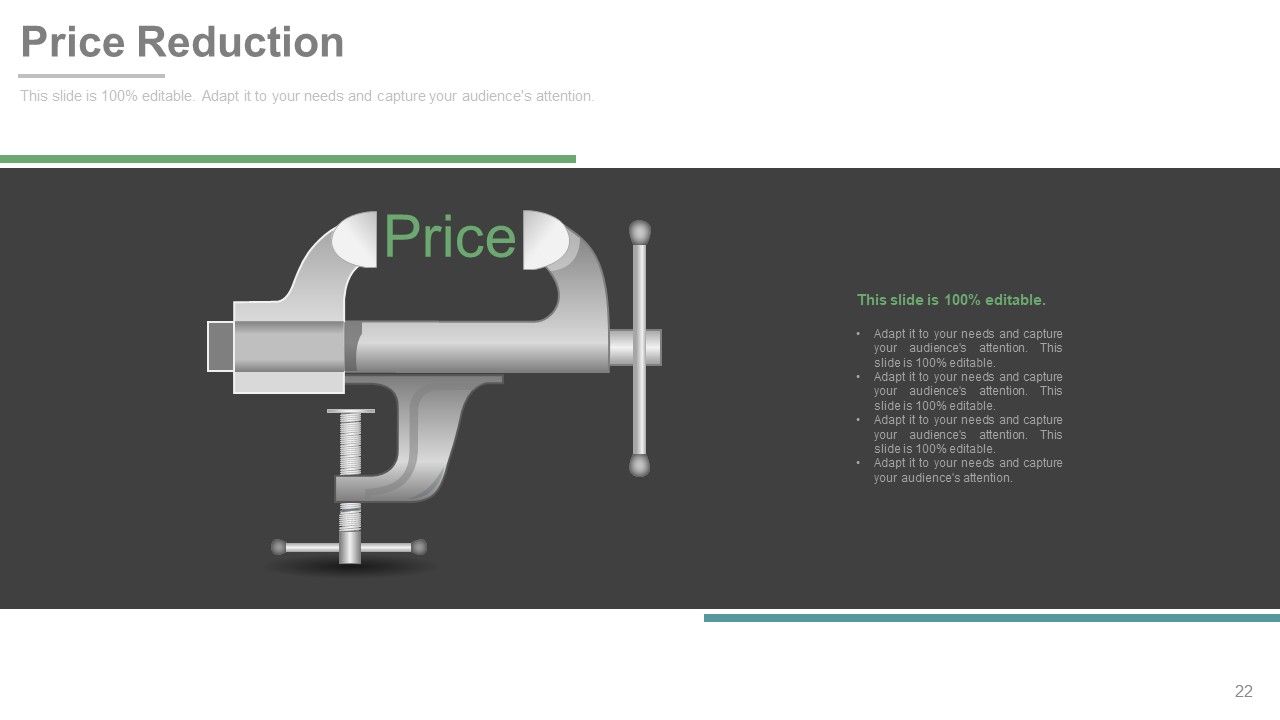
Slide 22: This slide shows Price Reduction with imagery and text boxes.
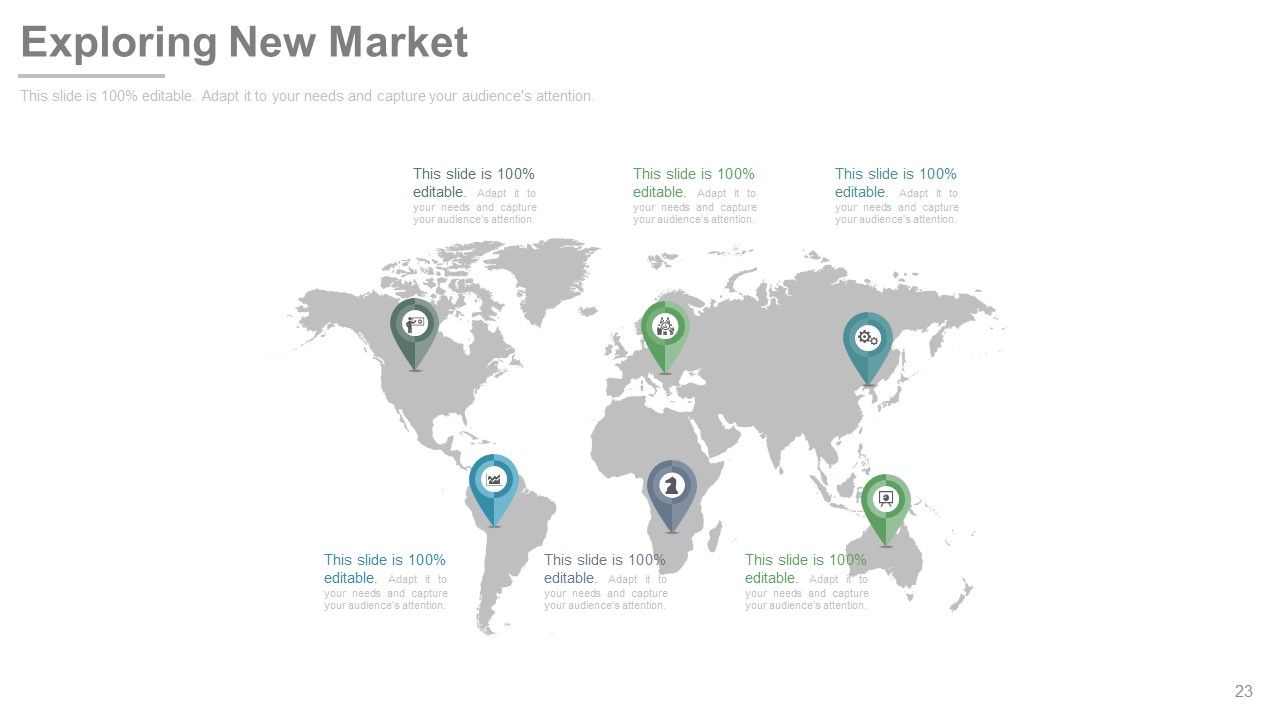
Slide 23: This is Exploring New Market slide on a world map iamge form. You can mark different locations of your market in this map and use it accordingly.
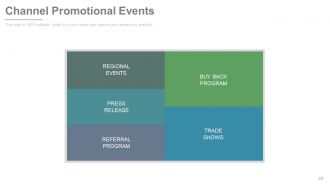
Slide 24: This slide shows Channel Promotional Events namely- REGIONAL EVENTS, REFERRAL PROGRAM, PRESS, RELEASE, BUY BACK PROGRAM, TRADE SHOWS.
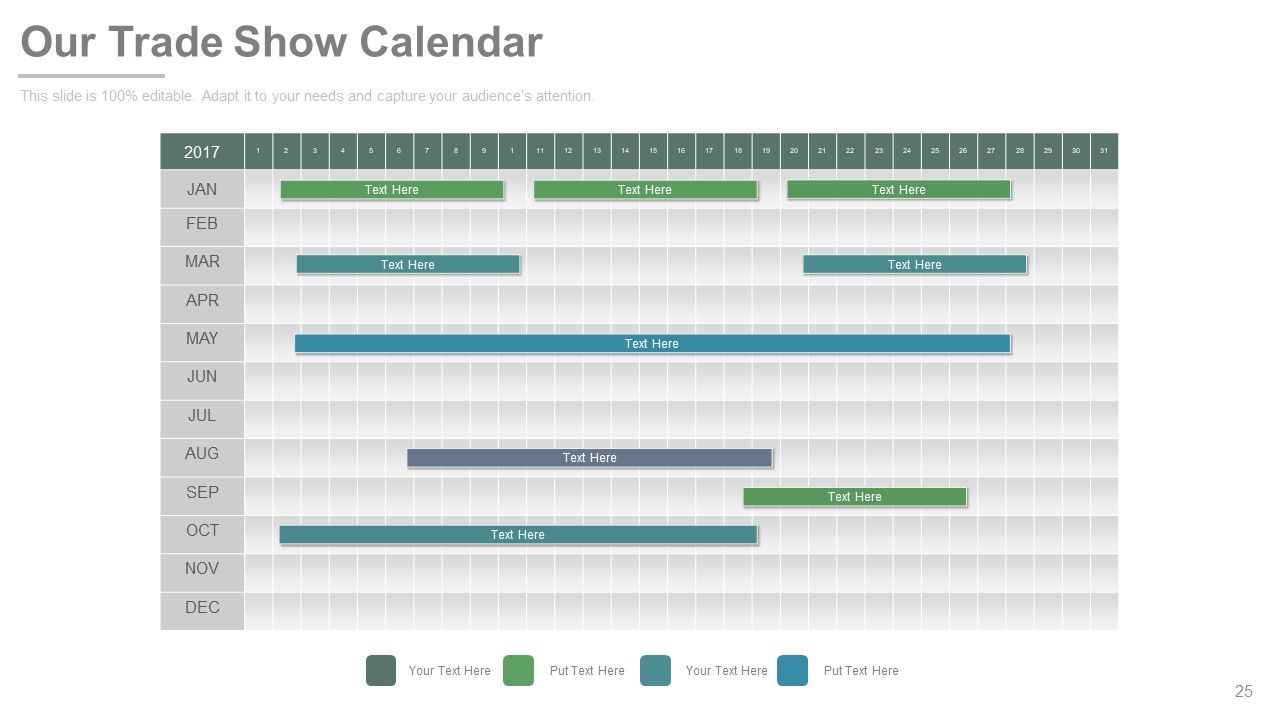
Slide 25: This slide shows Our Trade Show Calendar. Mark the dates of your trade show in this calendar.
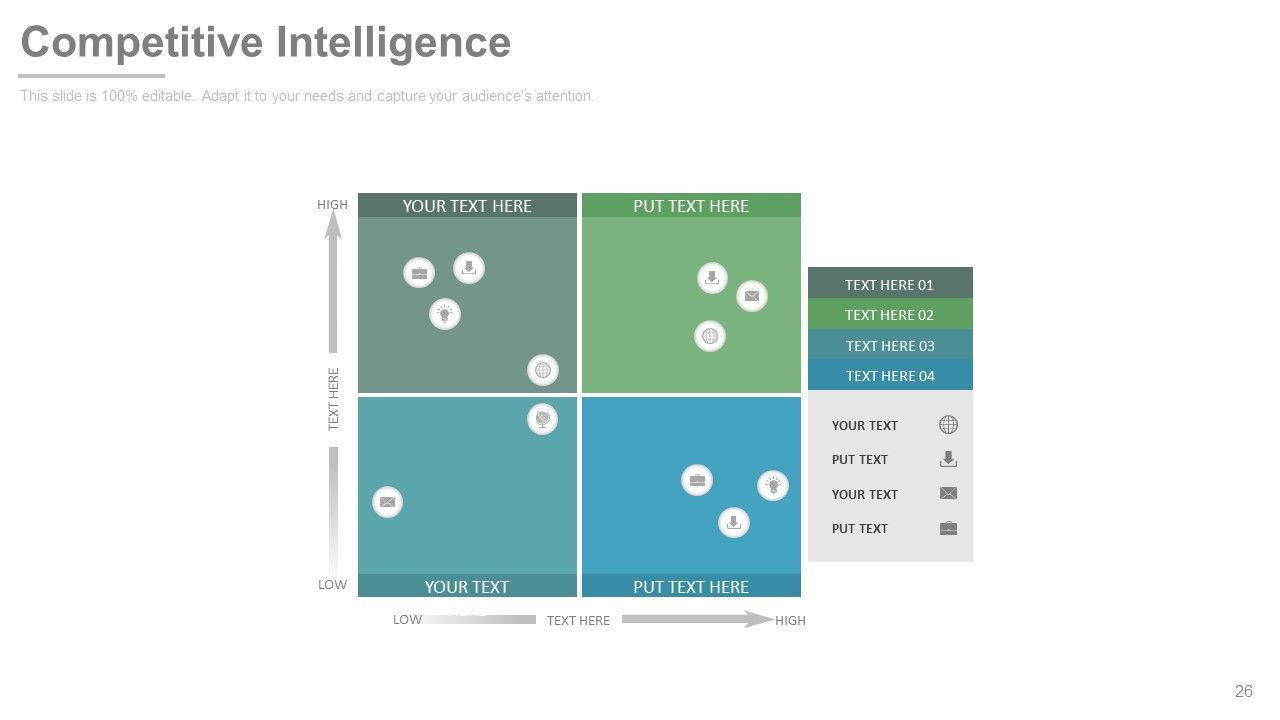
Slide 26: This slide shows Competitive Intelligence matrix with High and Low parameters. Put relevant comparing data here.
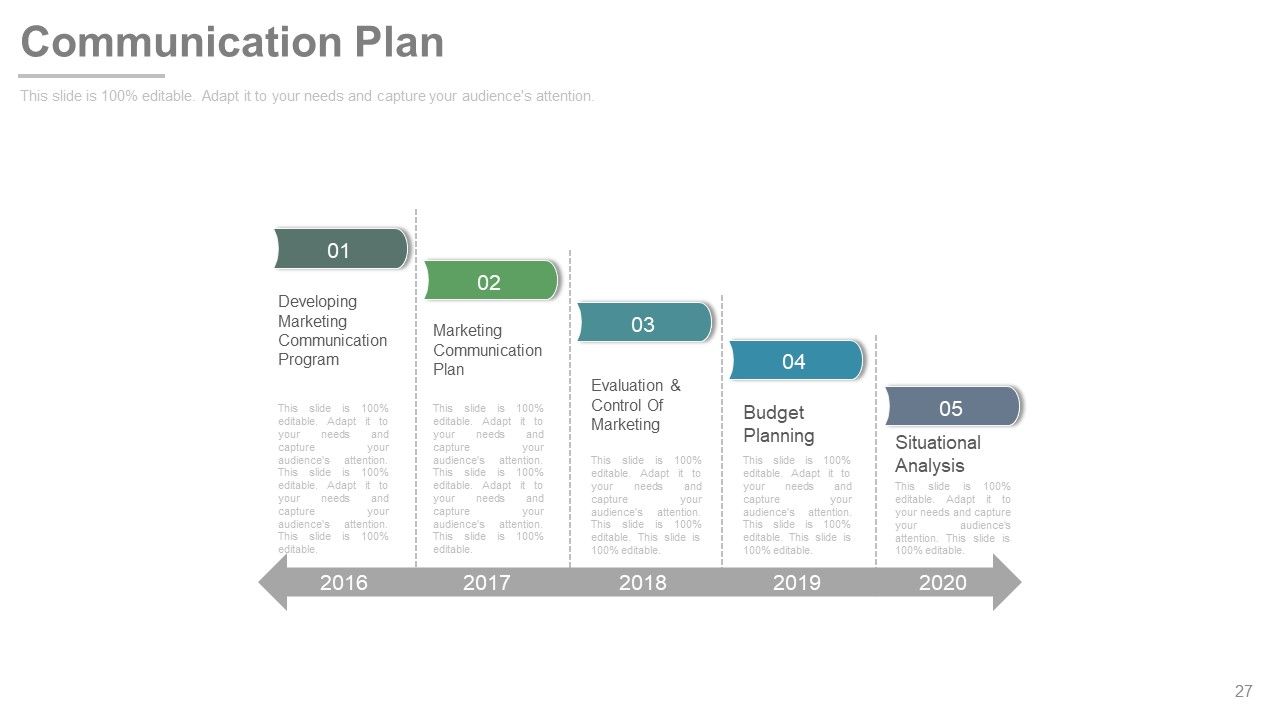
Slide 27: This slide shows five stages in Communication Plan- Developing Marketing Communication Program, Marketing Communication Plan, Evaluation & Control Of Marketing, Budget Planning, Situational Analysis.
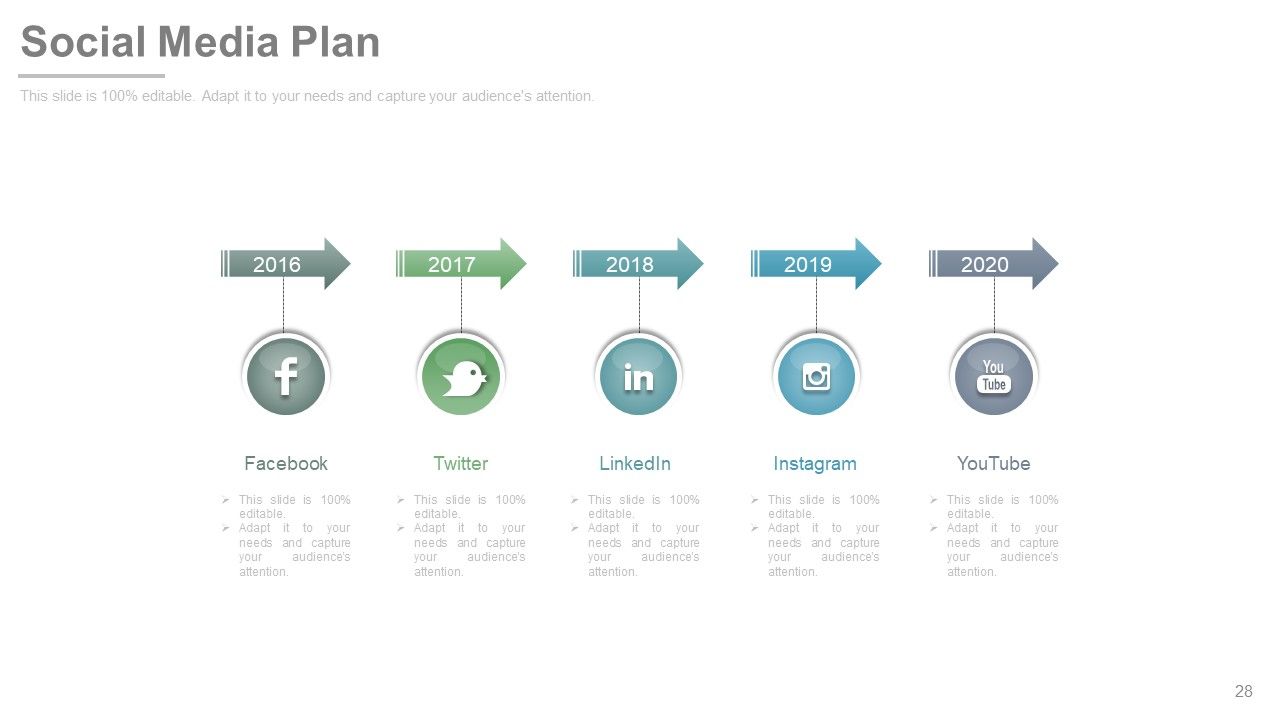
Slide 28: This slide presents Social Media Plan in a timeline form. It also shows the icons of some popular social media sites such as- Facebook, Twitter, LinkedIn, Instagram, YouTube. You can alter them as per your need.
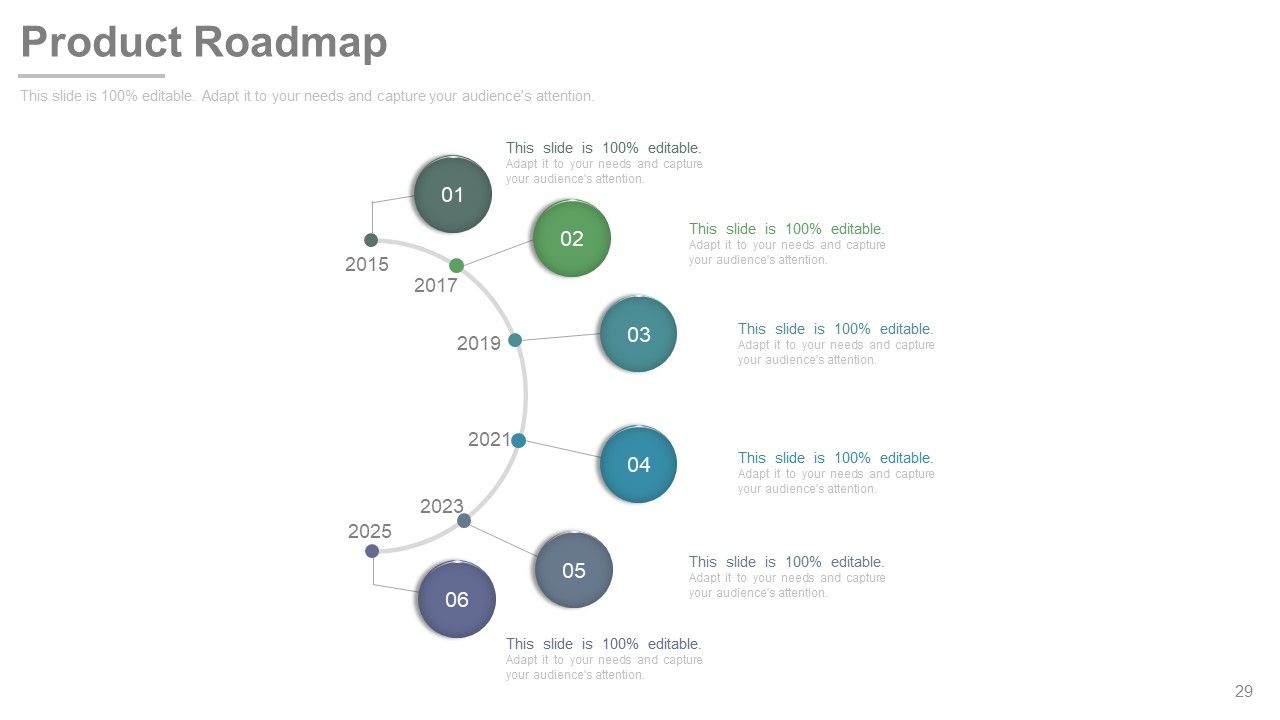
Slide 29: This slide presents Product Roadmap in terms of years.
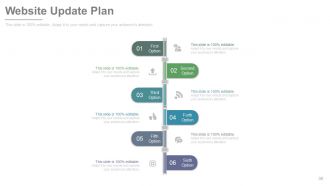
Slide 30: This slide shows Website Update Plan.
Slide 31: This slide presents Customer Testimonial. Add data as per your need.
Slide 32: This slide is titled Additional Slides to proceed further with the presentation. You can also change the content as per need.
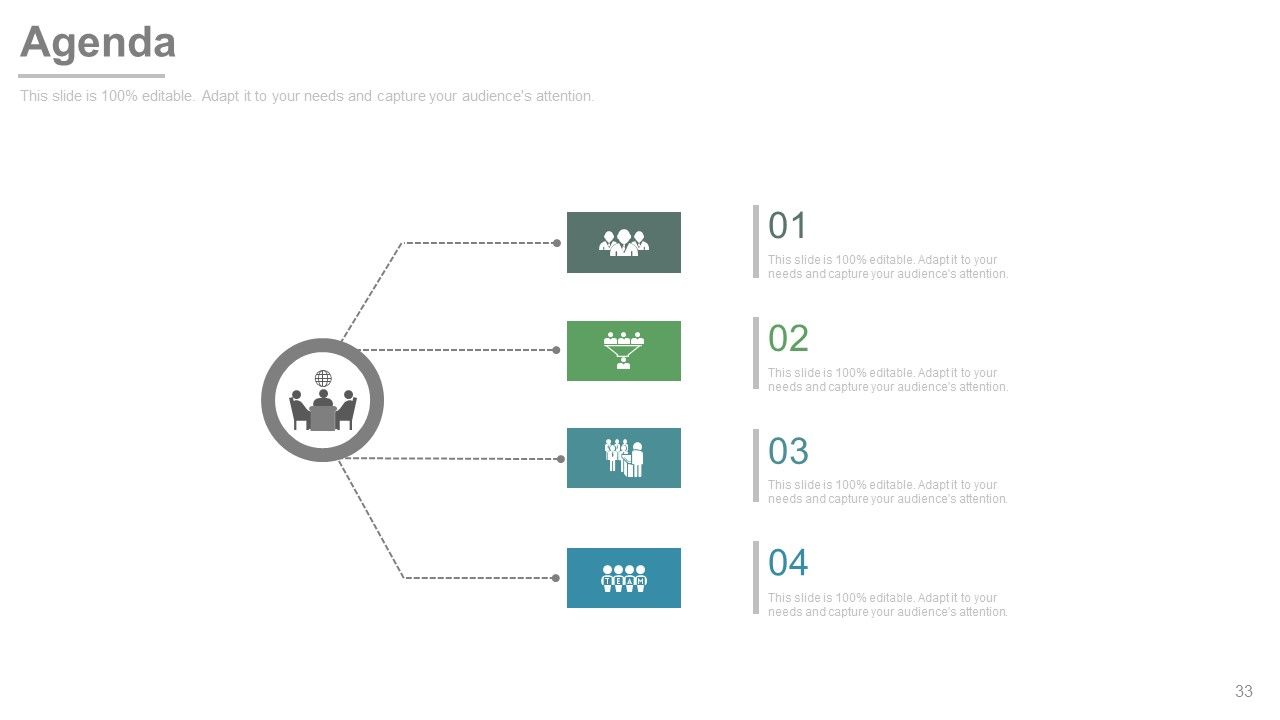
Slide 33: This is an Agenda slide. Use it to showcase your product/ company agenda etc.
Slide 34: This is Our Vision slide with text boxes. State your vision here.
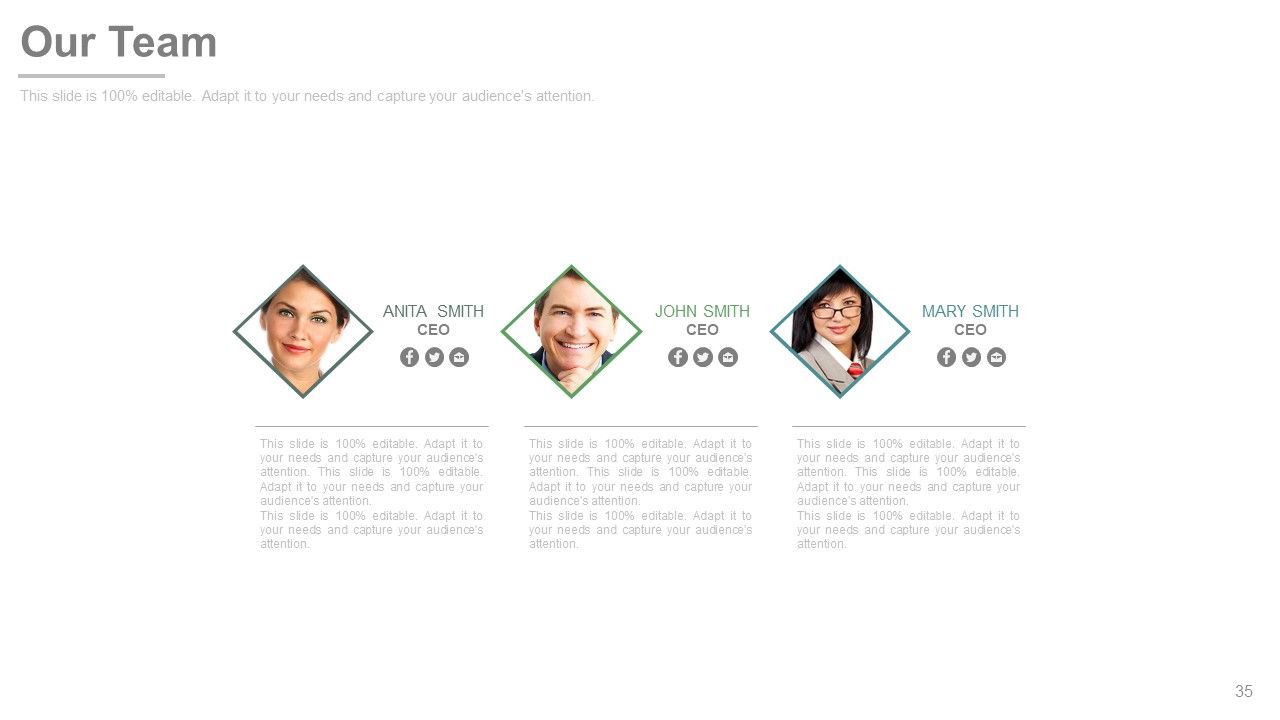
Slide 35: This is Our Team slide. Mention name, designation etc. here.
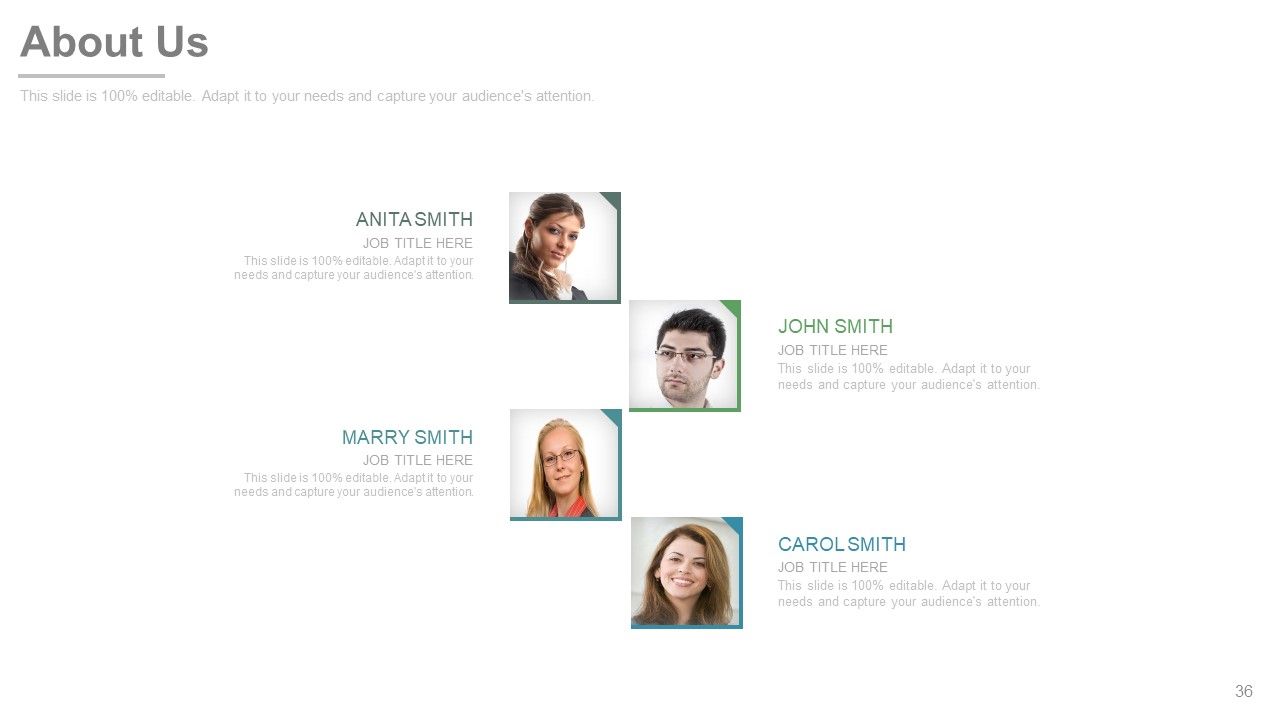
Slide 36: This is an About Us slide. Provide a brief introduction about company/ team here.
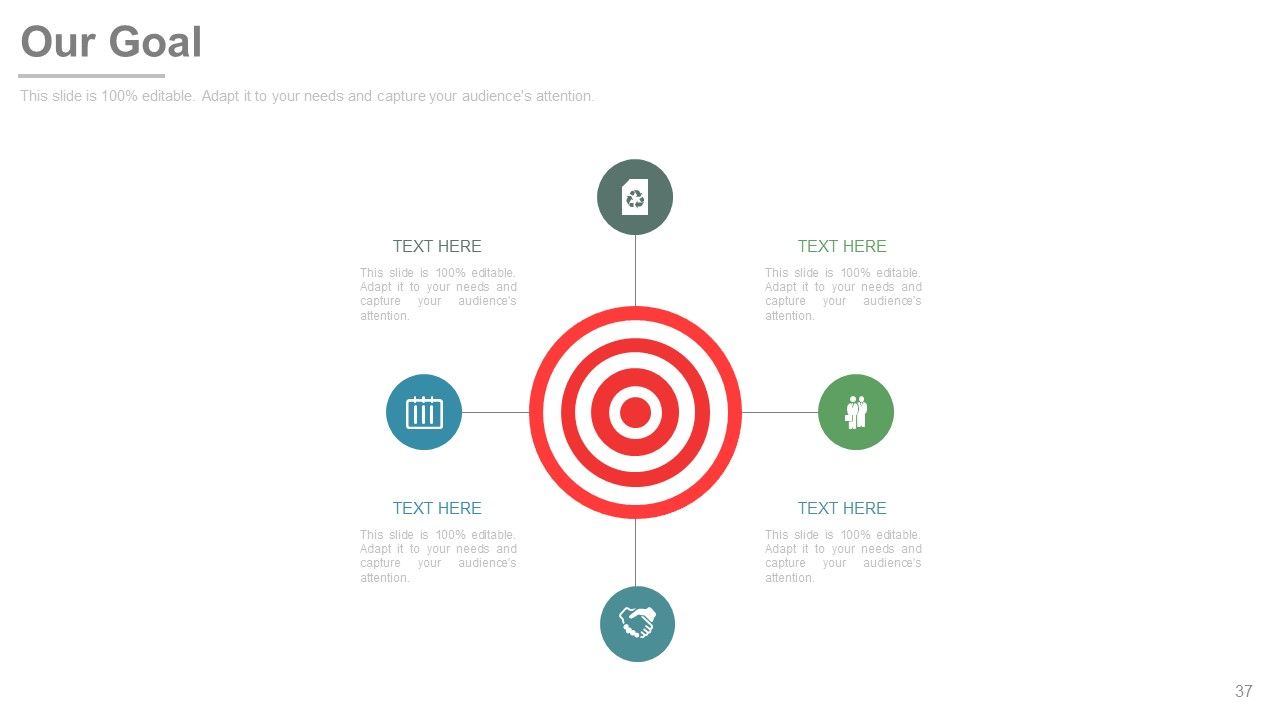
Slide 37: This is Our Goal slide to state company goals, aspirations etc.
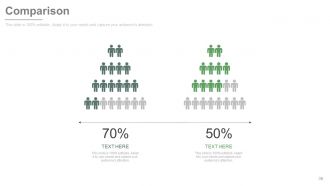
Slide 38: This slide displays Comparison on the basis of gender. It shows male and female image compared in terms of percentage.
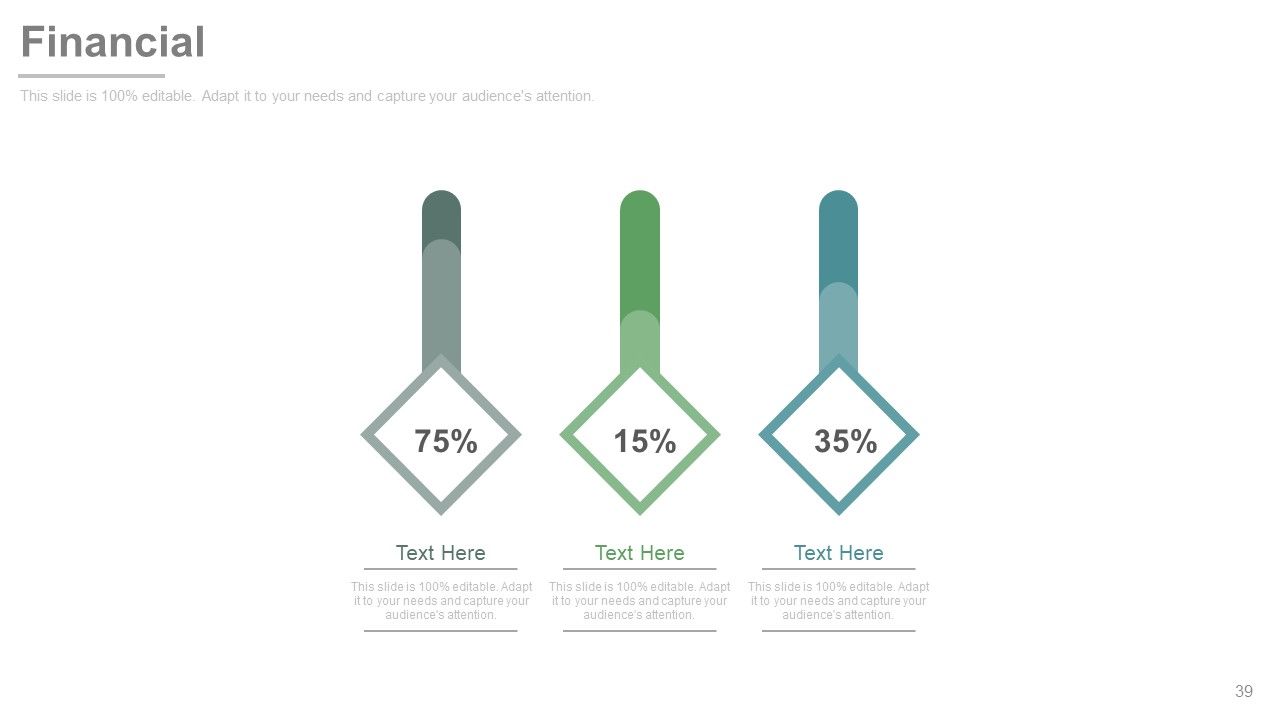
Slide 39: This is a Financial score slide to show financial aspects here.
Slide 40: This is a Quotes slide to convey message, beliefs etc.
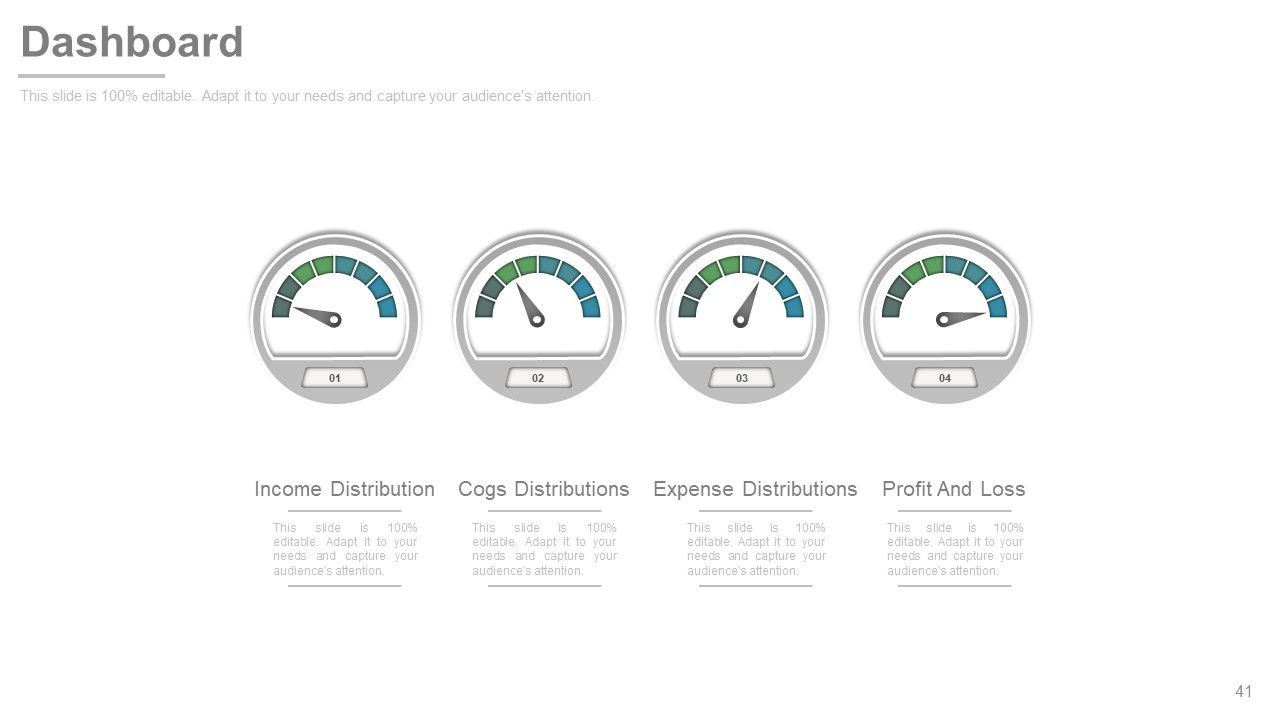
Slide 41: This is a Dashboard slide showing- Income Distribution, Cogs Distributions, Expense Distributions, Profit And Loss.
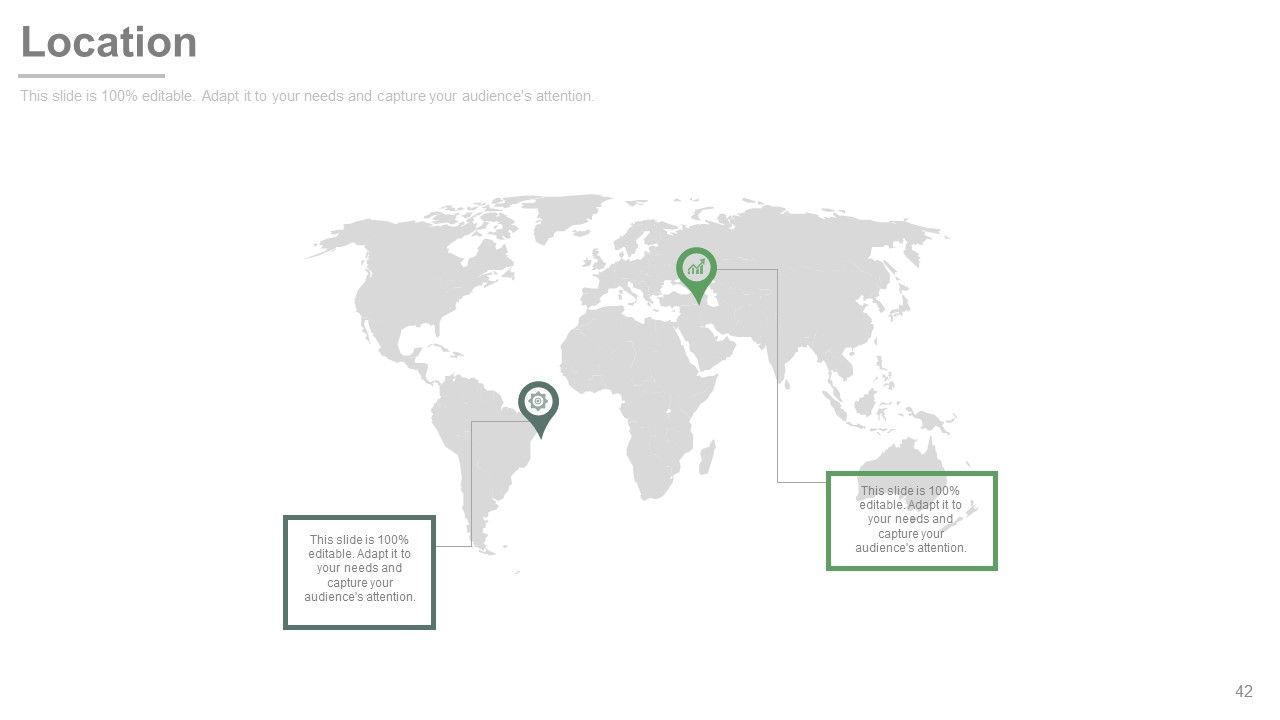
Slide 42: This is a Location slide to show global growth, presence etc. on a world map image.
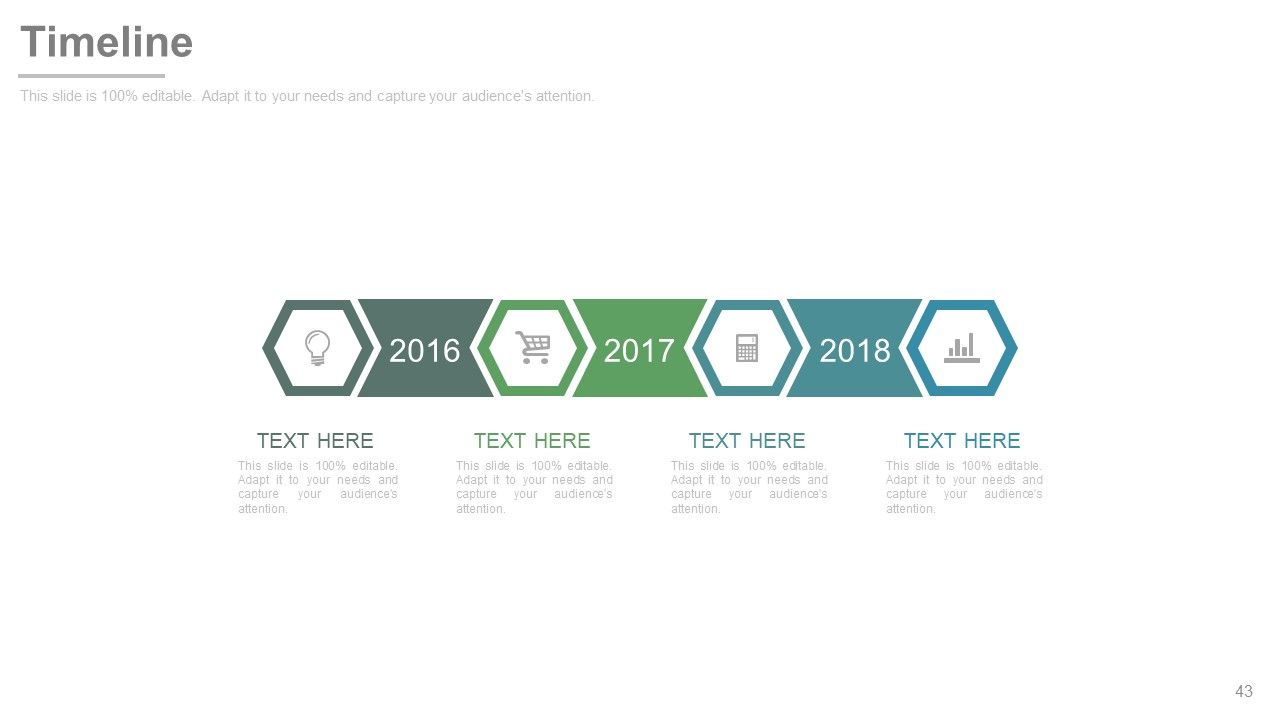
Slide 43: This is a Timeline slide to present important dates, journey, evolution, milestones etc.
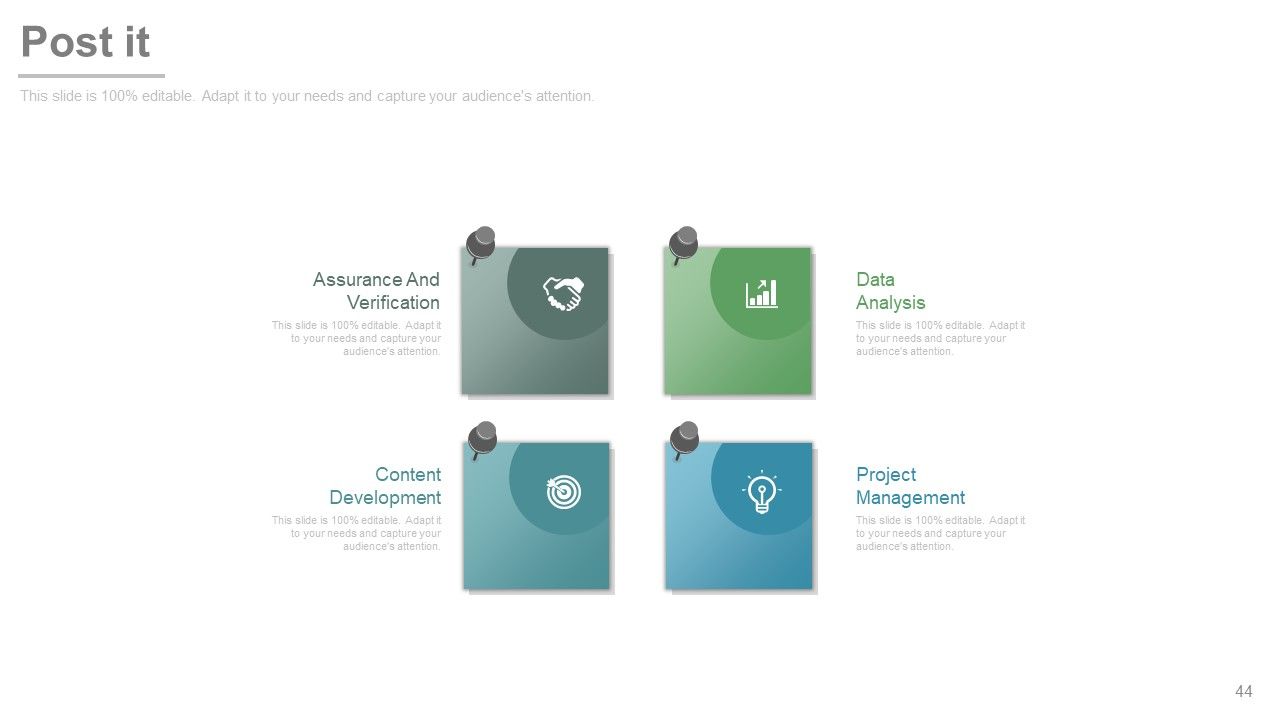
Slide 44: This is a Post it notes slide showing the following notes- Data Analysis, Project Management, Assurance And Verification, Content Development.
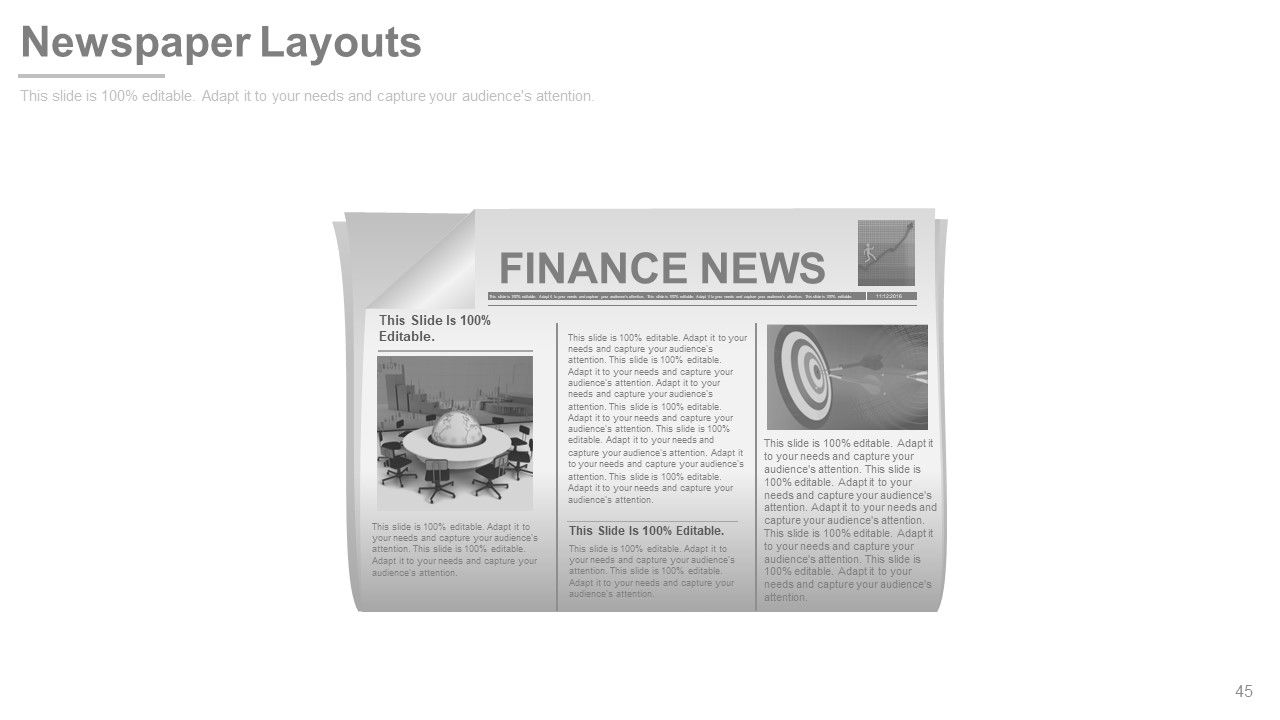
Slide 45: This slide presents Newspaper Layouts with text boxes to flash company news, position etc.
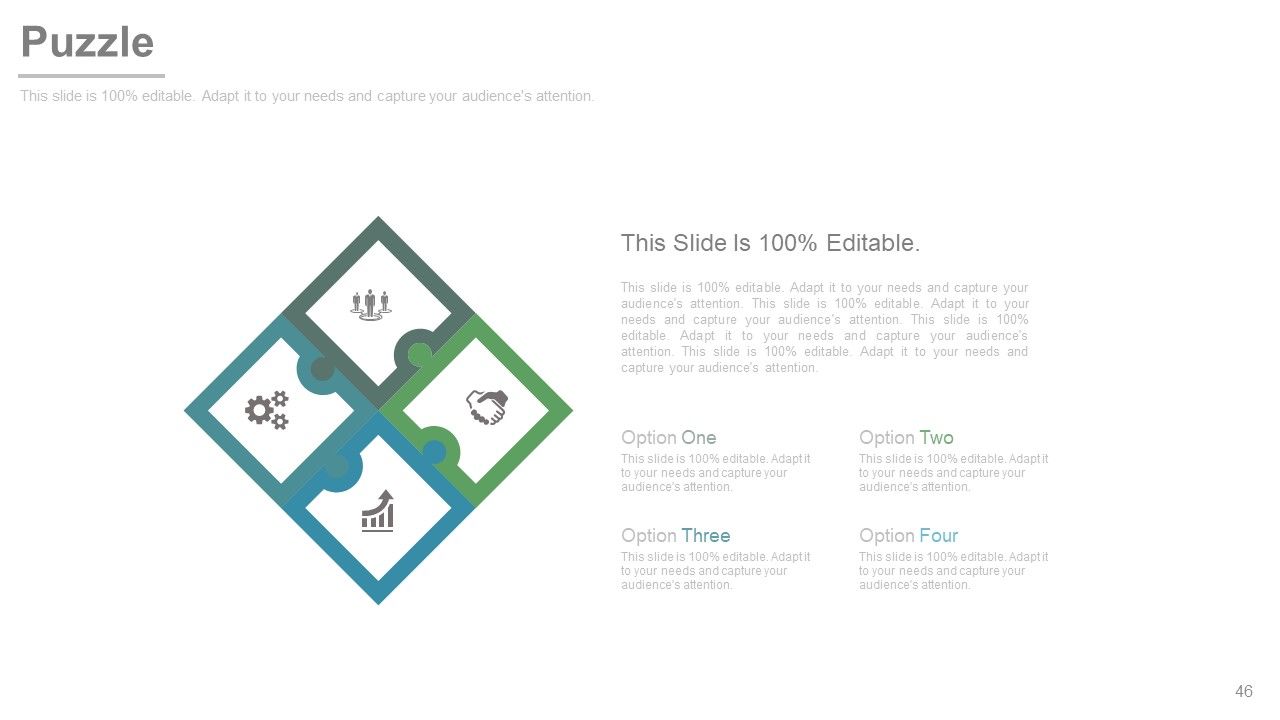
Slide 46: This is a Puzzle image slide to show information, specifications etc.
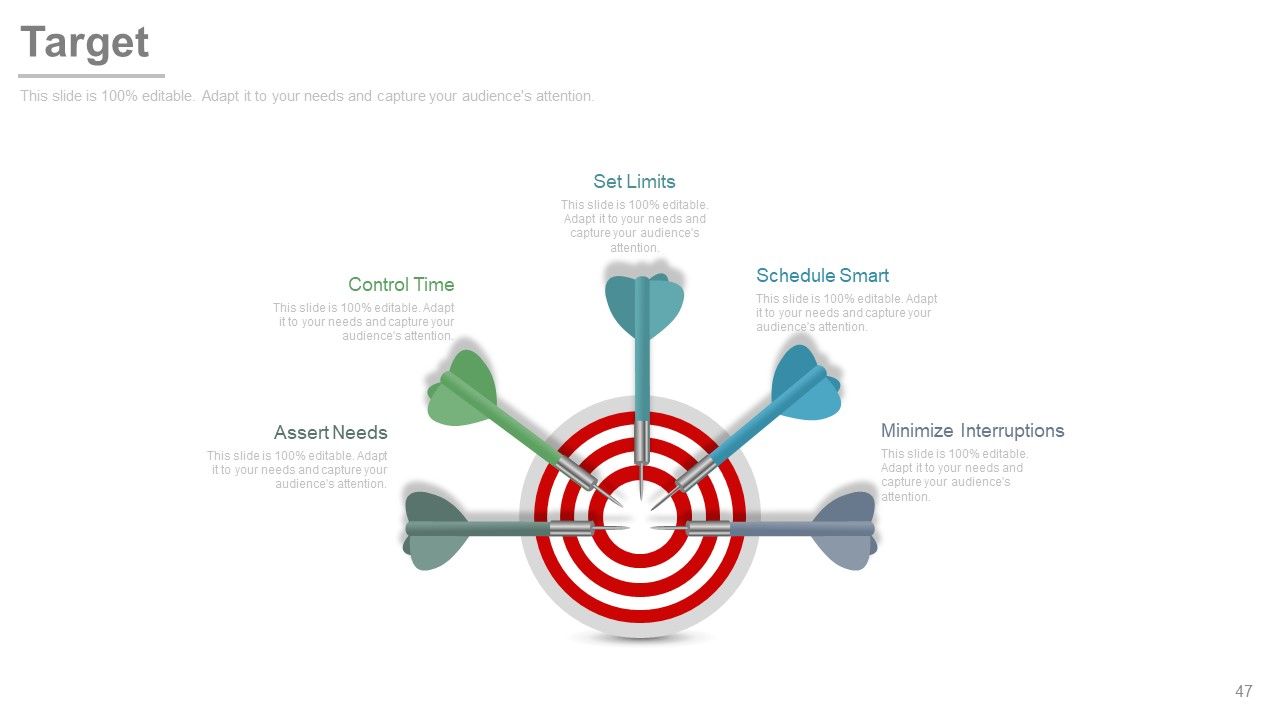
Slide 47: This is a Target image slide to show targets, goals, information, specifications etc.
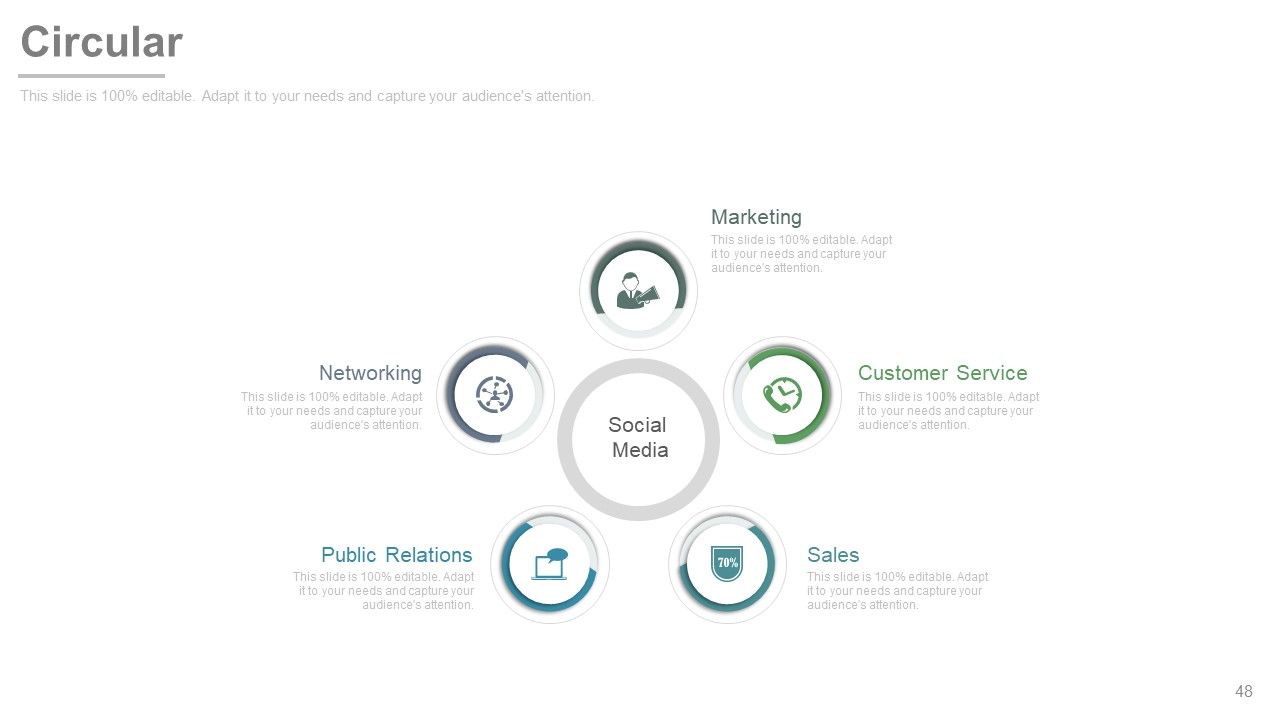
Slide 48: This is a Circular image slide showing Social Media consisting of the following components- Marketing, Customer Service, Public Relations, Networking, Sales.
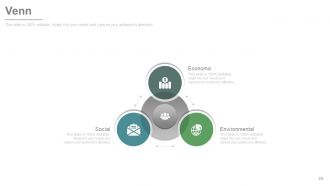
Slide 49: This is a Venn diagram slide showing- Economic, Environmental, Social.
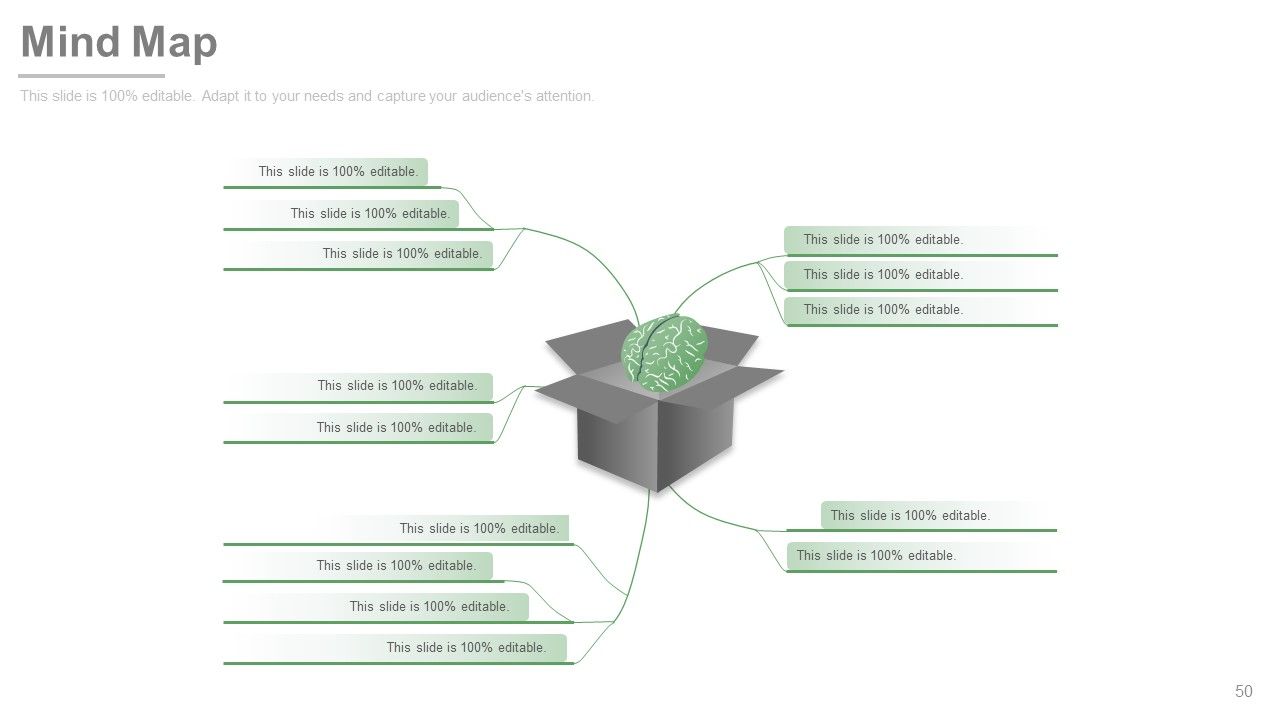
Slide 50: This is a Mind map image slide to show information, segregation, specifications etc.
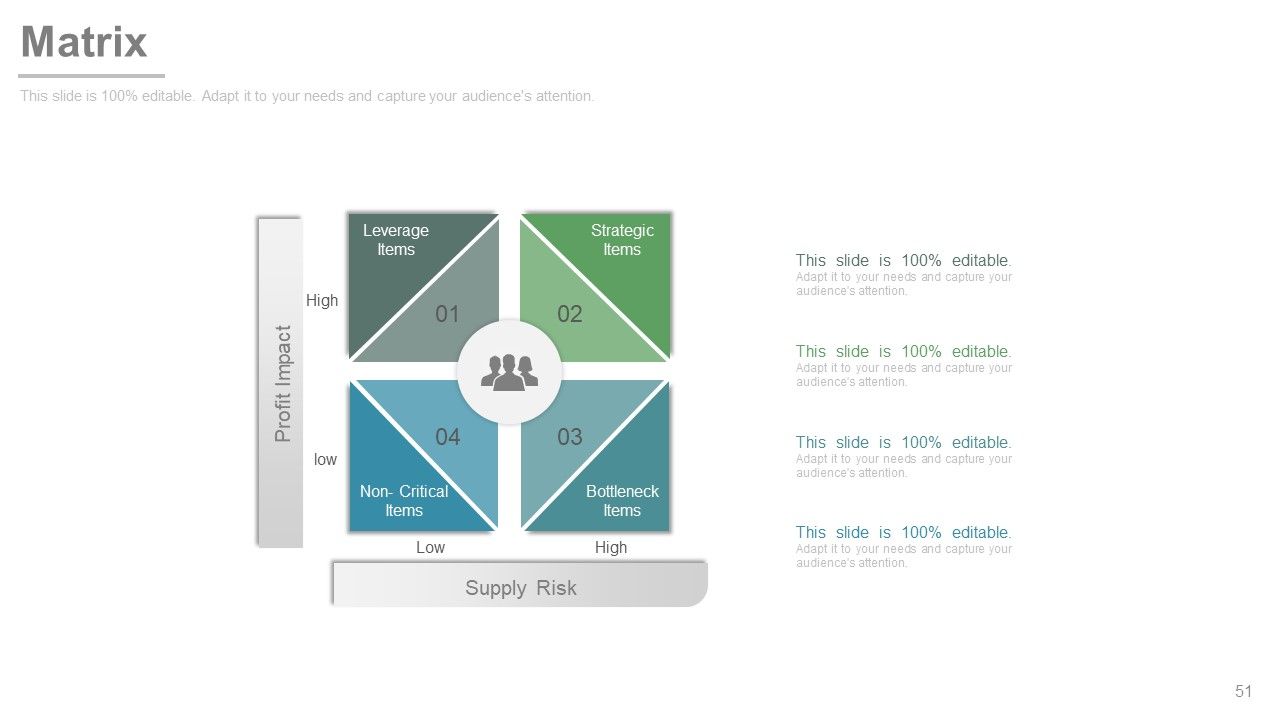
Slide 51: This slide shows a Matrix with two parameters- Supply Risk, Profit Impact.
Slide 52: This is a Lego image slide to show information, specifications etc.
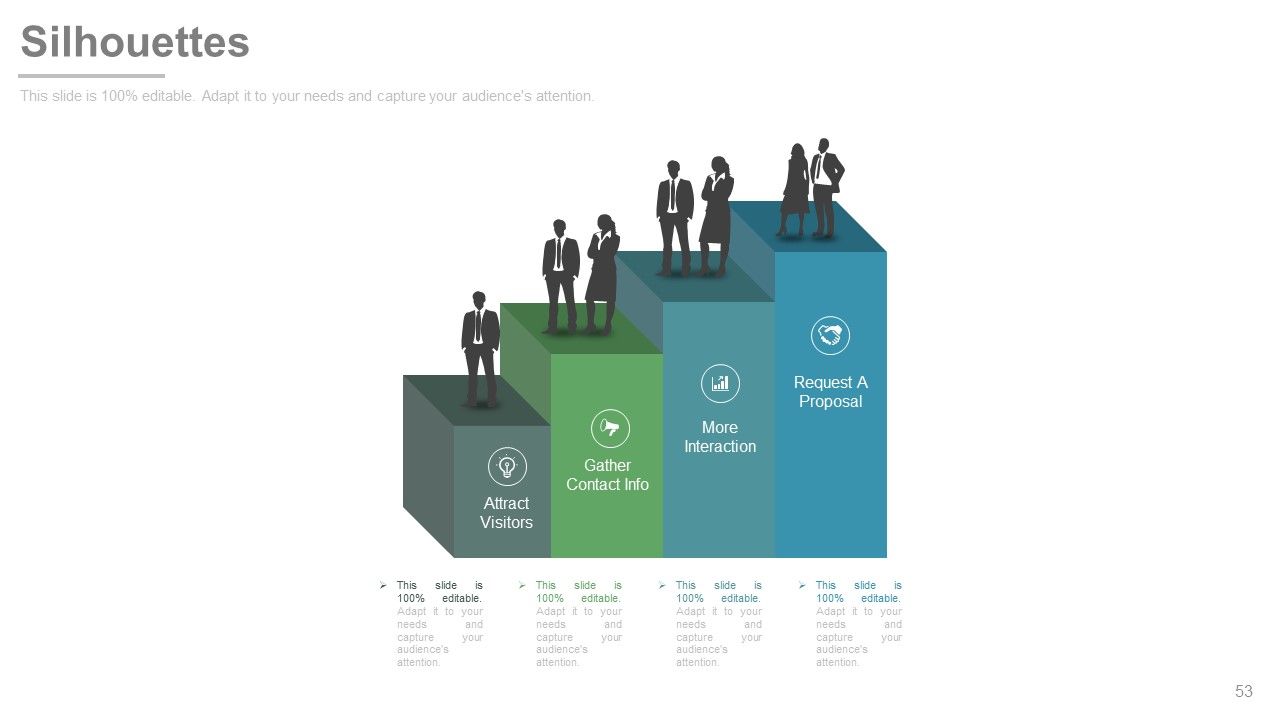
Slide 53: This is Silhouettes slide showing- Attract Visitors, Gather Contact Info, More Interaction, Request A Proposal.
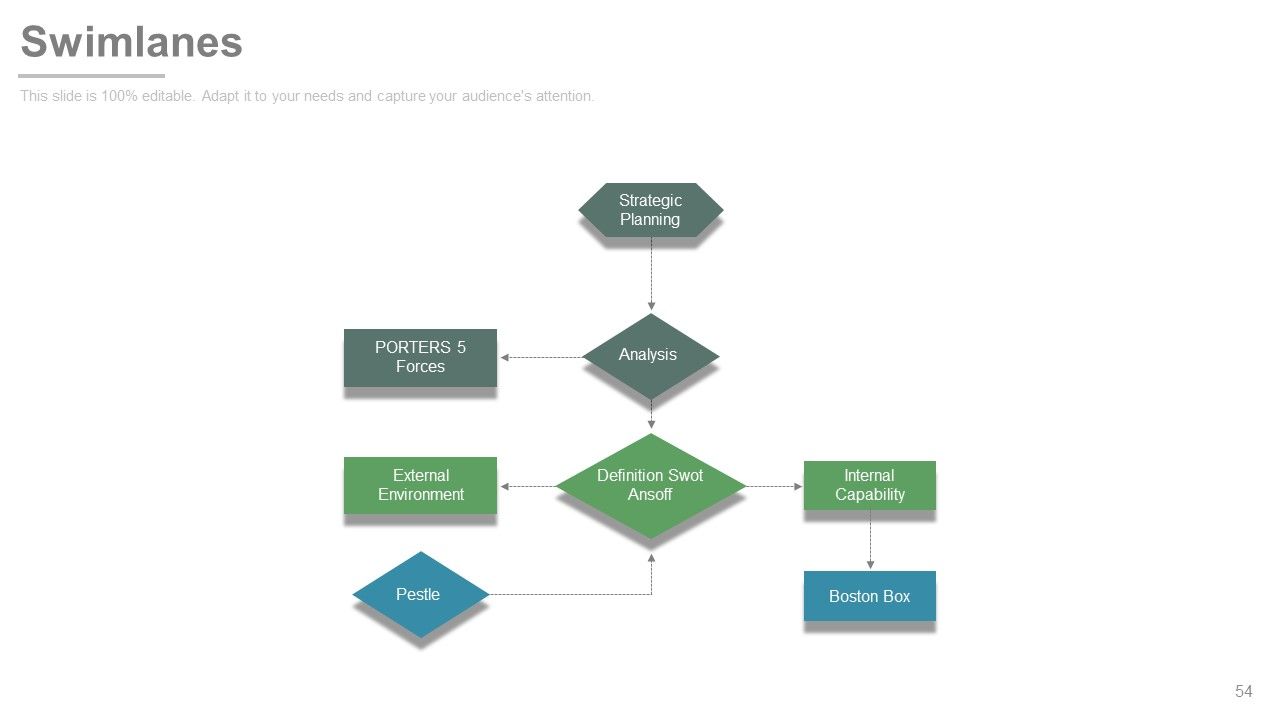
Slide 54: This slide presents Swimlanes showing Strategic Planning.
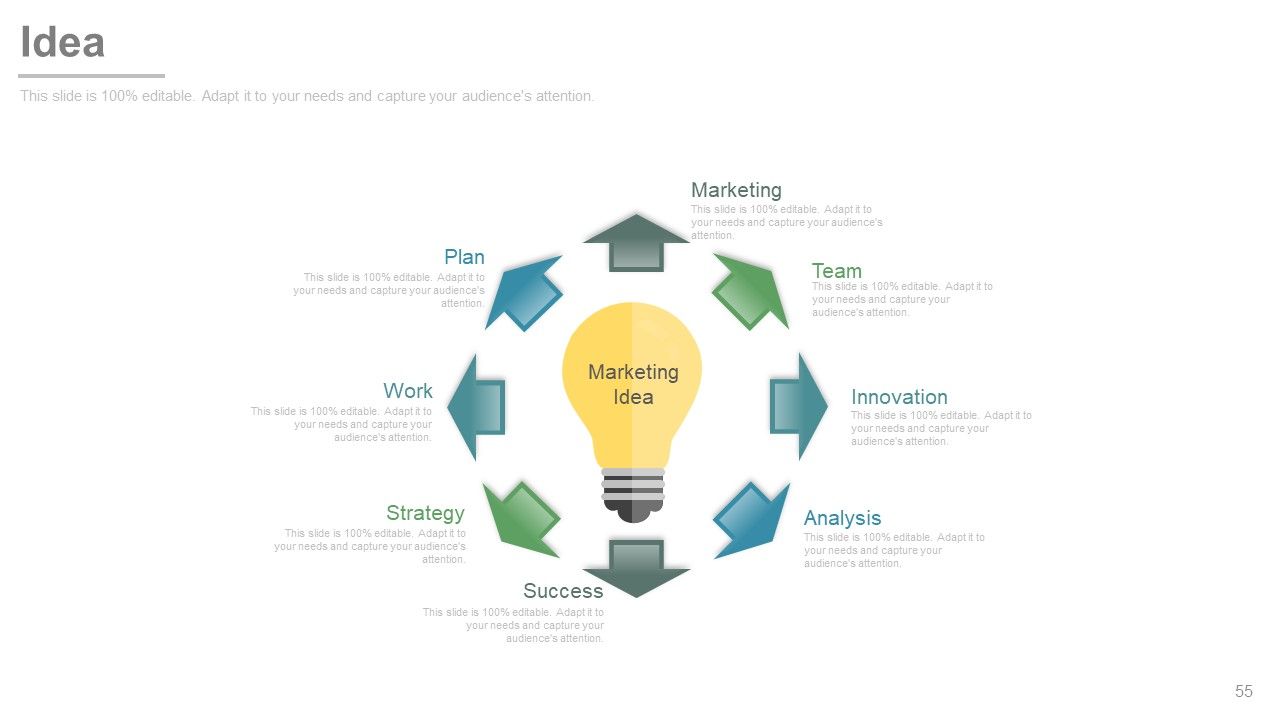
Slide 55: This is an Idea slide with bulb imagery showing Maketing Idea. This marketing idea consists of- Marketing, Team, Innovation, Analysis, Success, Strategy, Work, Plan.
Slide 56: This slide shows a Magnifying glass image with text boxes. State information etc. here.
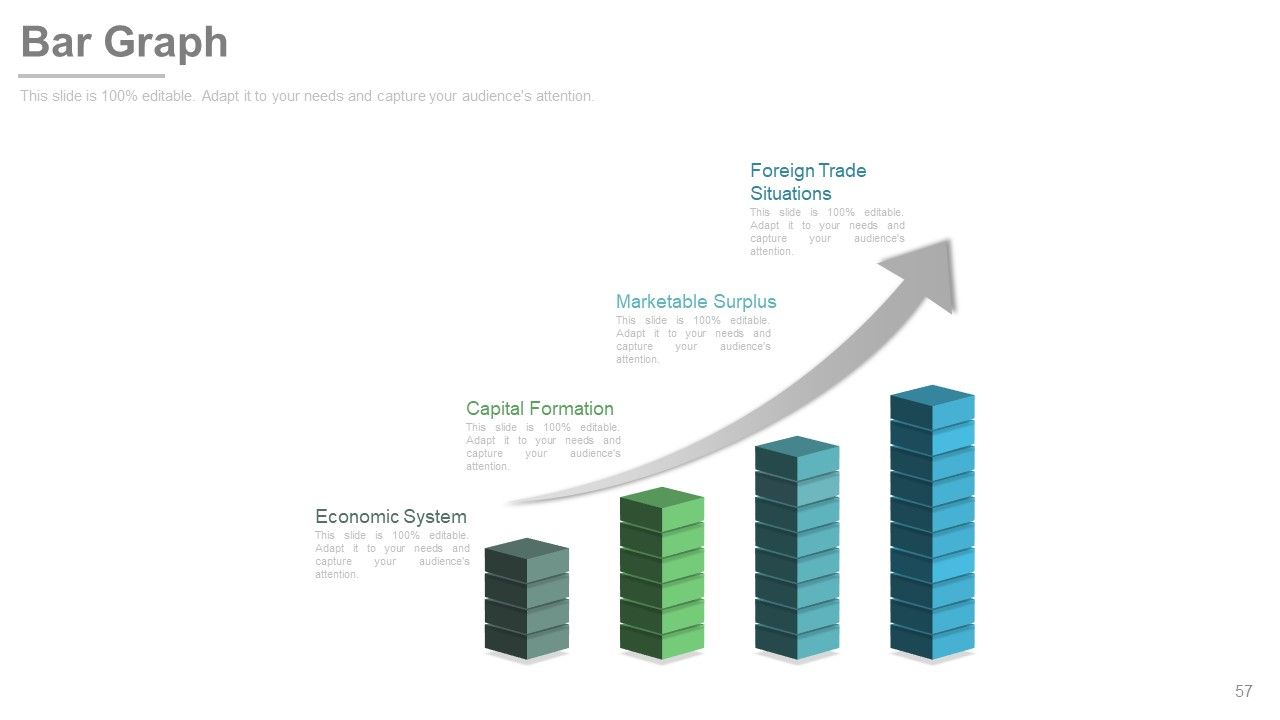
Slide 57: This slide presents Bar Graph showing- Economic System, Capital Formation, Marketable Surplus, Foreign Trade Situations.
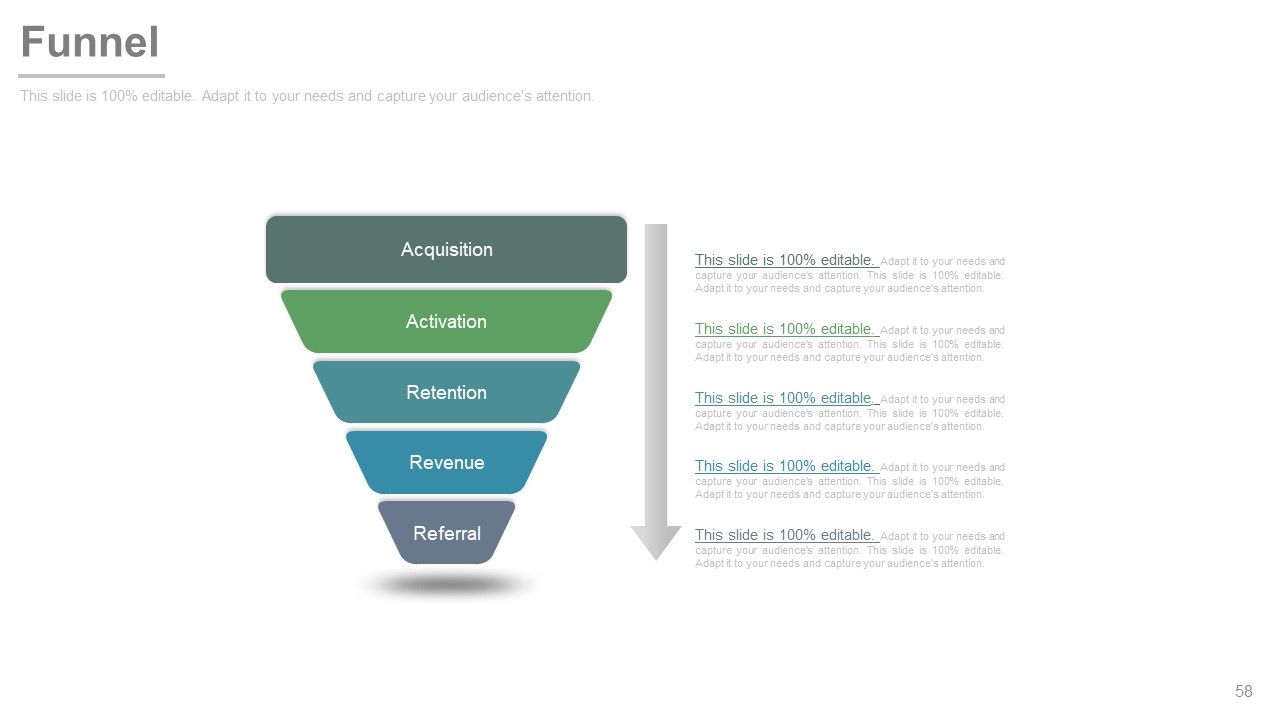
Slide 58: This is a Funnel image slide with the following stages- Acquisition, Activation, Retention, Revenue, Referral.
Slide 59: This is a Thank You slide with Address# street number, city, state, Contact Numbers, Email Address
New product development and life cycle strategies process with all 59 slides:
Use our New Product Development And Life Cycle Strategies Process to effectively help you save your valuable time. They are readymade to fit into any presentation structure.
-
Understandable and informative presentation.
-
Excellent products for quick understanding.
-
Excellent Designs.
-
Best Representation of topics, really appreciable.
-
Much better than the original! Thanks for the quick turnaround.
-
Great designs, really helpful.
-
Innovative and attractive designs.
-
Designs have enough space to add content.


