Oil production project cost curve covid business survive adapt post recovery oil and gas industry ppt introduction
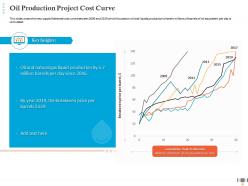
This slide covers the new supply flattened cost curve between 2009 and 2019 which focuses on oil and liquids production wherein millions of barrels of oil equivalent per day is calculated
You must be logged in to download this presentation.
PowerPoint presentation slides
This slide covers the new supply flattened cost curve between 2009 and 2019 which focuses on oil and liquids production wherein millions of barrels of oil equivalent per day is calculated. Deliver an outstanding presentation on the topic using thisOil Production Project Cost Curve COVID Business Survive Adapt Post Recovery Oil And Gas Industry Ppt Introduction. Dispense information and present a thorough explanation of Oil Production Project Cost Curve using the slides given. This template can be altered and personalized to fit your needs. It is also available for immediate download. So grab it now.
People who downloaded this PowerPoint presentation also viewed the following :
Oil production project cost curve covid business survive adapt post recovery oil and gas industry ppt introduction with all 2 slides:
Use our Oil Production Project Cost Curve COVID Business Survive Adapt Post Recovery Oil And Gas Industry Ppt Introduction to effectively help you save your valuable time. They are readymade to fit into any presentation structure.
-
Unique and attractive product design.
-
Unique research projects to present in meeting.
-
Informative presentations that are easily editable.


