Optimizing endgame powerpoint presentation slides
Our Optimizing Endgame Powerpoint Presentation Slides are topically designed to provide an attractive backdrop to any subject. Use them to look like a presentation pro.
Our Optimizing Endgame Powerpoint Presentation Slides are topically designed to provide an attractive backdrop to any subje..
- Google Slides is a new FREE Presentation software from Google.
- All our content is 100% compatible with Google Slides.
- Just download our designs, and upload them to Google Slides and they will work automatically.
- Amaze your audience with SlideTeam and Google Slides.
-
Want Changes to This PPT Slide? Check out our Presentation Design Services
- WideScreen Aspect ratio is becoming a very popular format. When you download this product, the downloaded ZIP will contain this product in both standard and widescreen format.
-

- Some older products that we have may only be in standard format, but they can easily be converted to widescreen.
- To do this, please open the SlideTeam product in Powerpoint, and go to
- Design ( On the top bar) -> Page Setup -> and select "On-screen Show (16:9)” in the drop down for "Slides Sized for".
- The slide or theme will change to widescreen, and all graphics will adjust automatically. You can similarly convert our content to any other desired screen aspect ratio.
Compatible With Google Slides

Get This In WideScreen
You must be logged in to download this presentation.
PowerPoint presentation slides
Presenting our Optimizing Endgame PowerPoint Presentation Slides. The template is fully editable in PowerPoint and compatible with Google Slides as well. You can adapt the slideshow according to your unique business requirements. Add your text, image, or icon with ease. The template can be converted into different formats such as JPG, PDF, etc. without any hassle. High-quality graphics ensure an attention-grabbing presentation. Additionally, it is available in both 4:3 and 16:9 aspect ratios.
People who downloaded this PowerPoint presentation also viewed the following :
Content of this Powerpoint Presentation
Slide 1: This is the cover slide of Optimizing Endgame PowerPoint Presentation.
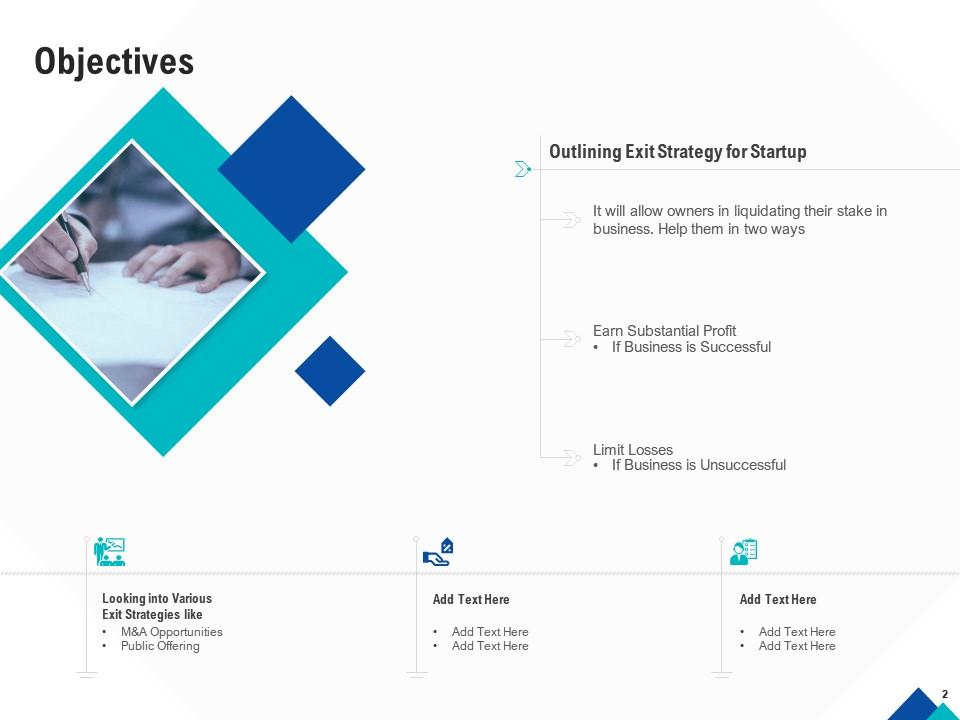
Slide 2: This slide presents the Objectives of Optimizing Endgame PowerPoint Presentation.
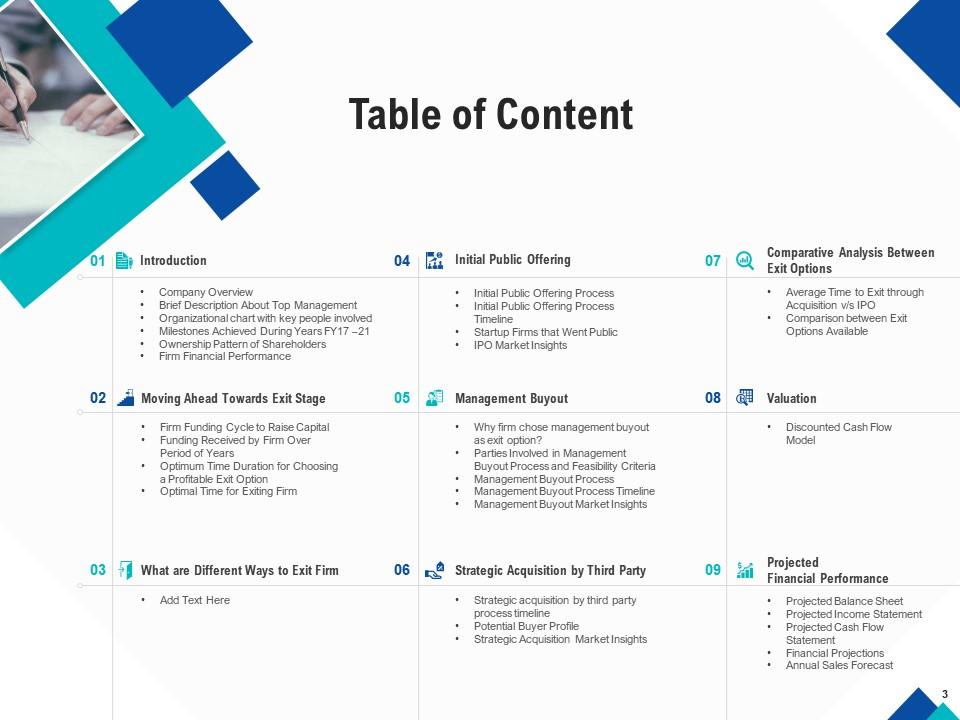
Slide 3: This is the Table of Contents slide that lists out all the essential elements covered in the deck.
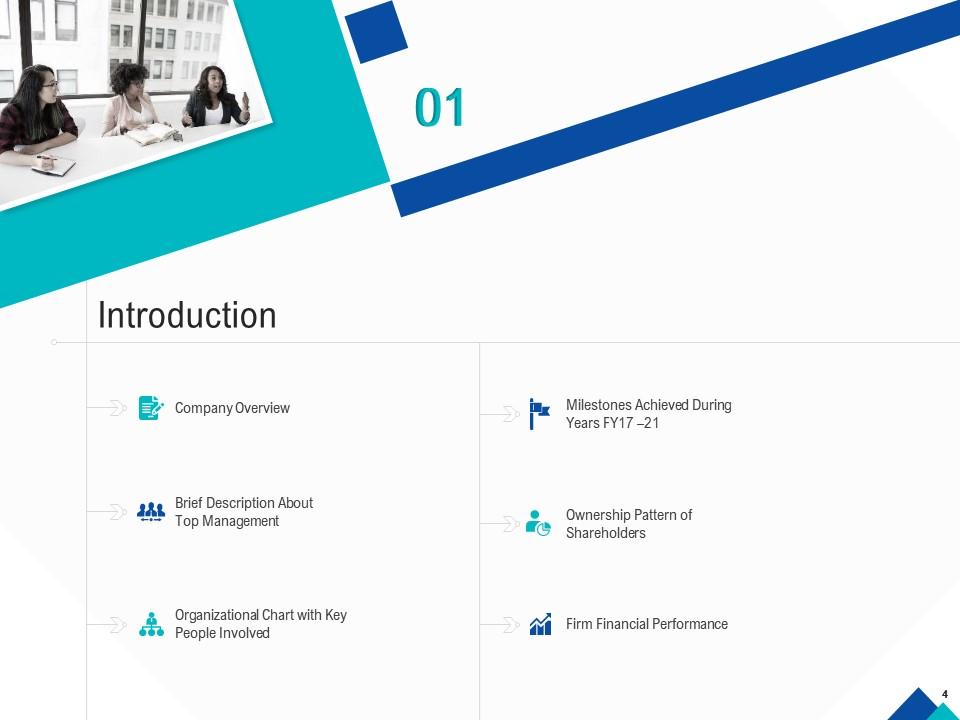
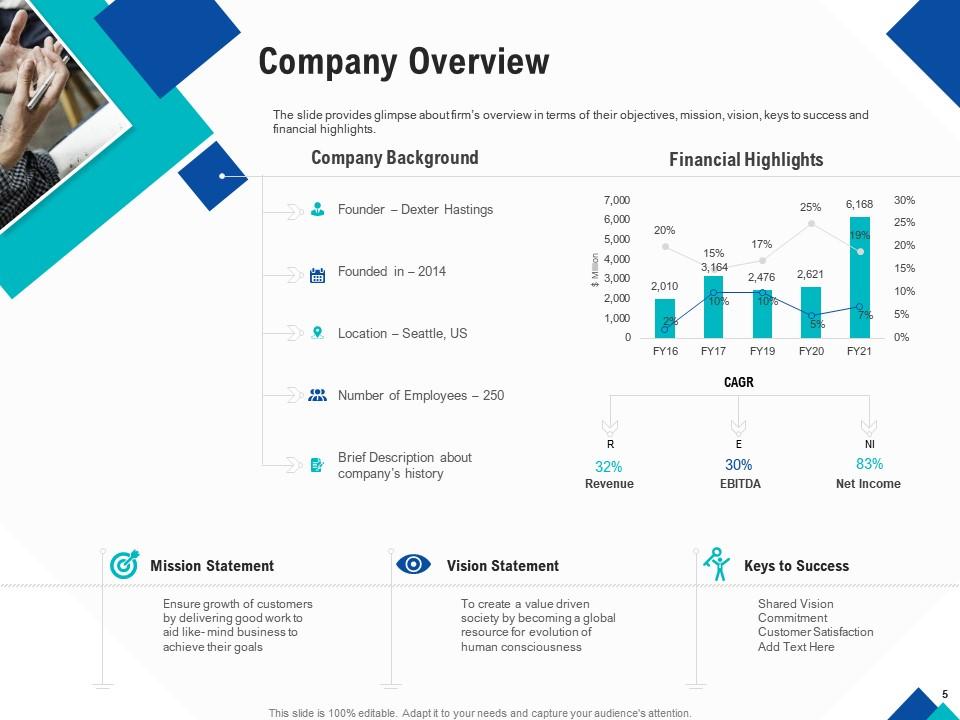
Slide 4: This slide presents Company Overview
Slide 5: The slide provides glimpse about firm’s overview in terms of their objectives, mission, vision, keys to success and financial highlights.
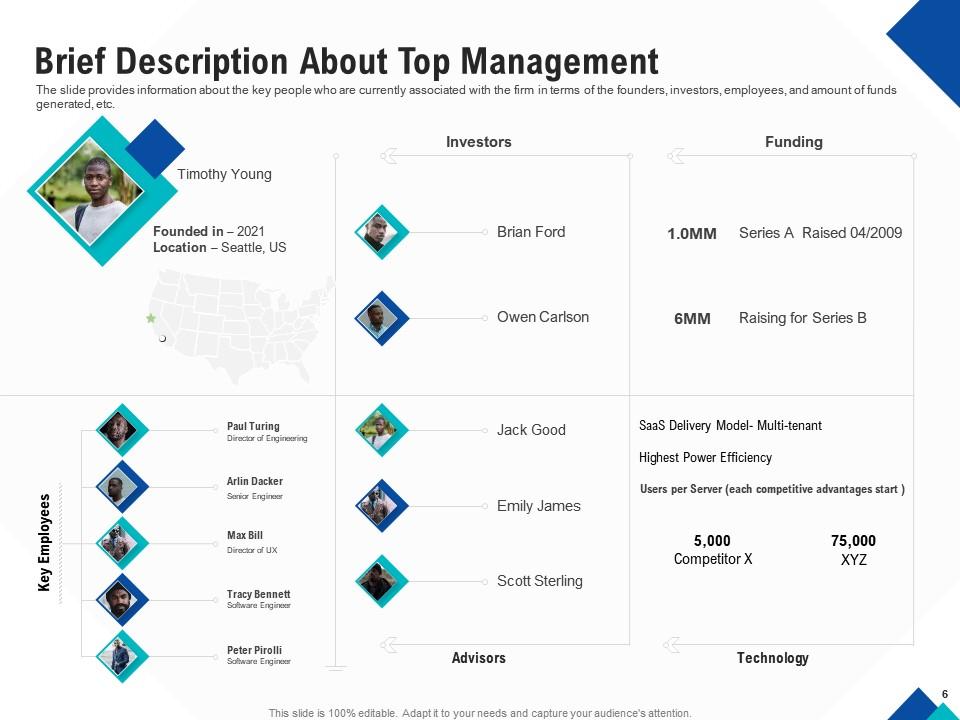
Slide 6: The slide provides information about the key people who are currently associated with the firm in terms of the founders, investors, employees, and amount of funds generated, etc.
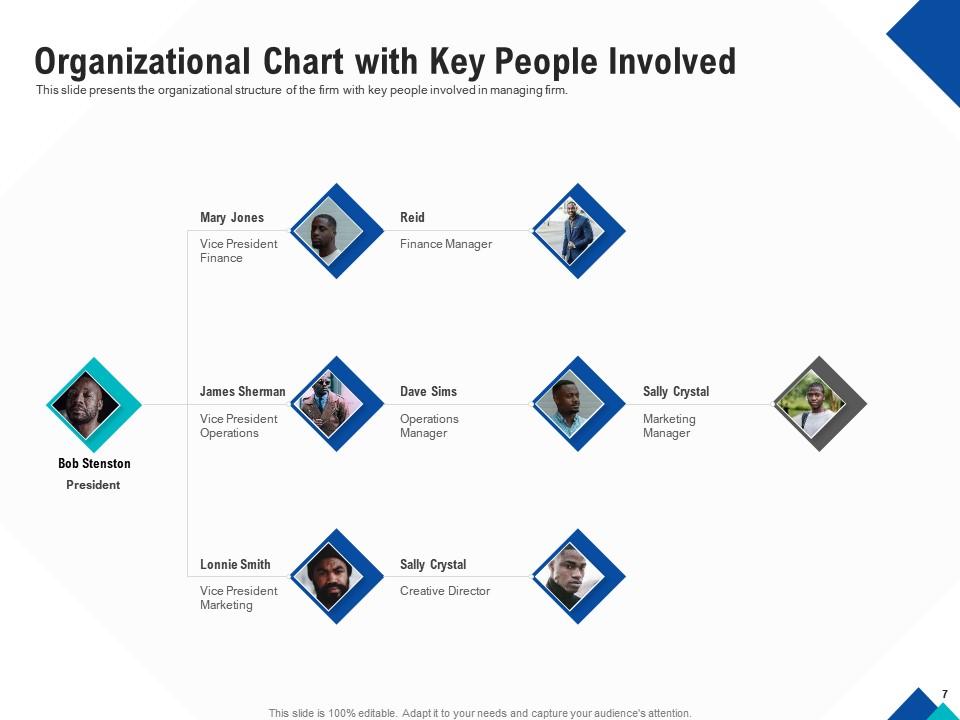
Slide 7: This slide presents the organizational structure of the firm with key people involved in managing firm.
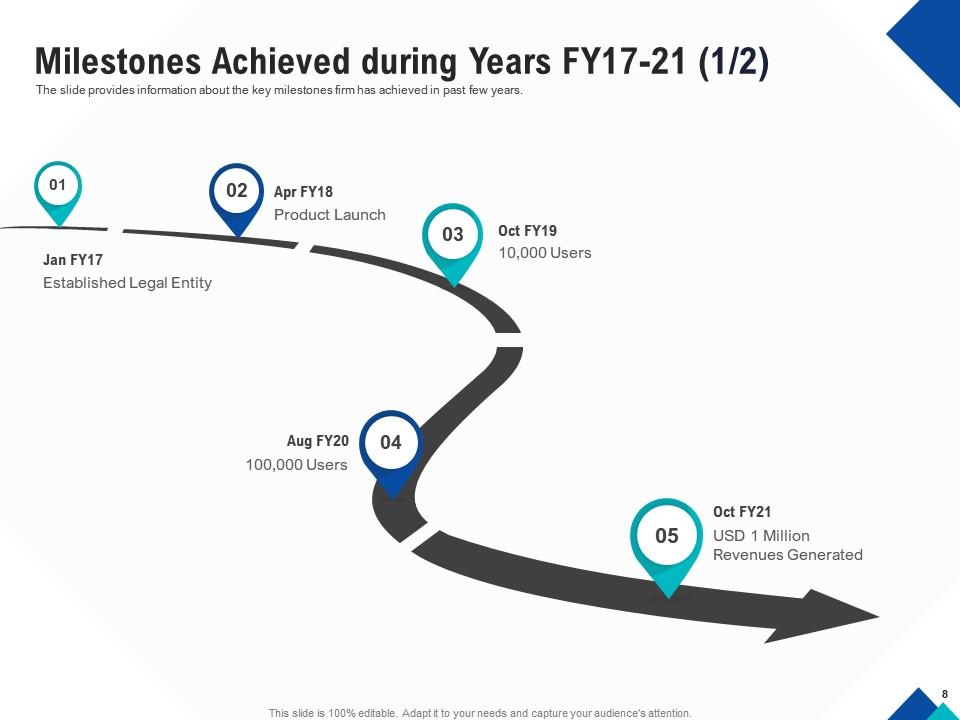
Slide 8: The slide provides information about the key milestones firm has achieved in past few years.
Slide 9: The slide provides information about the key milestones firm has achieved in past few years.
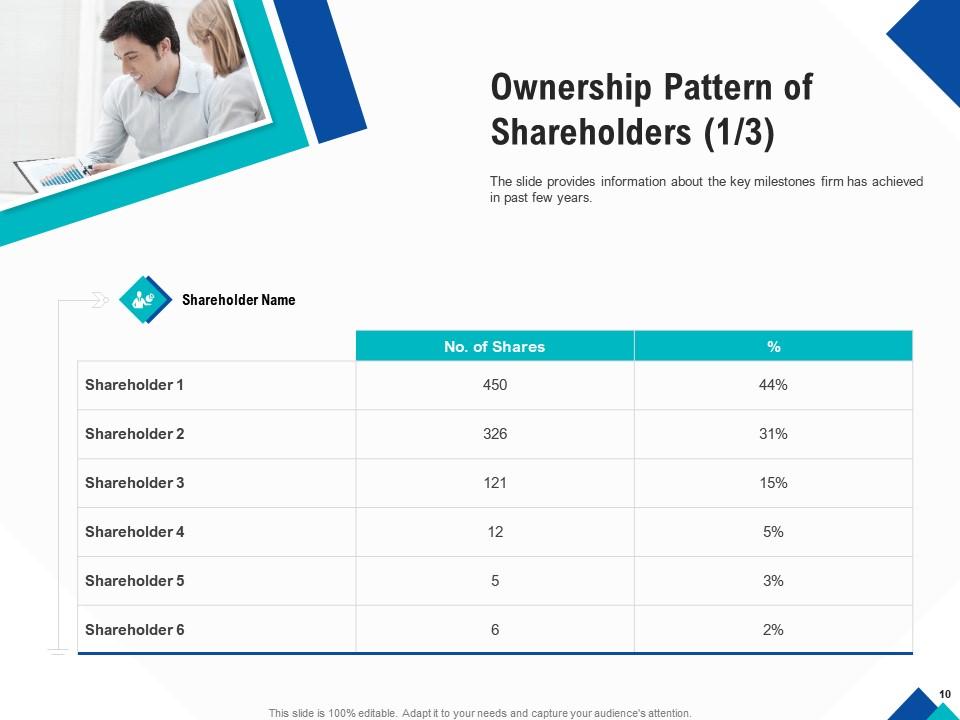
Slide 10: The slide provides information about the key milestones firm has achieved in past few years.
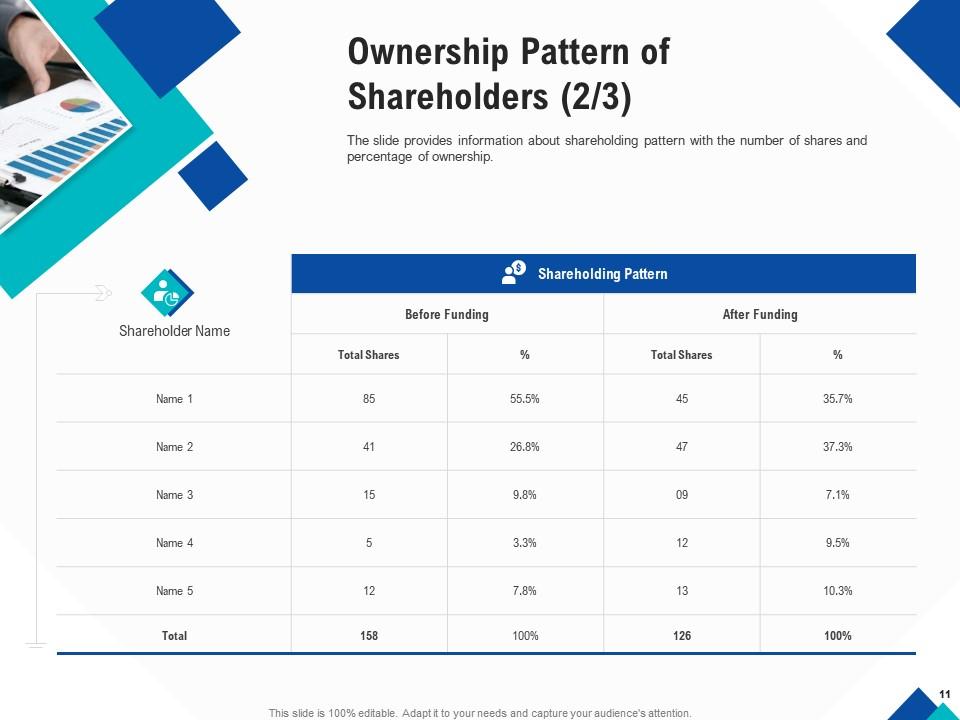
Slide 11: The slide provides information about shareholding pattern with the number of shares and percentage of ownership.
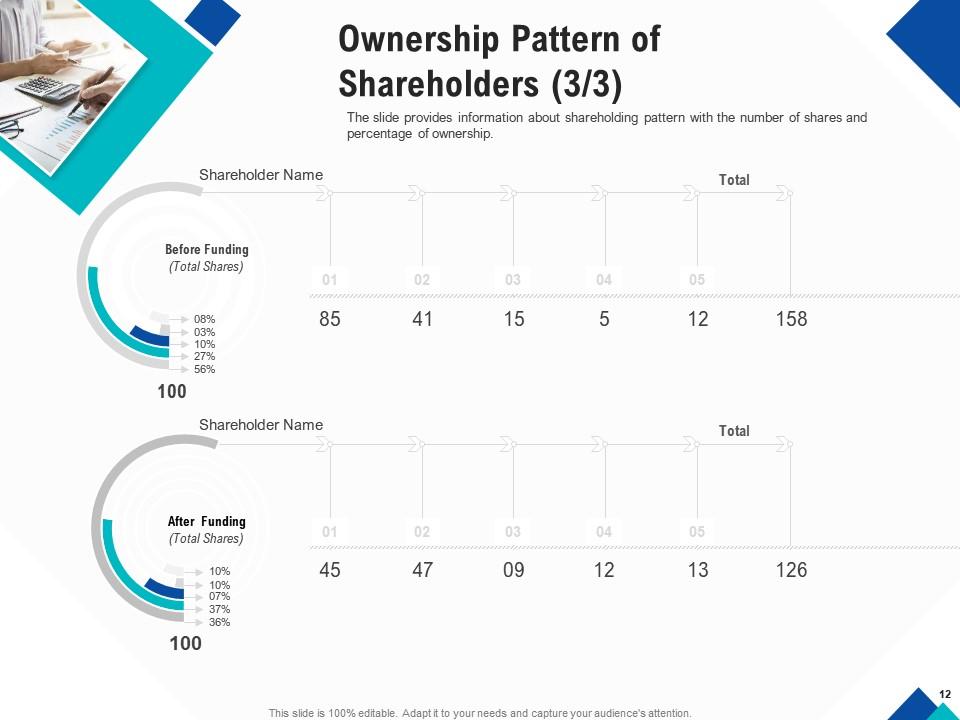
Slide 12: The slide provides information about shareholding pattern with the number of shares and percentage of ownership.
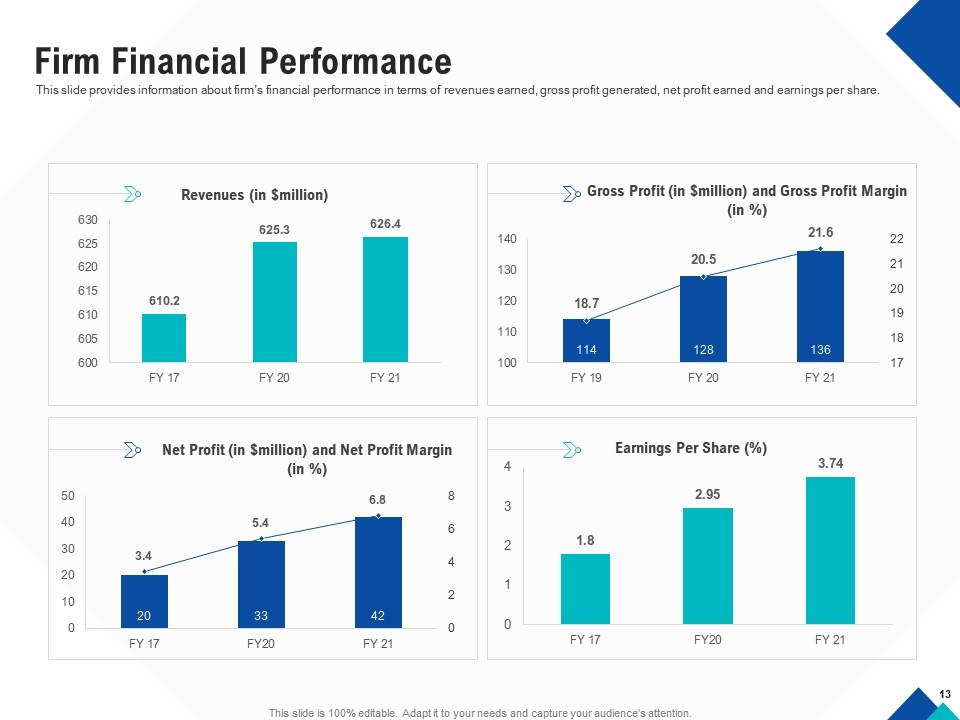
Slide 13: This slide provides information about firm’s financial performance in terms of revenues earned, gross profit generated, net profit earned and earnings per share.
Slide 14:
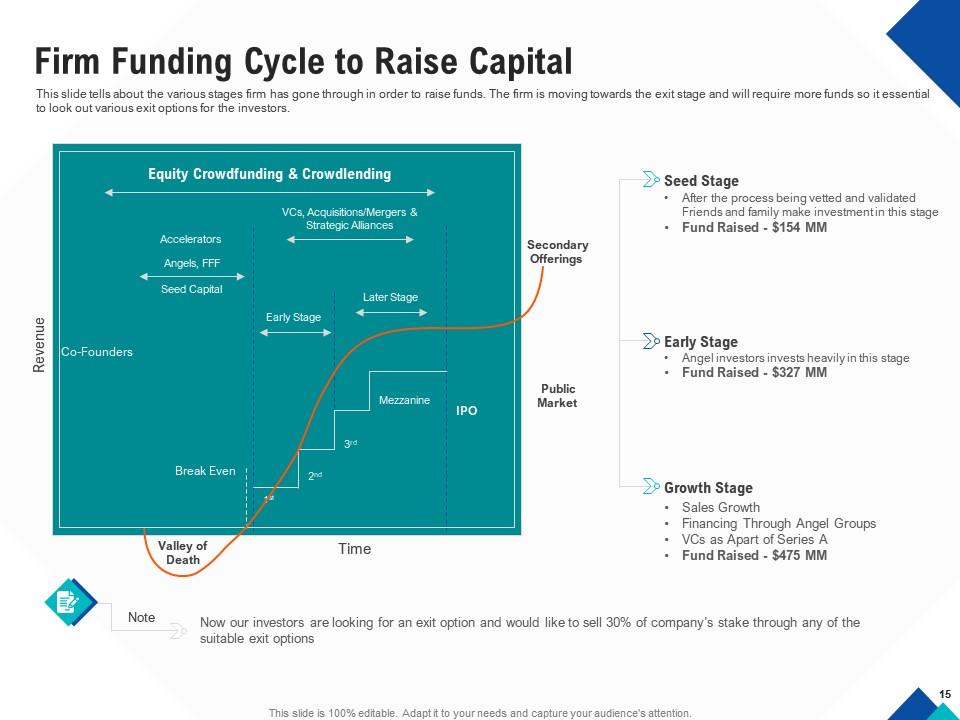
Slide 15: This slide tells about the various stages firm has gone through in order to raise funds. The firm is moving towards the exit stage and will require more funds so it essential to look out various exit options for the investors.
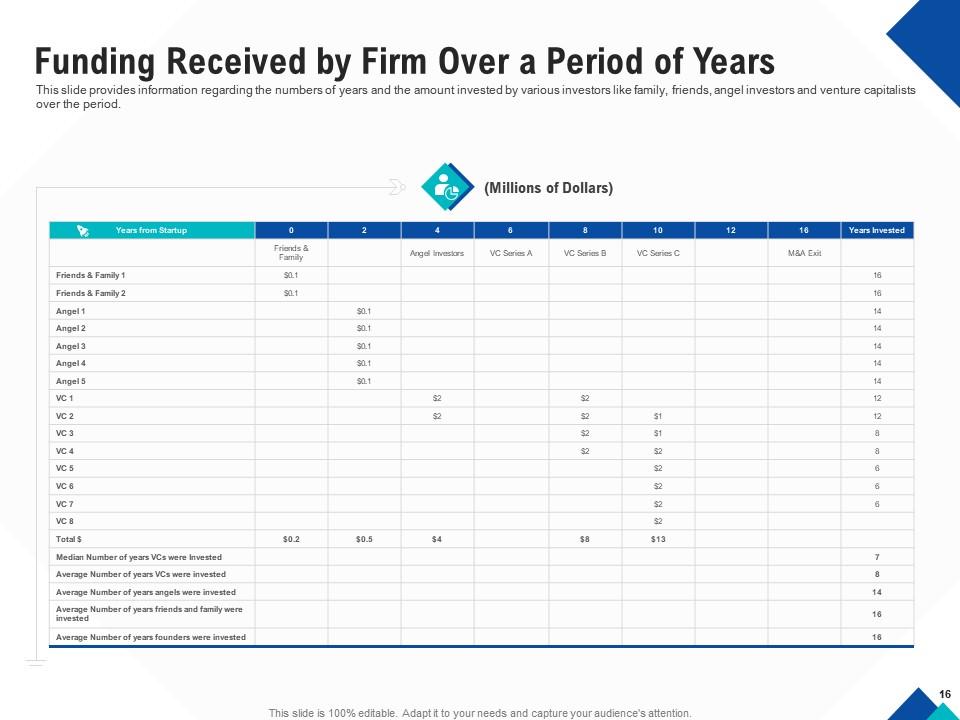
Slide 16: This slide provides information regarding the numbers of years and the amount invested by various investors like family, friends, angel investors and venture capitalists over the period.
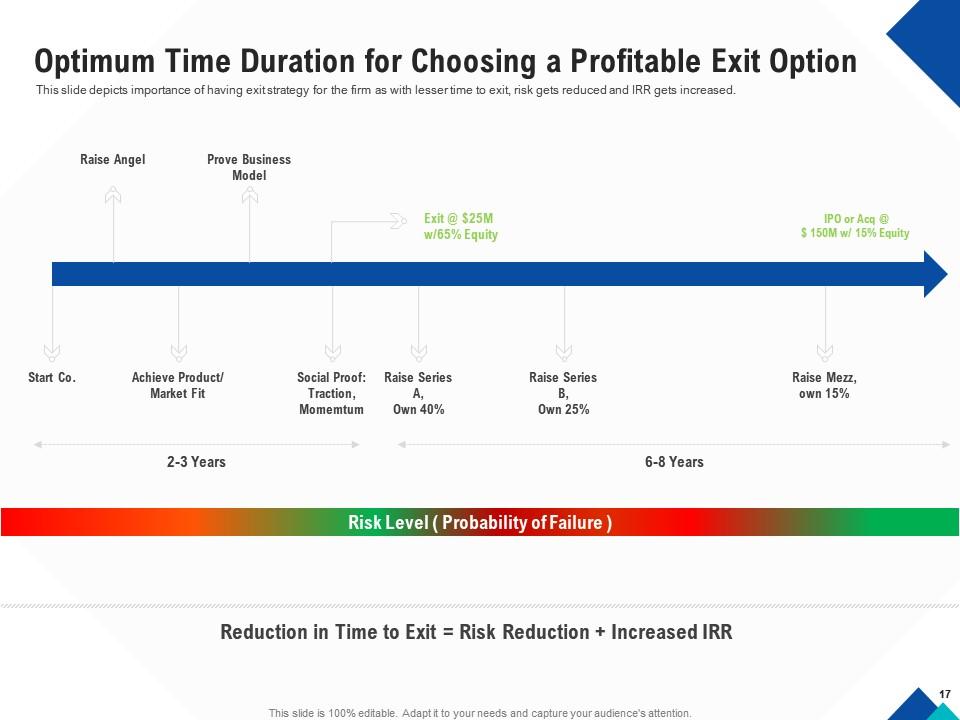
Slide 17: This slide depicts importance of having exit strategy for the firm as with lesser time to exit, risk gets reduced and IRR gets increased.
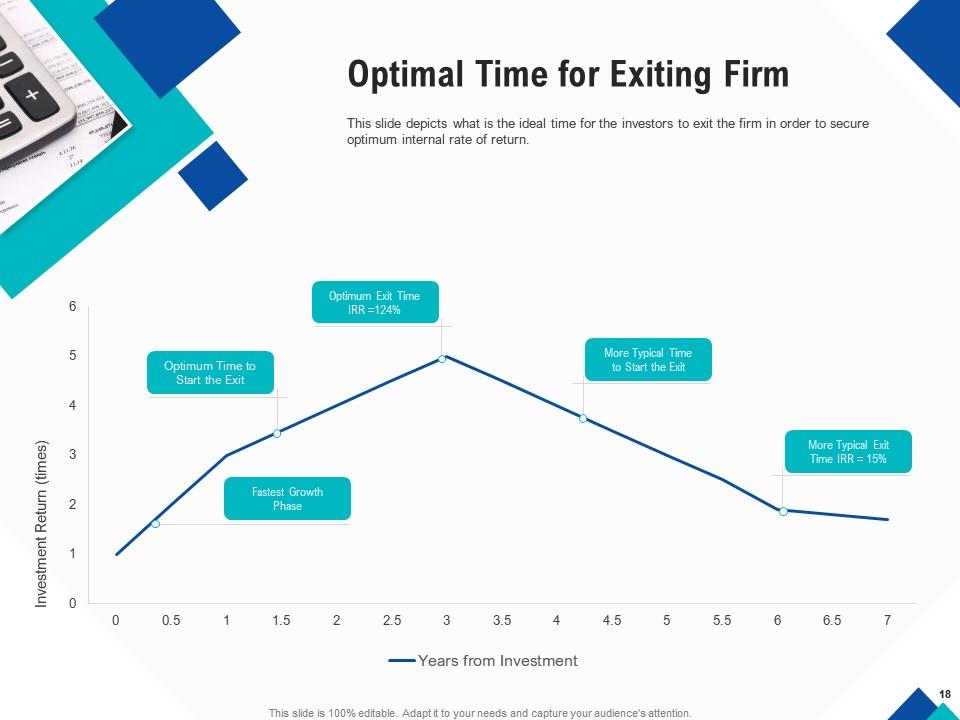
Slide 18: This slide depicts what is the ideal time for the investors to exit the firm in order to secure optimum internal rate of return.
Slide 19:
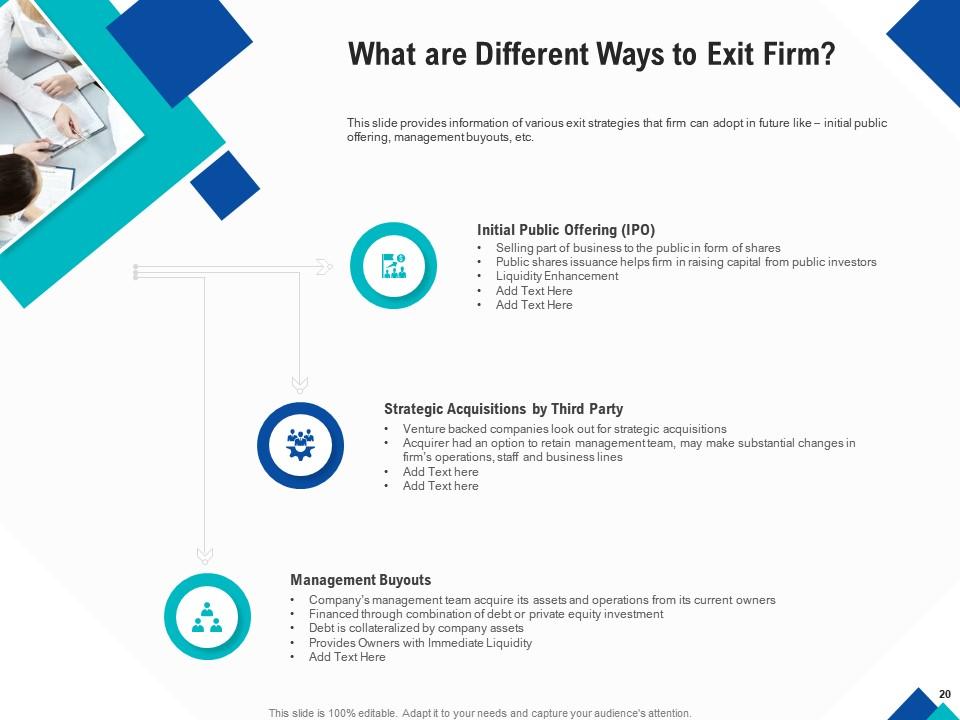
Slide 20: This slide provides information of various exit strategies that firm can adopt in future like – initial public offering, management buyouts, etc.
Slide 21:
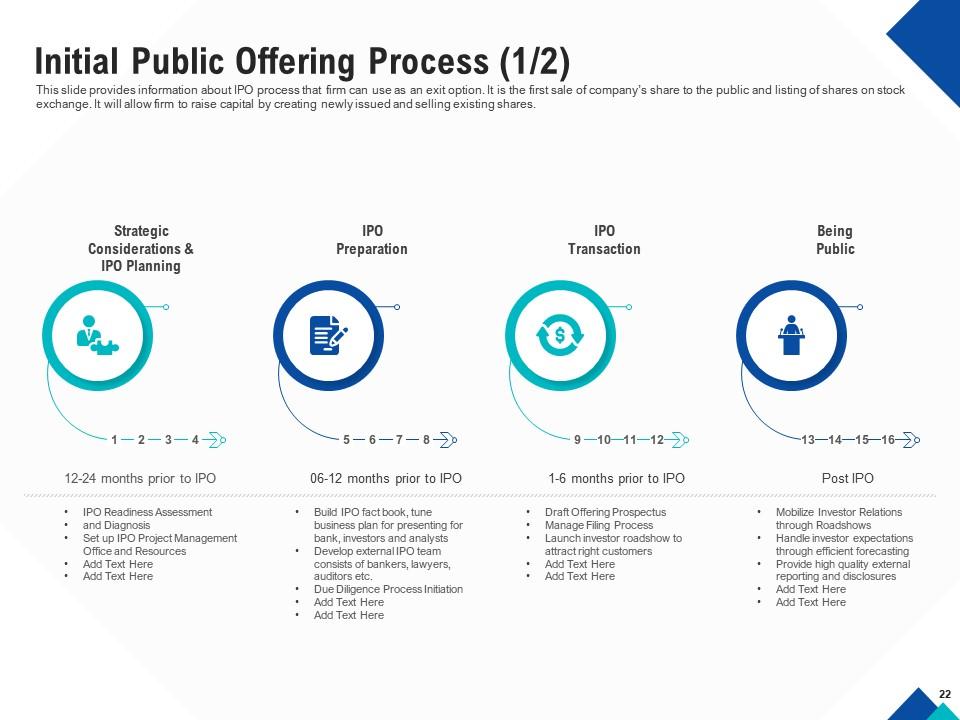
Slide 22: This slide provides information about IPO process that firm can use as an exit option. It is the first sale of company’s share to the public and listing of shares on stock exchange. It will allow firm to raise capital by creating newly issued and selling existing shares.
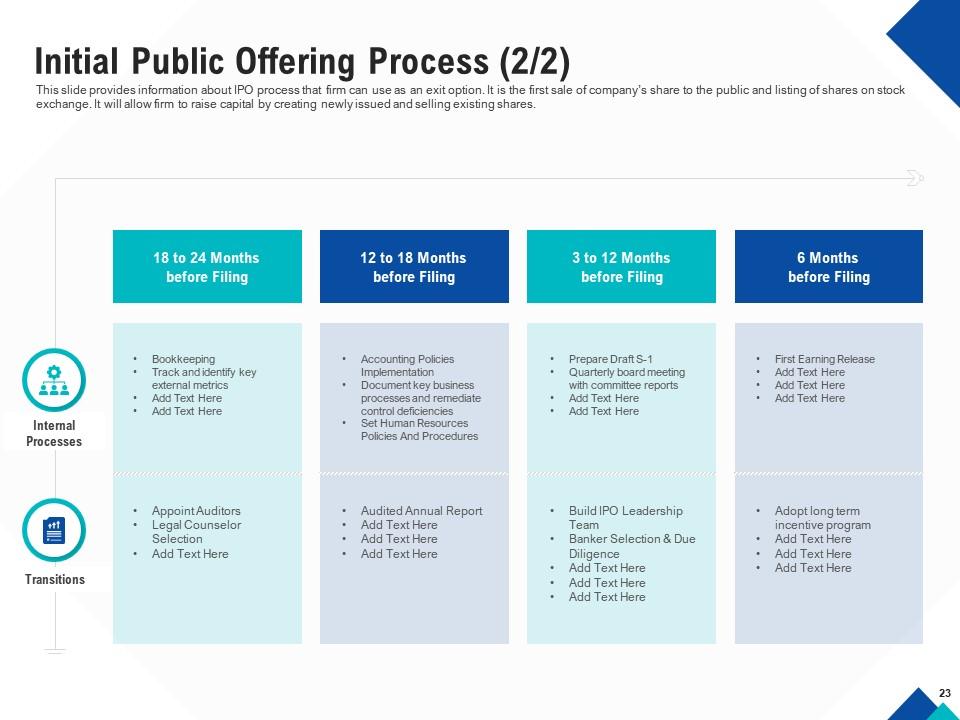
Slide 23: This slide provides information about IPO process that firm can use as an exit option. It is the first sale of company’s share to the public and listing of shares on stock exchange. It will allow firm to raise capital by creating newly issued and selling existing shares. 23
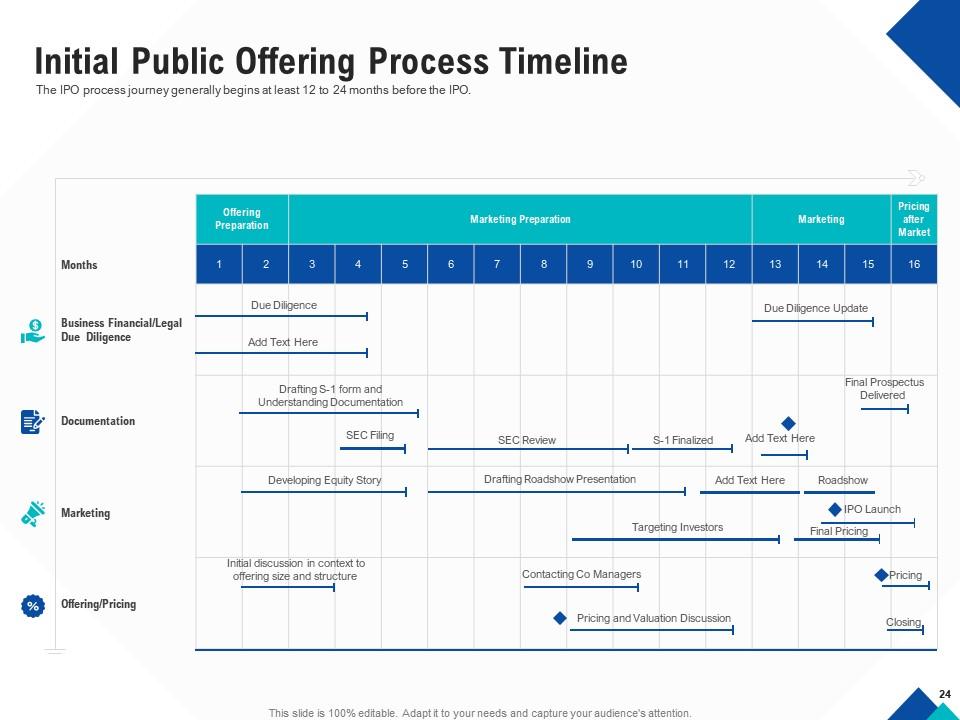
Slide 24: The IPO process journey generally begins at least 12 to 24 months before the IPO.
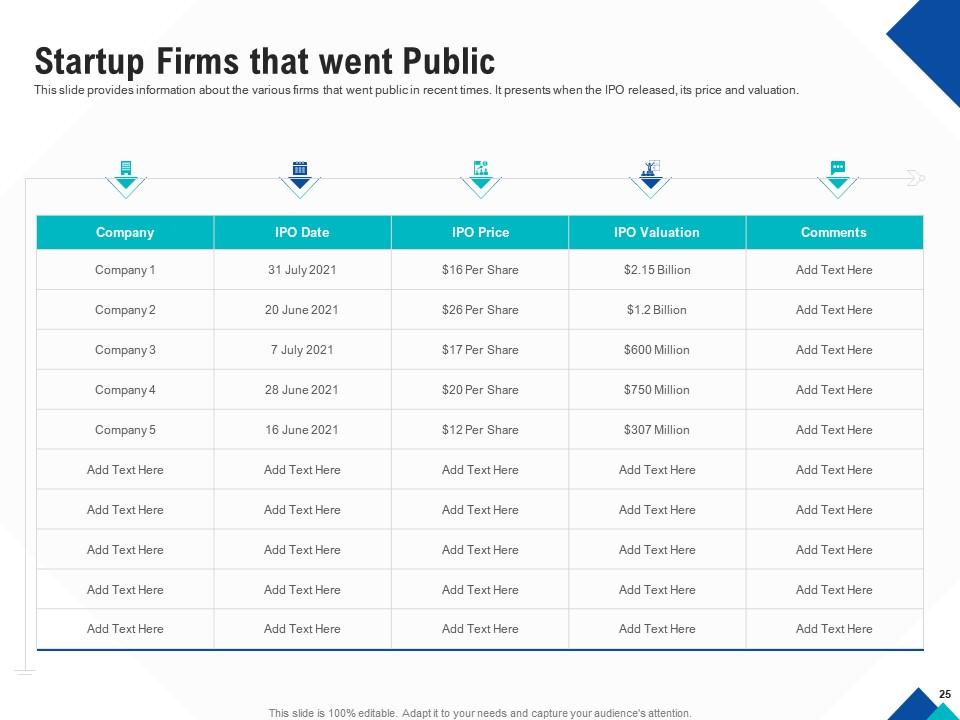
Slide 25: This slide provides information about the various firms that went public in recent times. It presents when the IPO released, its price and valuation.
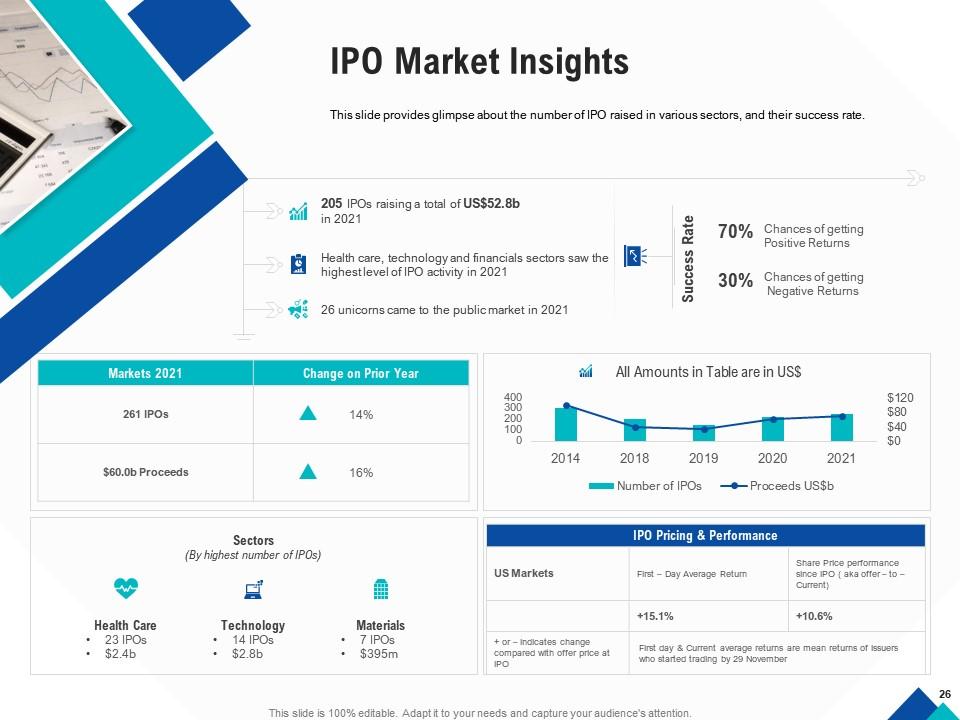
Slide 26: This slide provides glimpse about the number of IPO raised in various sectors, and their success rate.
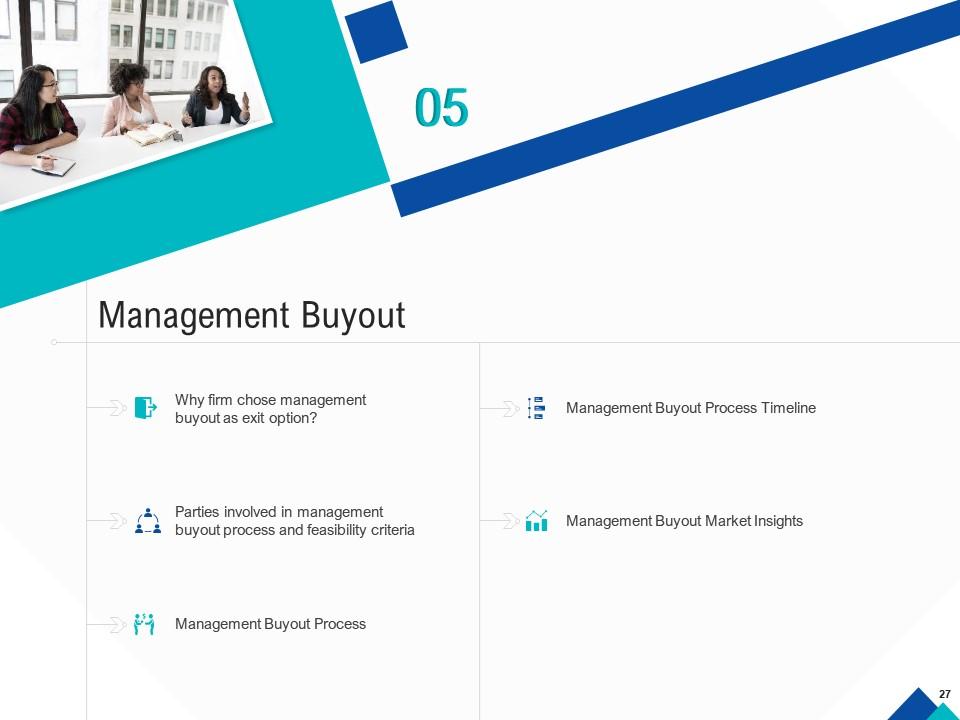
Slide 27:
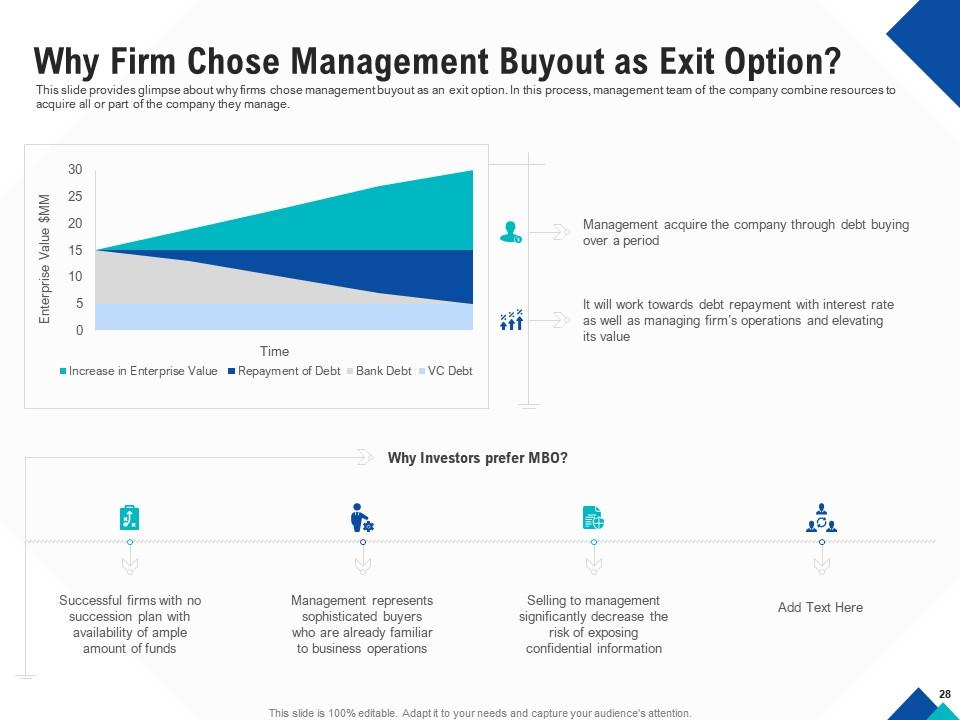
Slide 28: This slide provides glimpse about why firms chose management buyout as an exit option. In this process, management team of the company combine resources to acquire all or part of the company they manage.
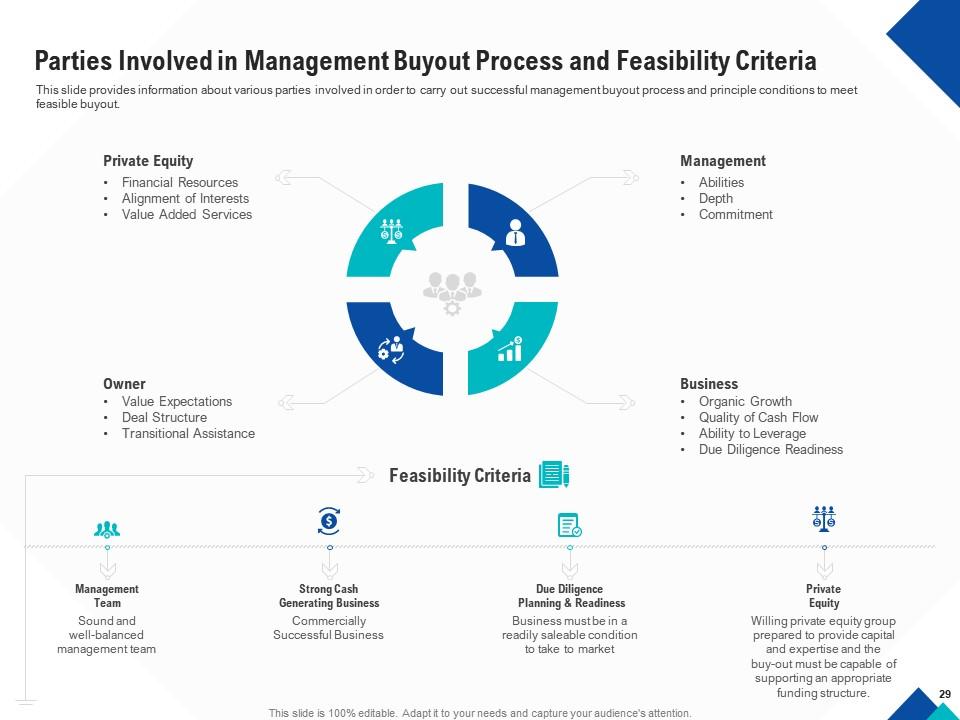
Slide 29: This slide provides information about various parties involved in order to carry out successful management buyout process and principle conditions to meet feasible buyout.
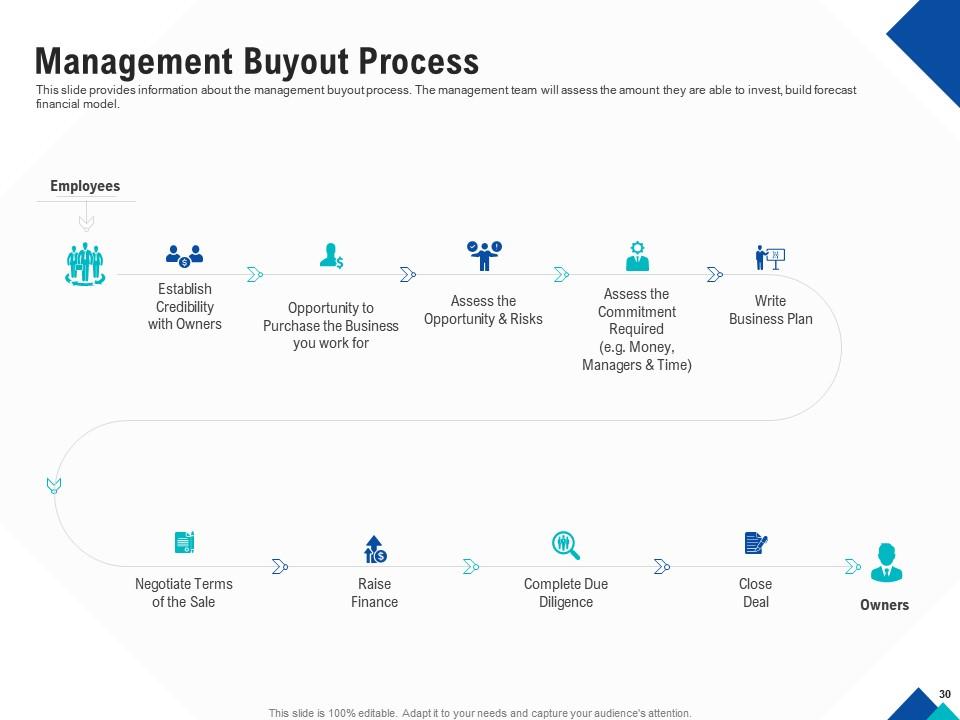
Slide 30: This slide provides information about the management buyout process. The management team will assess the amount they are able to invest, build forecast financial model.
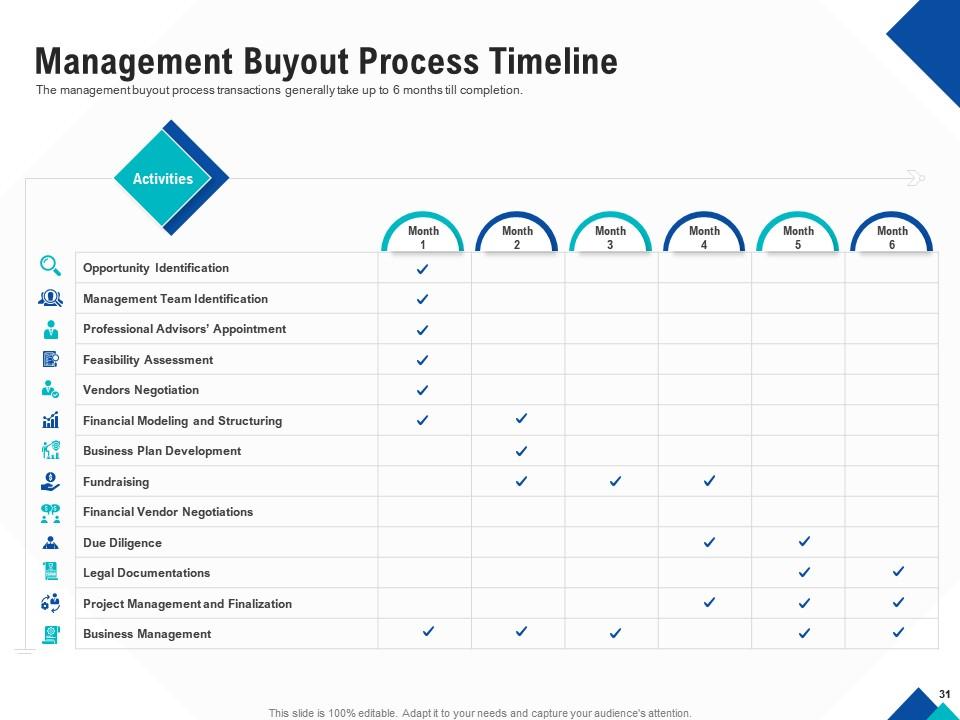
Slide 31: The management buyout process transactions generally take up to 6 months till completion.
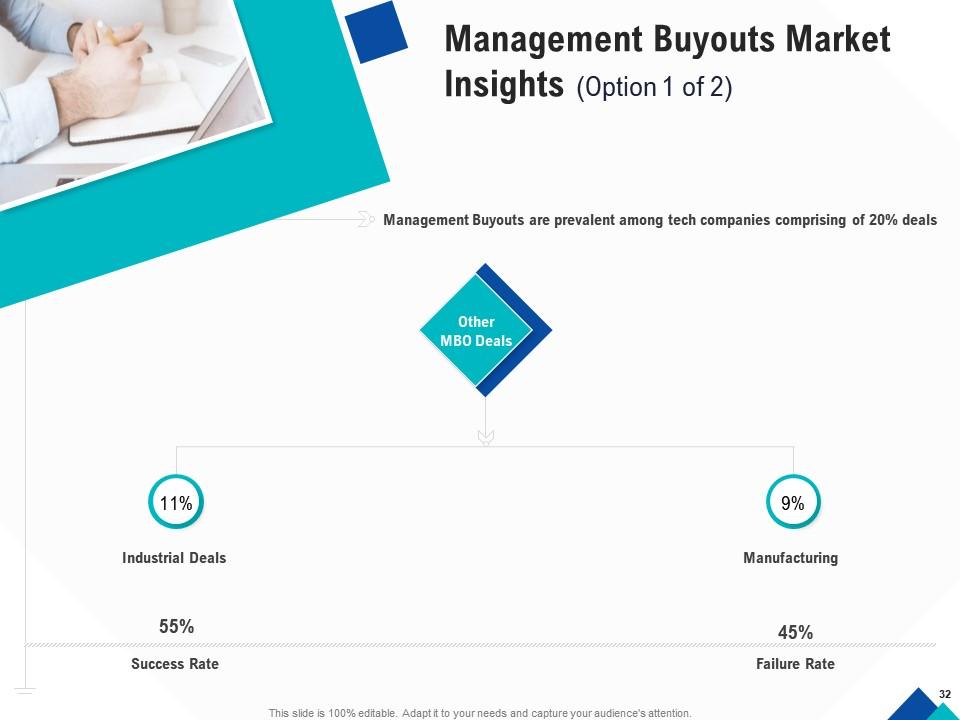
Slide 32:
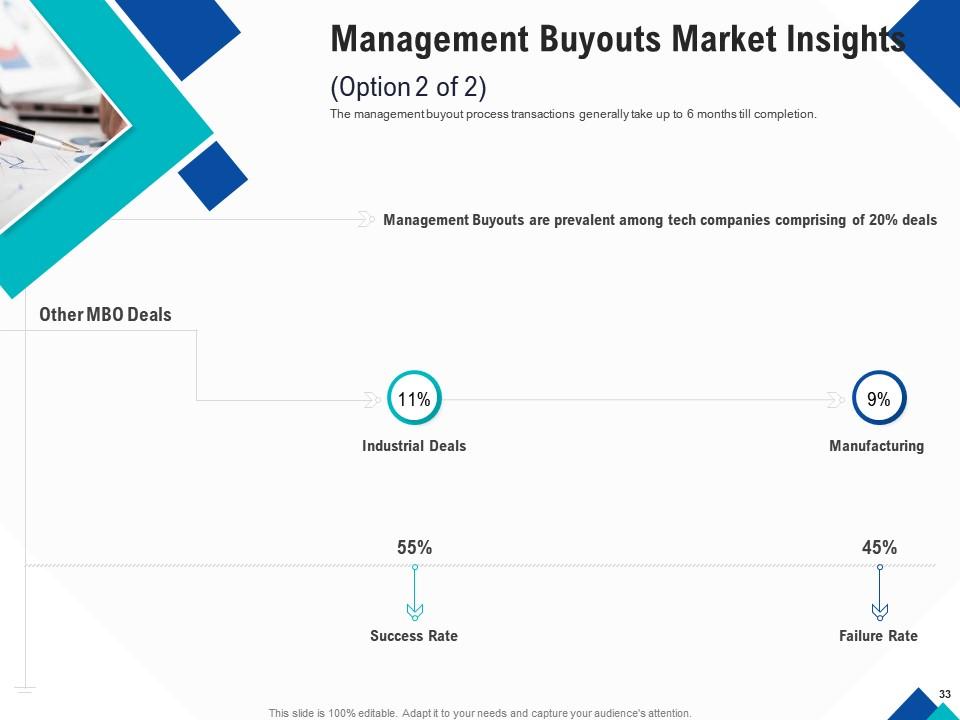
Slide 33: The management buyout process transactions generally take up to 6 months till completion.
Slide 34:
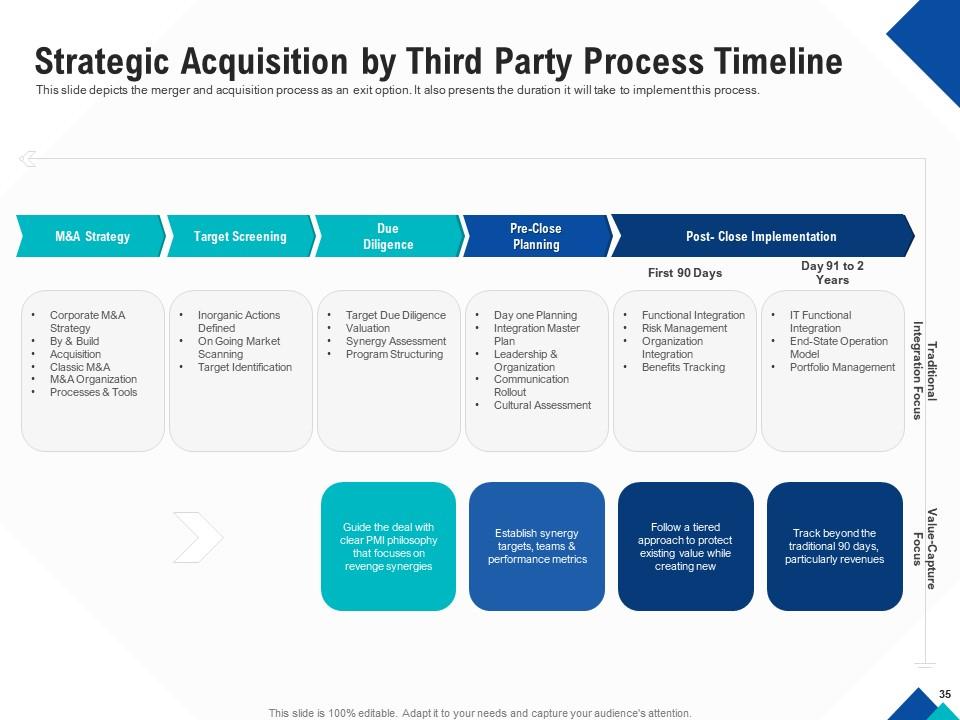
Slide 35: This slide depicts the merger and acquisition process as an exit option. It also presents the duration it will take to implement this process.
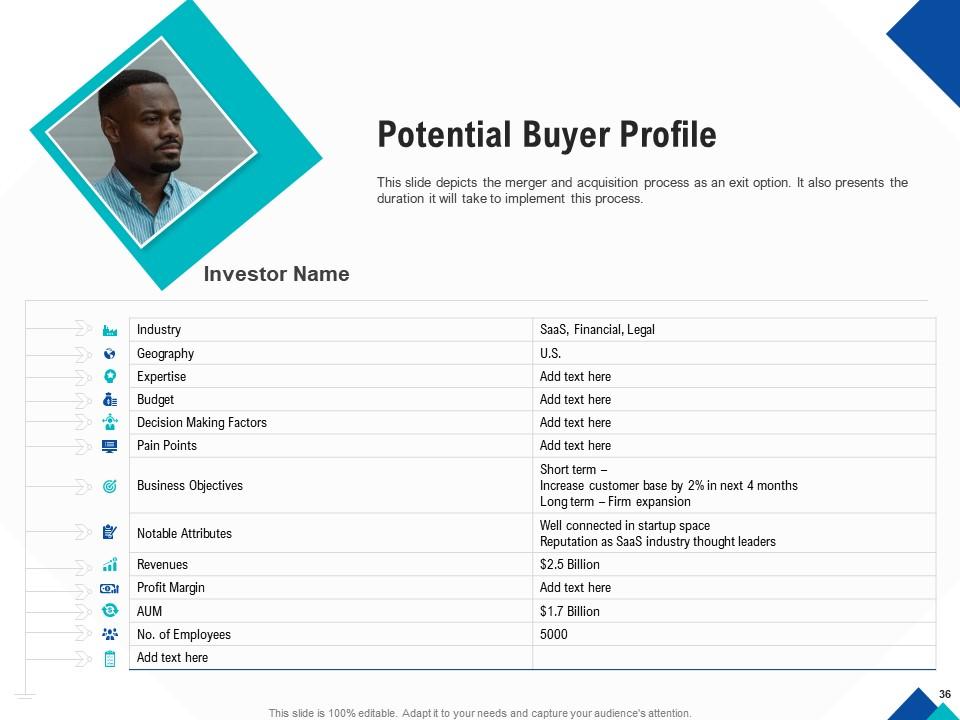
Slide 36: This slide depicts the merger and acquisition process as an exit option. It also presents the duration it will take to implement this process.
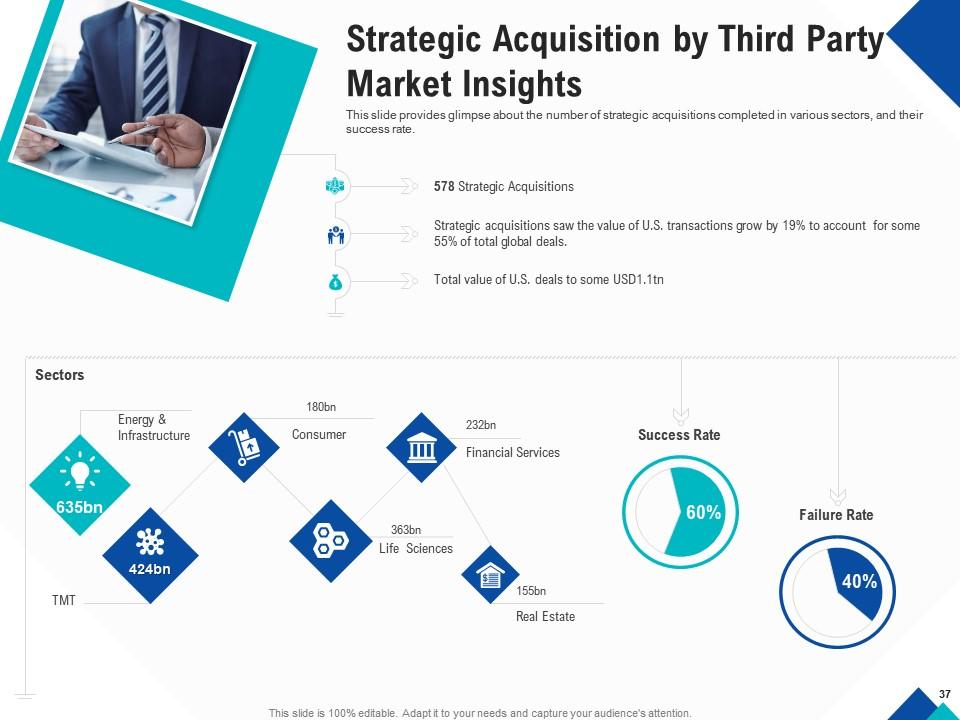
Slide 37: This slide provides glimpse about the number of strategic acquisitions completed in various sectors, and their success rate.
Slide 38: Comparative Analysis Between Exit Options
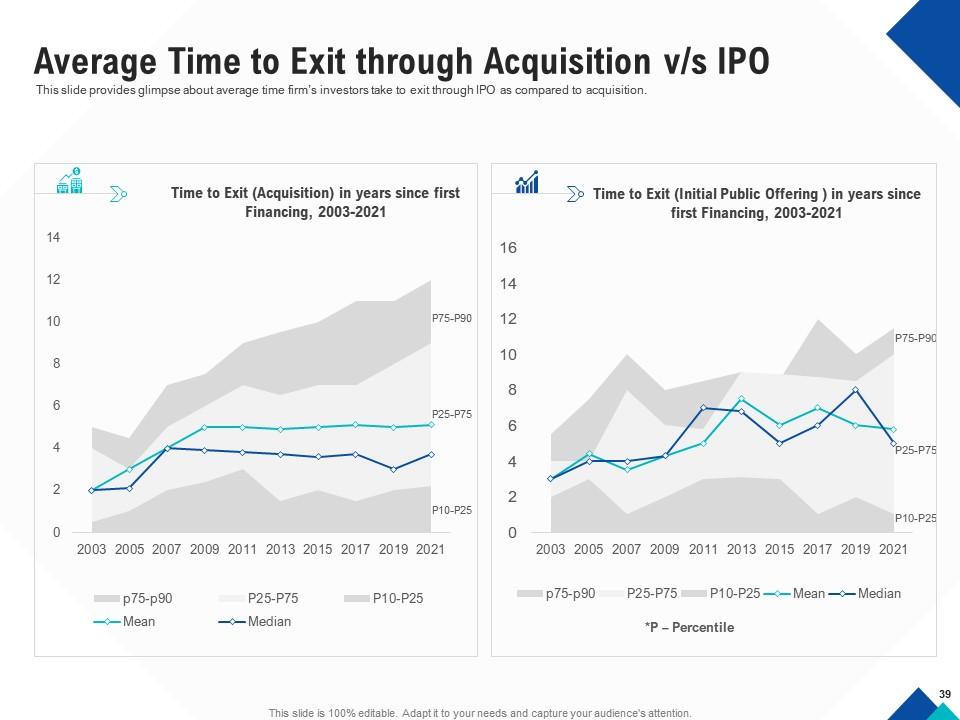
Slide 39: This slide provides glimpse about average time firm’s investors take to exit through IPO as compared to acquisition.
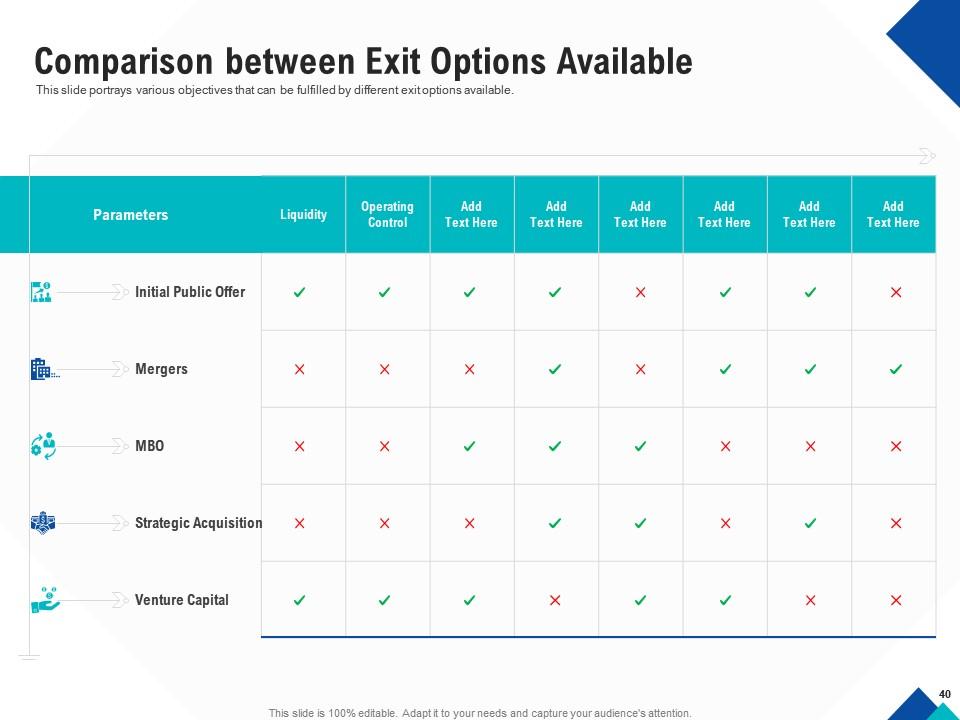
Slide 40: This slide portrays various objectives that can be fulfilled by different exit options available.
Slide 41: Valuation
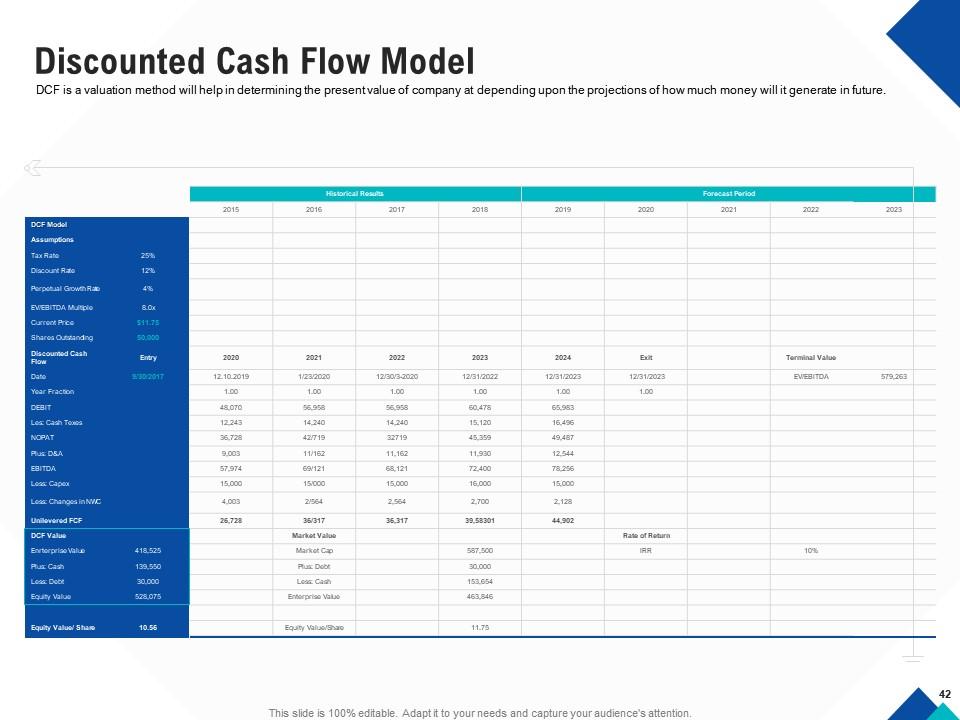
Slide 42: DCF is a valuation method will help in determining the present value of company at depending upon the projections of how much money will it generate in future.
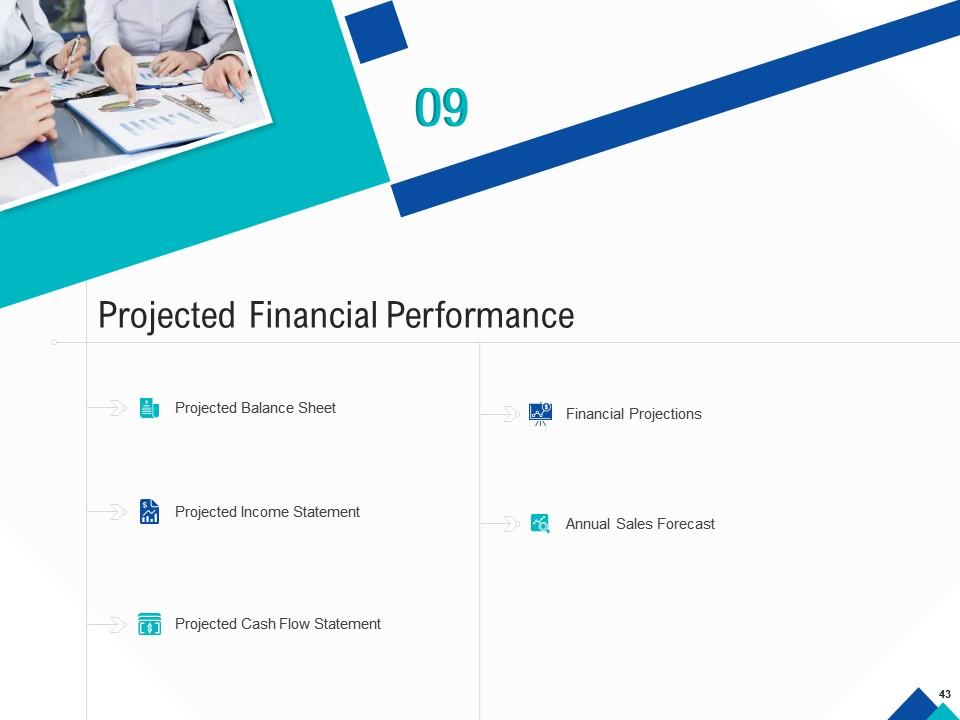
Slide 43: Projected Financial Performance
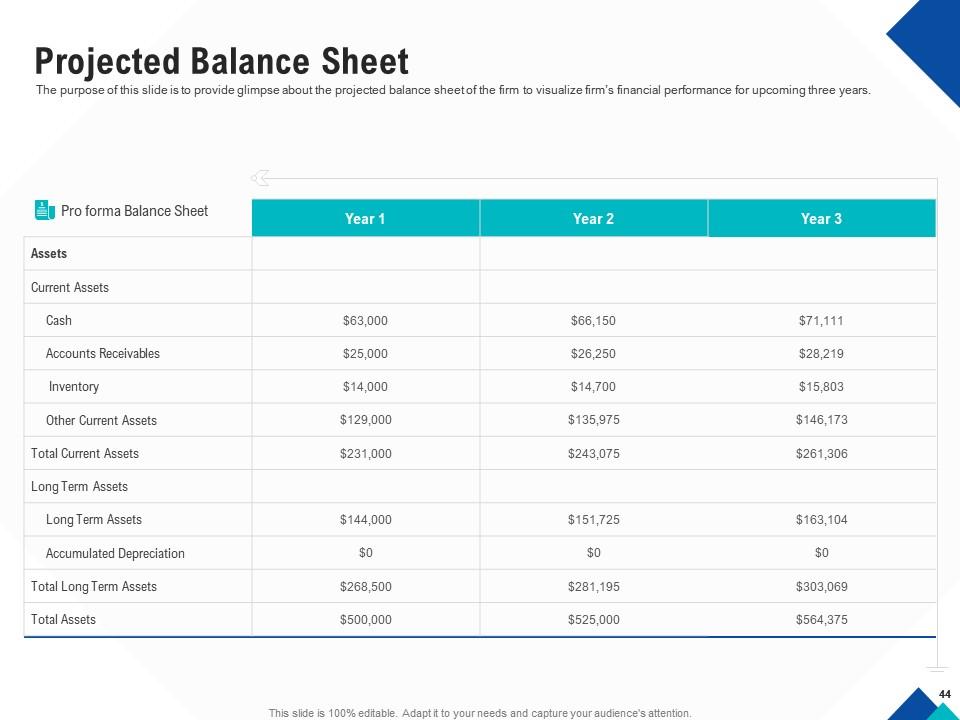
Slide 44: The purpose of this slide is to provide glimpse about the projected balance sheet of the firm to visualize firm’s financial performance for upcoming three years.
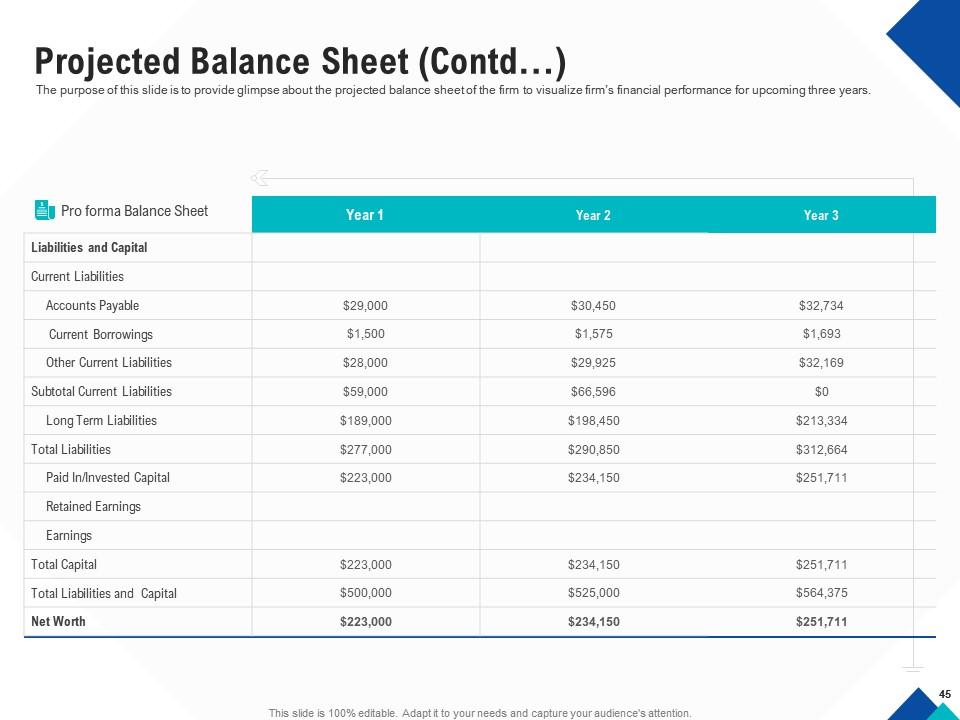
Slide 45: The purpose of this slide is to provide glimpse about the projected balance sheet of the firm to visualize firm’s financial performance for upcoming three years.
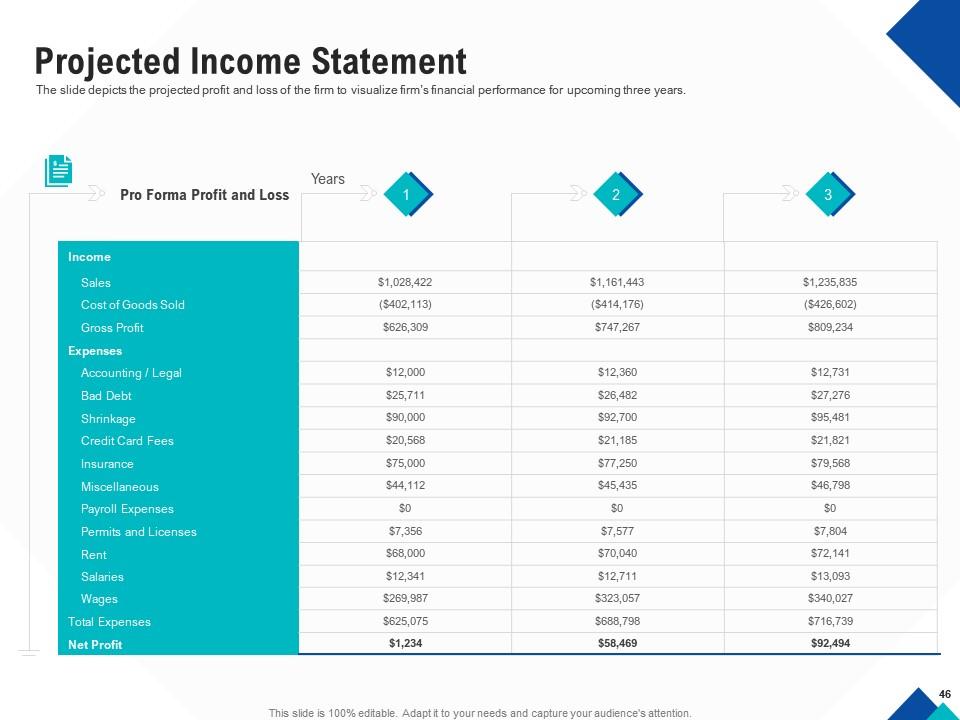
Slide 46: The slide depicts the projected profit and loss of the firm to visualize firm’s financial performance for upcoming three years.
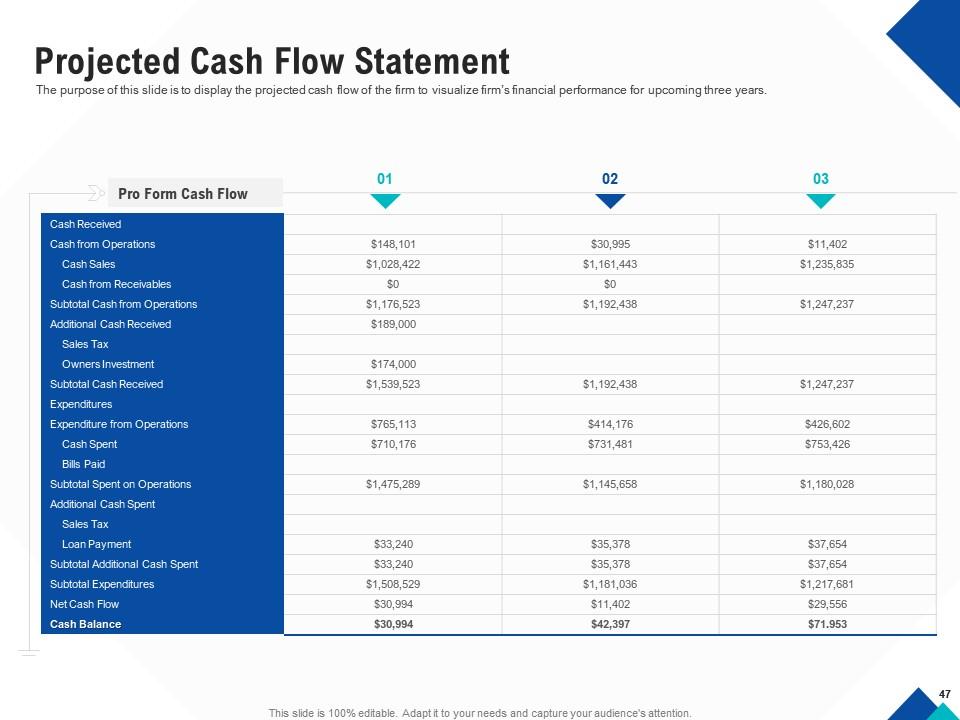
Slide 47: The purpose of this slide is to display the projected cash flow of the firm to visualize firm’s financial performance for upcoming three years.
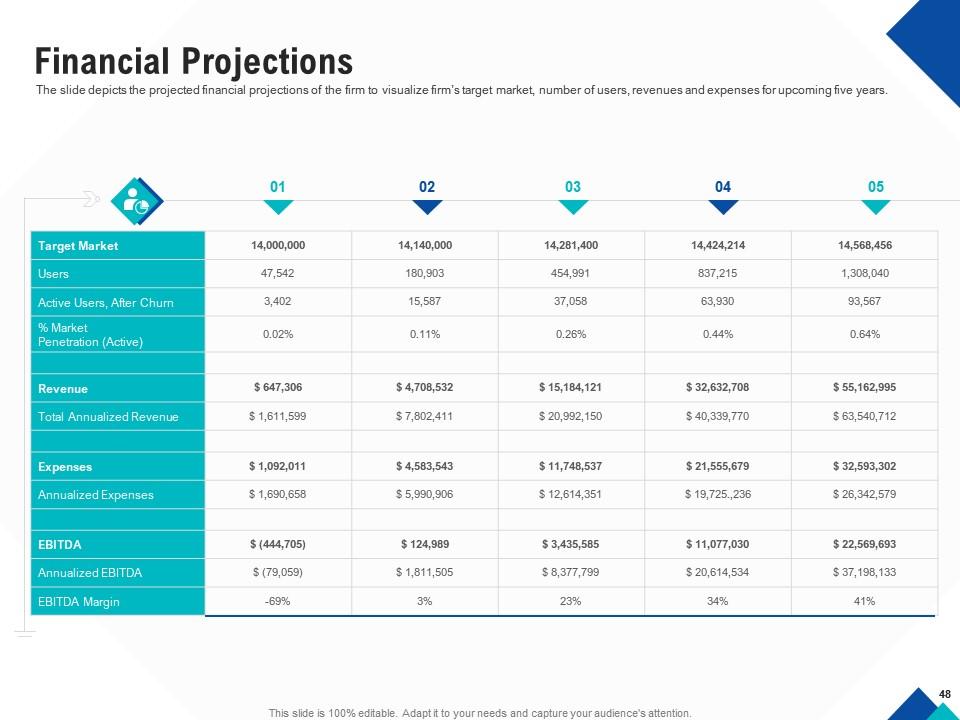
Slide 48: The slide depicts the projected financial projections of the firm to visualize firm’s target market, number of users, revenues and expenses for upcoming five years.
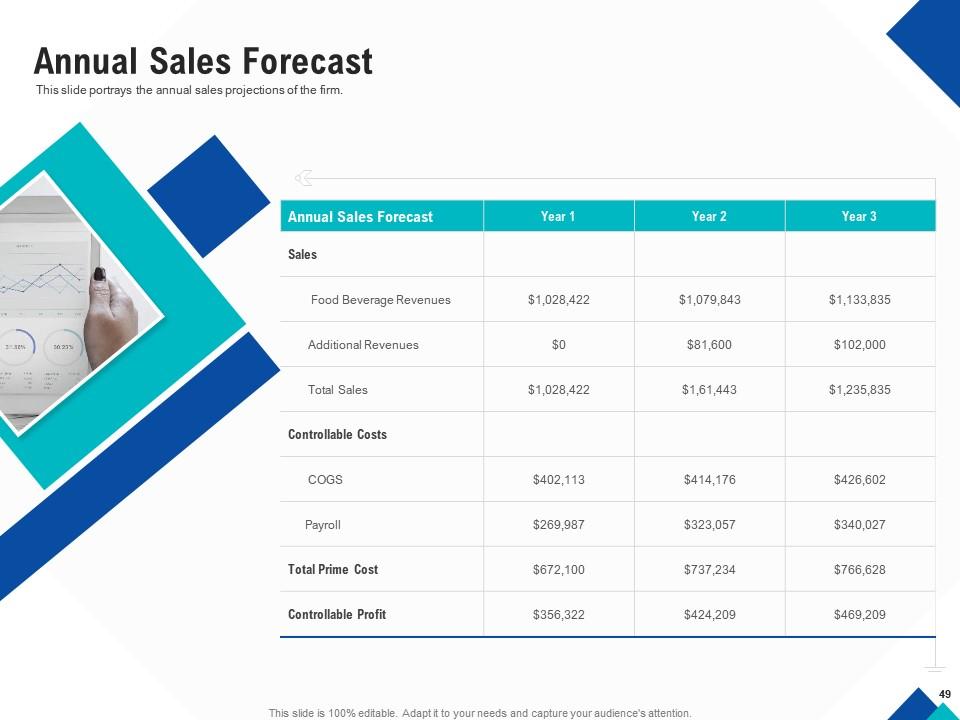
Slide 49: This slide portrays the annual sales projections of the firm.
Slide 50: 50 Optimizing Endgame Icons Slide
Slide 51: Additional Slides
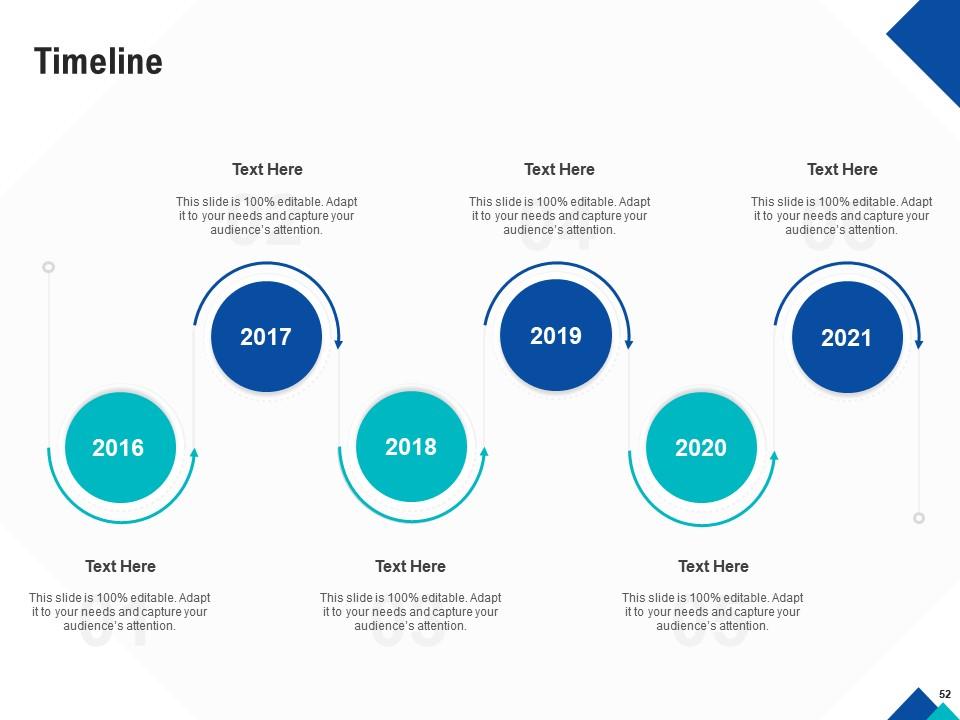
Slide 52: Timeline
Slide 53: Post it Notes
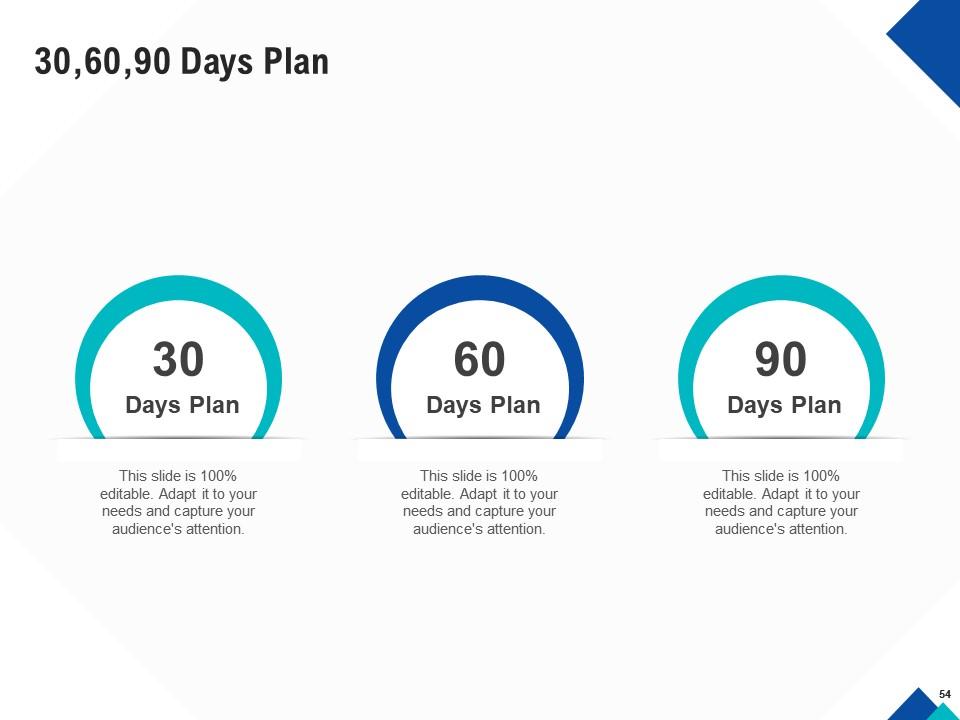
Slide 54: 30,60,90 Days Plan
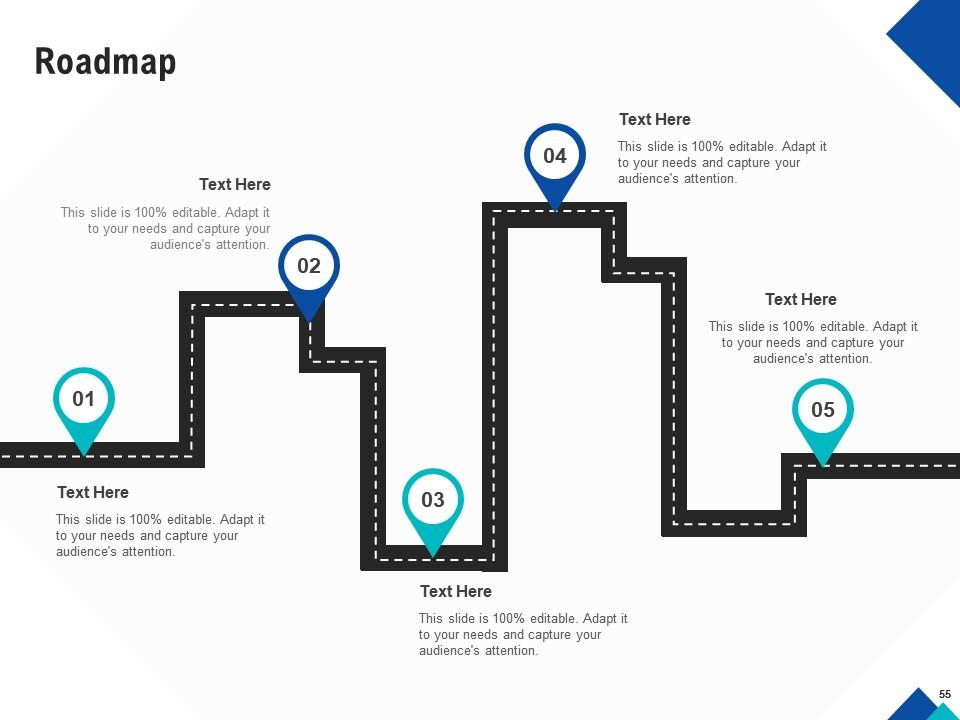
Slide 55: Roadmap
Slide 56: Thank You.
Optimizing endgame powerpoint presentation slides with all 56 slides:
Use our Optimizing Endgame Powerpoint Presentation Slides to effectively help you save your valuable time. They are readymade to fit into any presentation structure.
-
Easy to edit slides with easy to understand instructions.
-
Editable templates with innovative design and color combination.
-
Unique research projects to present in meeting.
-
Attractive design and informative presentation.
-
Awesome use of colors and designs in product templates.
-
Use of different colors is good. It's simple and attractive.
-
Amazing product with appealing content and design.
-
Out of the box and creative design.
-
Use of different colors is good. It's simple and attractive.
-
Best way of representation of the topic.


