Organizations software development processes powerpoint presentation slides
Cleanse your organization’s software development process using Organization Software Development Processes PowerPoint Presentation Slides. Intensify the maturity of software products using content-ready system development methodologies PPT templates. Analyze approach and techniques because of which organizations develop any software product. Consider these professionally designed ready-to-use PPT slides like capability maturity matrix framework, initial maturity level, managed maturity level, optimizing maturity level, and more to optimize the process of developing and acquiring software reliant systems. Not just this, this organization software development process PowerPoint slideshow consists of templates like mapping KPA’s, timelines for implementing cmm, internal structure of cmm, etc. This complete presentation is a structure collection of templates that will help you refine your organization’s software processes. Assess the maturity of the company based on the projects the company is dealing with using software engineering methodologies presentation templates. Download this business capability maturity model PowerPoint slides to evaluate the maturity of an organization’s software process. Add a bit of jazz with our Organizations Software Development Processes Powerpoint Presentation Slides. Increase the degree of elation felt.
You must be logged in to download this presentation.
PowerPoint presentation slides
Presenting organization’s software development processes presentation slides. This deck comprises of total of 38 professionally PPT slides. Each template consists of professional visuals with an appropriate content. These slides have been designed keeping the requirements of the customers in mind. This complete deck presentation covers all the design elements such as layout, diagrams, icons, and more. This PPT presentation has been crafted after a thorough research. You can easily edit each template. Edit the color, text, icon, and font size as per your requirement. Easy to download. Compatible with all screen types and monitors. Supports Google Slides.
People who downloaded this PowerPoint presentation also viewed the following :
Content of this Powerpoint Presentation
Slide 1: This is an introductory slide to Organizations Software Development Processes. Add your company name and get started.
Slide 2: This slide shows Capability Maturity Matrix Outline with the following constituents to present- CMM Summary, Capability Maturity Matrix, Purpose of using CMM, Characteristics of CMM, Capability Maturity Matrix Framework, Initial Maturity Level, Managed Maturity Level, Defined Maturity Level, Quantitatively Managed Maturity Level, Optimizing Maturity Level, Timelines for implementing, Capability Maturity Matrix, Internal Structure of Capability, Maturity Matrix, Basis of Mapping KPAs, Limitations of CMM Models, Capability Maturity Matrix Templates.
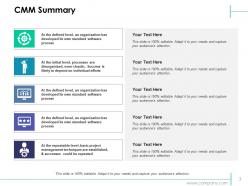
Slide 3: This slide presents CMM Summary with text boxes. State it here and use it accordingly.
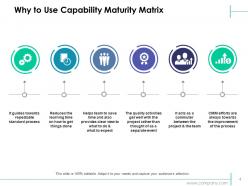
Slide 4: This slide states reasons of Why to Use Capability Maturity Matrix- Reduces the learning time on how to get things done, Helps team to save time and also provides clear view to what to do & what to expect, The quality activities gel well with the project rather than thought of as a separate event, It acts as a commuter between the project & the team, CMM efforts are always towards the improvement of the process, It guides towards repeatable standard process.
Slide 5: This slide shows the Purpose of Using CMM. It also shows A maturity model provides- A framework for prioritizing actions, A way to define what improvement means for your organization, A place to start, The benefit of a community’s prior experiences, A common language and a shared vision.
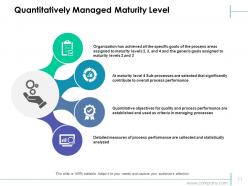
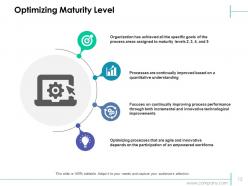
Slide 6: This slide states the Characteristics of CMM with various levels listed as- Level 1 Initial- Processes unpredictable, poorly controlled & reactive, Level 2 Managed- Processes characterized for projects and is often reactive, Level 3 Defined- Processes characterized for the organization & is proactive (Projects tailor their processes from organization’s standards), Level 4 Quantitatively Managed- Processes measured and controlled, Level 5 Optimizing- Focus on process improvement.
Slide 7: This slide showcases Capability Maturity Matrix Framework with icon imagery.
Slide 8: This slide shows Initial Maturity Level with the following points- The organization usually does not provide a stable environment. Success in these organizations depends on the competence & people in the organization, At maturity level 1, processes are usually ad hoc & chaotic, Maturity level 1 organizations often produce products & services that work but company has no standard process for software development.
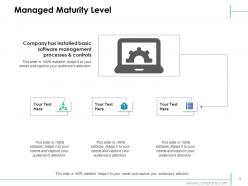
Slide 9: This slide showcases Managed Maturity Level with text boxes.
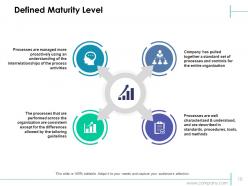
Slide 10: This slide showcases Defined Maturity Level with the following points- Company has pulled together a standard set of processes and controls for the entire organization, Processes are well characterized & understood, and are described in standards, procedures, tools, and methods, The processes that are performed across the organization are consistent except for the differences allowed by the tailoring guidelines, Processes are managed more proactively using an understanding of the interrelationships of the process activities.
Slide 11: This slide showcases Quantitatively Managed Maturity Level with icon imagery.
Slide 12: This is Optimizing Maturity Level slide to state.
Slide 13: This slide showcases Timelines For Implementing Capability Maturity Matrix- For Assessment Preparation, For Each New Level.
Slide 14: This slide showcases Internal Structure of Capability Maturity Matrix. Some Relevant KPAs for CMM level 2 are- REQM Requirement Management, PP Project, Planning, PMC, Project Monitoring & Control, SAM Supplier Agreement Management, PPQA Process & Quality Assurance, CM Configuration Management.
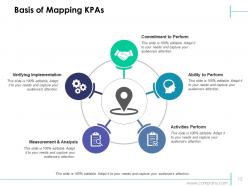
Slide 15: This slide shows Basis of Mapping KPAs with the following points- Commitment to Perform, Ability to Perform, Activities Perform, Measurement & Analysis, Verifying Implementation.
Slide 16: This slide states the Limitations of CMM Models with a 5 step diagram.
Slide 17: This slide shows Capability Maturity Matrix Template 1.
Slide 18: This slide presents Capability Maturity Matrix Template 2 with text boxes.
Slide 19: This slide presents Capability Maturity Matrix Template 3 with the following levels- Managed, Initial, Optimizing, Quantitatively Managed, Defined.
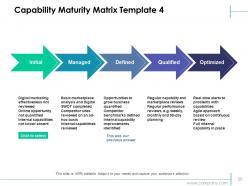
Slide 20: This slide showcases Capability Maturity Matrix Template 4.
Slide 21: This is Capability Maturity Icon Slide. Use icons as per need.
Slide 22: This is a Coffee Break image slide to halt. You can change the slide content as per need.
Slide 23: This slide is titled Additional slides for moving forward. You may change the content as per need.
Slide 24: This is a Clustered Column slide to present product/ entity comparison, specifications etc.
Slide 25: This is a Stacked Column graph slide to show product/ entity comparison, specifications etc.
Slide 26: This is a Clustered Bar graph slide to show product/ entity comparison, specifications etc.
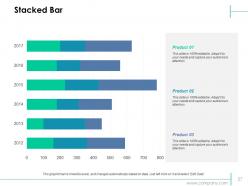
Slide 27: This is a Stacked Bar Chart slide to show product/ entity growth, comparison, specifications etc.
Slide 28: This slide showcases Our Mission. Show your company mission and goals here.
Slide 29: This is Our team slide with names and designation.
Slide 30: This is an About us slide to state company specifications etc.
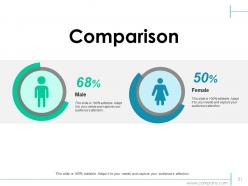
Slide 31: This is a Comparison slide. Use it for comparing male and female ratio.
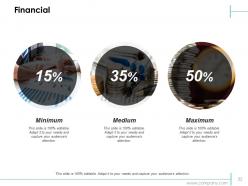
Slide 32: This slide shows Financial Score. State financial aspects here.
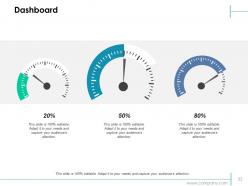
Slide 33: This is a Dashboard slide to show growth factors etc.
Slide 34: This is a Quotes slide. State business message, beliefs etc. here.
Slide 35: This is Location slide on a world map image to show global growth, presence etc.
Slide 36: This is a Timeline image slide to show Starting growth factors, milestones etc.
Slide 37: This is a Timeline image slide to show Ending growth factors, milestones etc.
Slide 38: This is a Thank You image slide with Address, Email and Contact number.
Organizations software development processes powerpoint presentation slides with all 38 slides:
Interact freely with our Organizations Software Development Processes Powerpoint Presentation Slides. Have access to any information desired.
No Reviews


