Business analysis canvas powerpoint presentation slides
Employ our Business Analysis Canvas PowerPoint Presentation Slides and understand the strengths and shortcomings of the business operations. Identify the manufacturing problems faced by the company and prepare a full-fledged presentation on the business overview with help of our company analysis PPT templates. Utilize this cost-benefit surveying PPT slideshow to analyze the revenue split, sales performance, process, and quality management of the products and services of your company to recognize the necessary steps to be taken and the business strategy to be followed for expansion of market share and profitability of the business. It is important to determine the challenges of various elements of the firm by using the KPIs dashboard. Thus, employ our market assessment PPT deck and thoroughly understand the challenges and find the solutions to improve those factors like process management and quality management tools as well as a pricing strategy. Download these completely adaptable economic environment PPT graphics and convey your mission, vision, and objectives by giving it your orientation.
Employ our Business Analysis Canvas PowerPoint Presentation Slides and understand the strengths and shortcomings of the bus..
- Google Slides is a new FREE Presentation software from Google.
- All our content is 100% compatible with Google Slides.
- Just download our designs, and upload them to Google Slides and they will work automatically.
- Amaze your audience with SlideTeam and Google Slides.
-
Want Changes to This PPT Slide? Check out our Presentation Design Services
- WideScreen Aspect ratio is becoming a very popular format. When you download this product, the downloaded ZIP will contain this product in both standard and widescreen format.
-

- Some older products that we have may only be in standard format, but they can easily be converted to widescreen.
- To do this, please open the SlideTeam product in Powerpoint, and go to
- Design ( On the top bar) -> Page Setup -> and select "On-screen Show (16:9)” in the drop down for "Slides Sized for".
- The slide or theme will change to widescreen, and all graphics will adjust automatically. You can similarly convert our content to any other desired screen aspect ratio.
Compatible With Google Slides

Get This In WideScreen
You must be logged in to download this presentation.
PowerPoint presentation slides
Our Business Analysis Canvas Powerpoint Presentation Slides cover all the important concepts and has relevant templates that cater to your business needs. This complete deck has PPT layouts with well-suited graphics and subject driven content. This deck consists of a total of forty-three slides. All templates are completely editable for your convenience. You can change the color, text, and font size of these slides. You can add or delete the content as per your requirement. Get access to this professionally designed complete deck presentation by clicking the download button below.
People who downloaded this PowerPoint presentation also viewed the following :
Content of this Powerpoint Presentation
Slide 1: This title slide introduces the Business Analysis Canvas. Add the name of your company here.
Slide 2: This is the Agenda slide of Business Analysis Canvas.
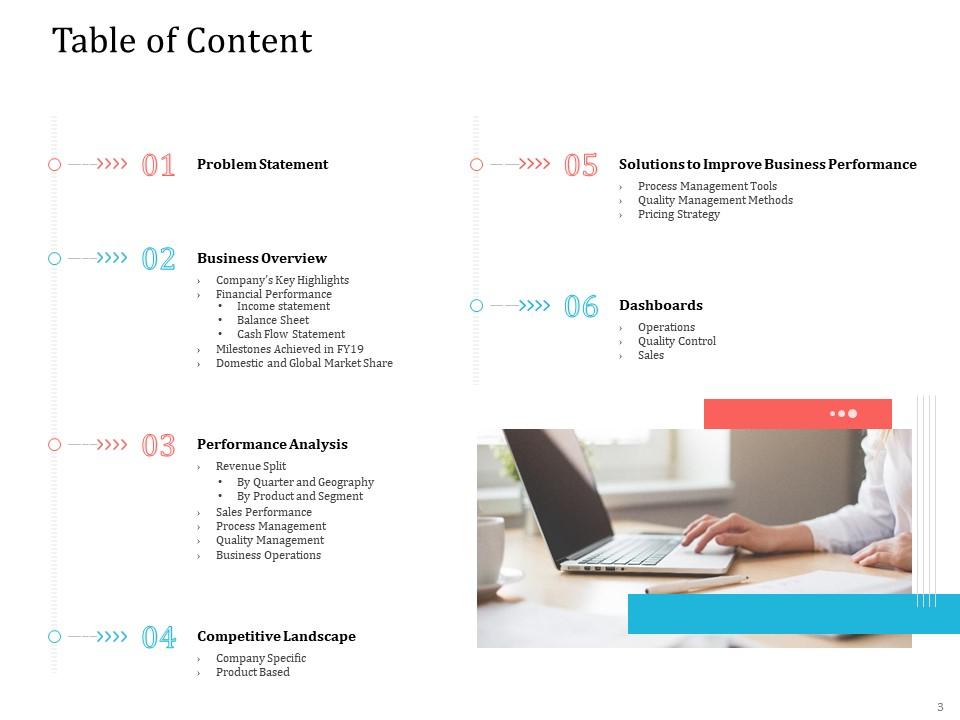
Slide 3: This slide contains the Table of Content. It includes - Problem Statement, Performance Analysis, Business Overview, etc.
Slide 4: This is a table of content slide showing the Problem Statement.
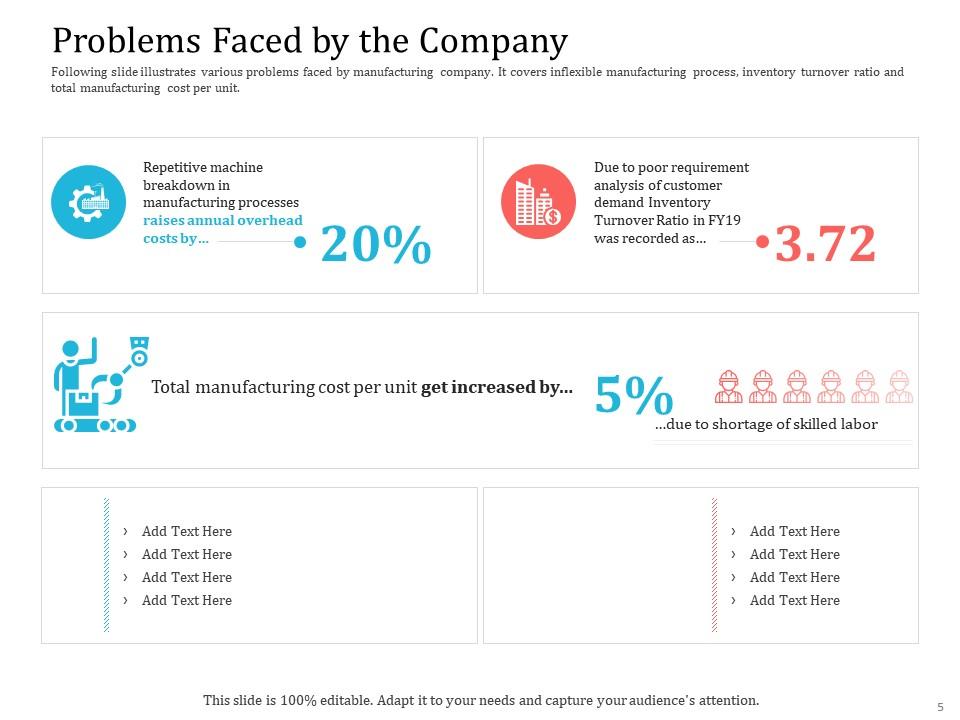
Slide 5: This slide presents the Problems Faced by the Company.
Slide 6: This is a table of content slide showing the Business Overview.
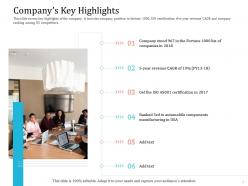
Slide 7: This slide presents the Company’s Key Highlights.
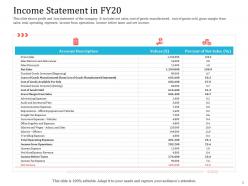
Slide 8: This slide presents the Income Statement in FY20.
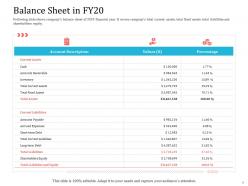
Slide 9: This slide presents the Balance Sheet in FY20.
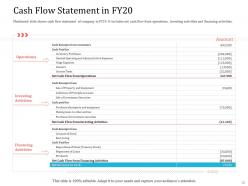
Slide 10: This slide presents the Cash Flow Statement in FY20.
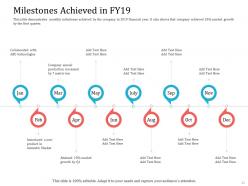
Slide 11: This slide presents the Milestones Achieved in FY19.
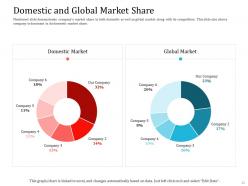
Slide 12: This slide presents the Domestic and Global Market Share.
Slide 13: This is a table of content slide showing the Performance Analysis.
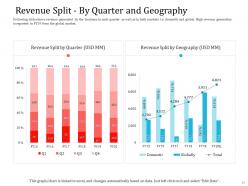
Slide 14: This slide presents the Revenue Split - By Quarter and Geography.
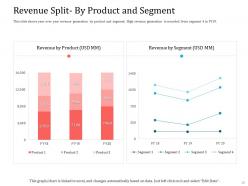
Slide 15: This slide presents the Revenue Split- By Product and Segment.
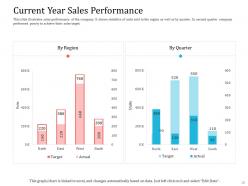
Slide 16: This slide presents the Current Year Sales Performance.
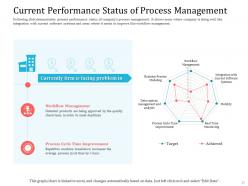
Slide 17: This slide presents the Current Performance Status of Process Management.
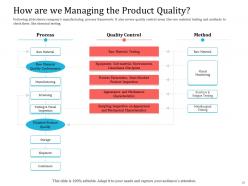
Slide 18: This slide presents How are we Managing Product Quality?
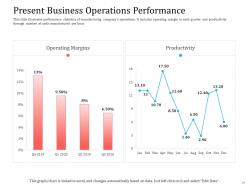
Slide 19: This slide presents the Present Business Operations Performance.
Slide 20: This is a table of content slide showing the Competitive Landscape.
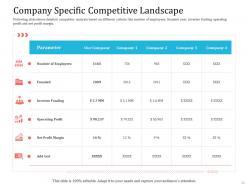
Slide 21: This slide presents the Company Specific Competitive Landscape.
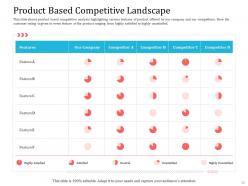
Slide 22: This slide presents the Product Based Competitive Landscape.
Slide 23: This is a table of content slide showing the Solutions to Improve Business Performance.
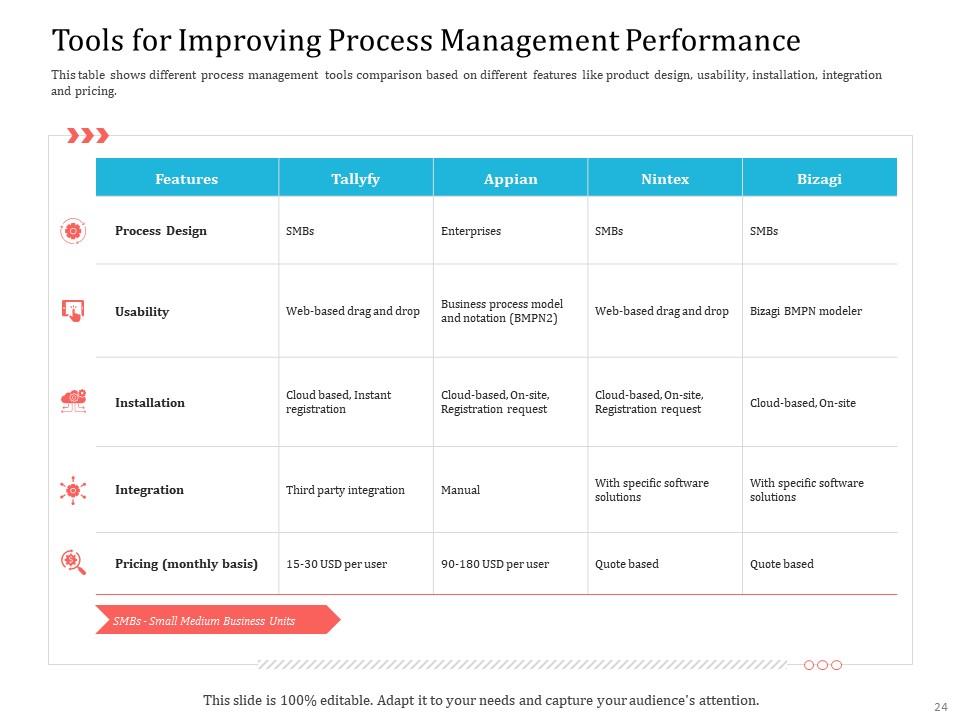
Slide 24: This slide presents the Tools for Improving Process Management Performance.
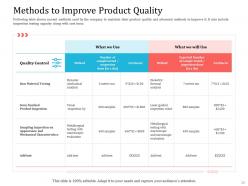
Slide 25: This slide presents the Methods to Improve Product Quality.
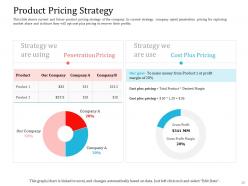
Slide 26: This slide presents the Product Pricing Strategy. This slide shows the current and future product pricing strategy of the company. In the current strategy, the company opted for penetration pricing for capturing
Slide 27: This is a table of content slide showing the Dashboards.
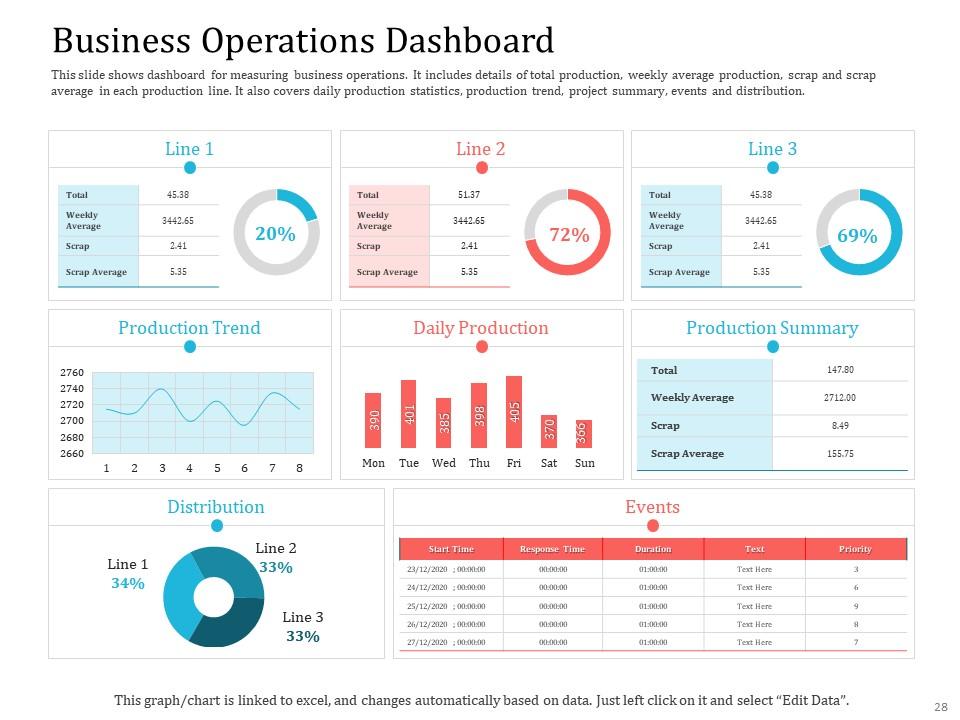
Slide 28: This slide presents the Business Operations Dashboard.
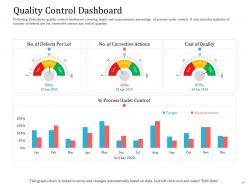
Slide 29: This slide presents the Quality Control Dashboard.
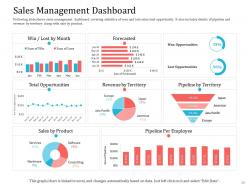
Slide 30: This slide presents the Sales Management Dashboard.
Slide 31: This is the Icon Slide for Business Analysis Canvas.
Slide 32: This slide presents the Graphs & Charts.
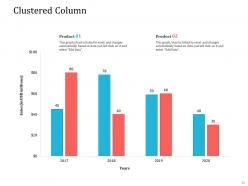
Slide 33: This slide shows a Clustered Column that compares 2products’ sales over a timeline of years.
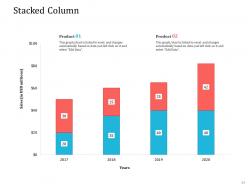
Slide 34: This slide shows a Stacked Column that compares 2 products’ sales over a timeline of years.
Slide 35: This slide introduces the ADDITIONAL SLIDES.
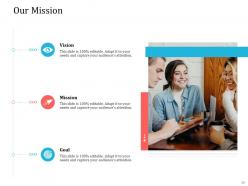
Slide 36: This slide provides the Mission for the entire company. This includes the vision, the mission, and the goal.
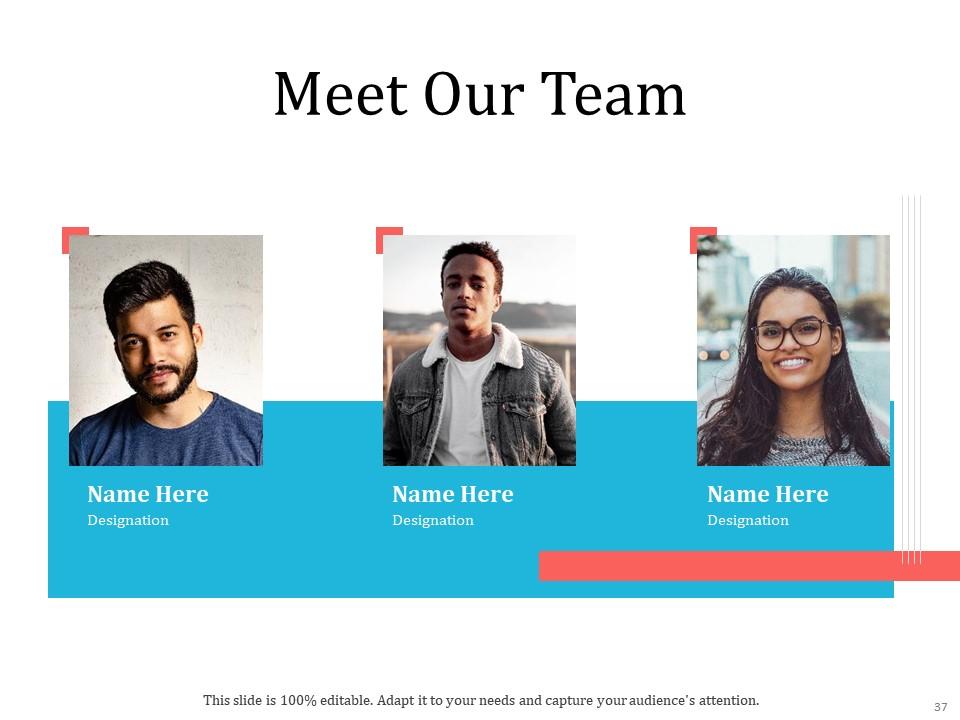
Slide 37: This slide shows the members of the company team with their name, designation, and photo.
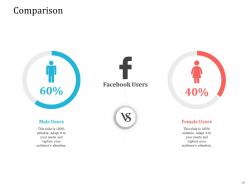
Slide 38: This slide presents the Comparison between the percentages of male and female Facebook users.
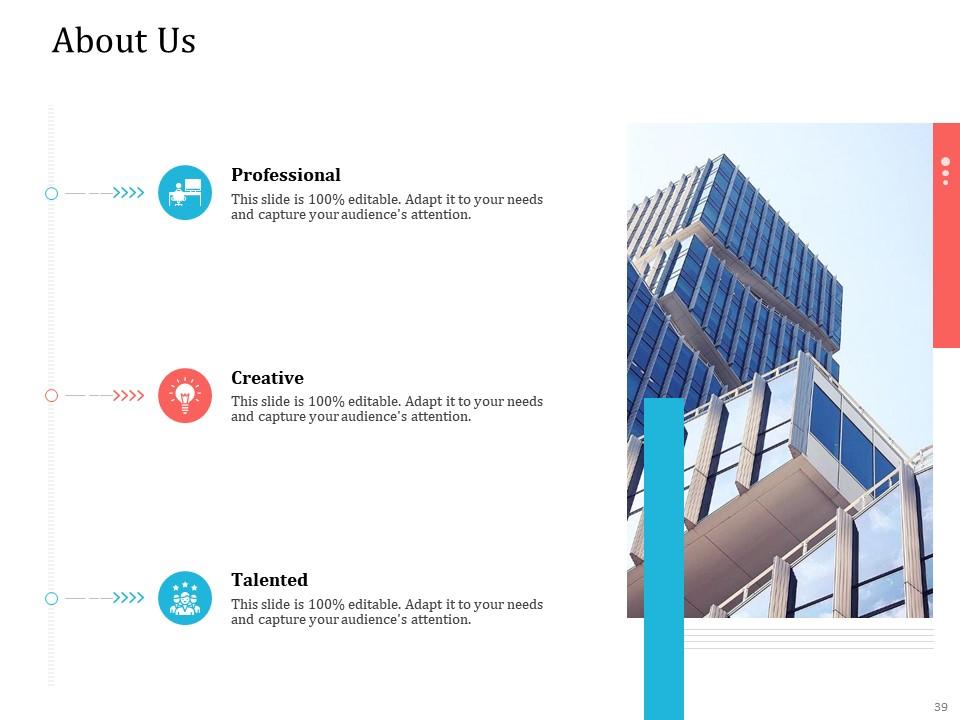
Slide 39: This slide contains the information about the company aka the ‘About Us’ section. This includes Creative, Talented, and Professional.
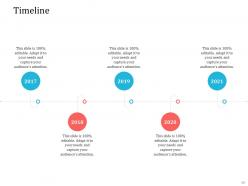
Slide 40: This slide is a Timeline template to showcase the progress of the steps of a project with time.
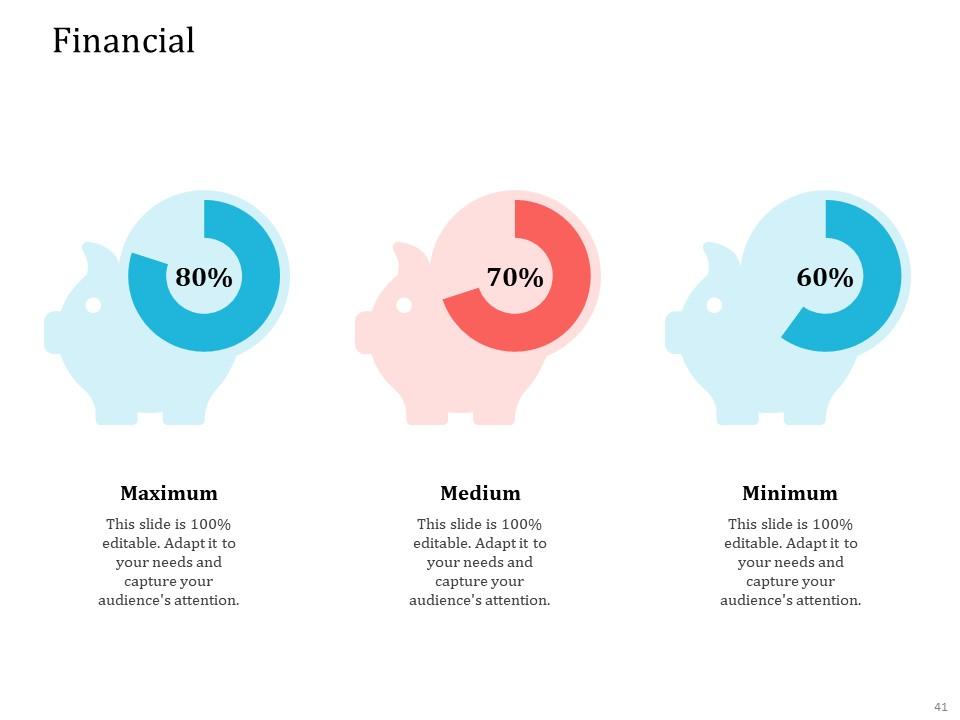
Slide 41: This slide presents the Financial with a data’s numbers at minimum, medium, and maximum percentage.
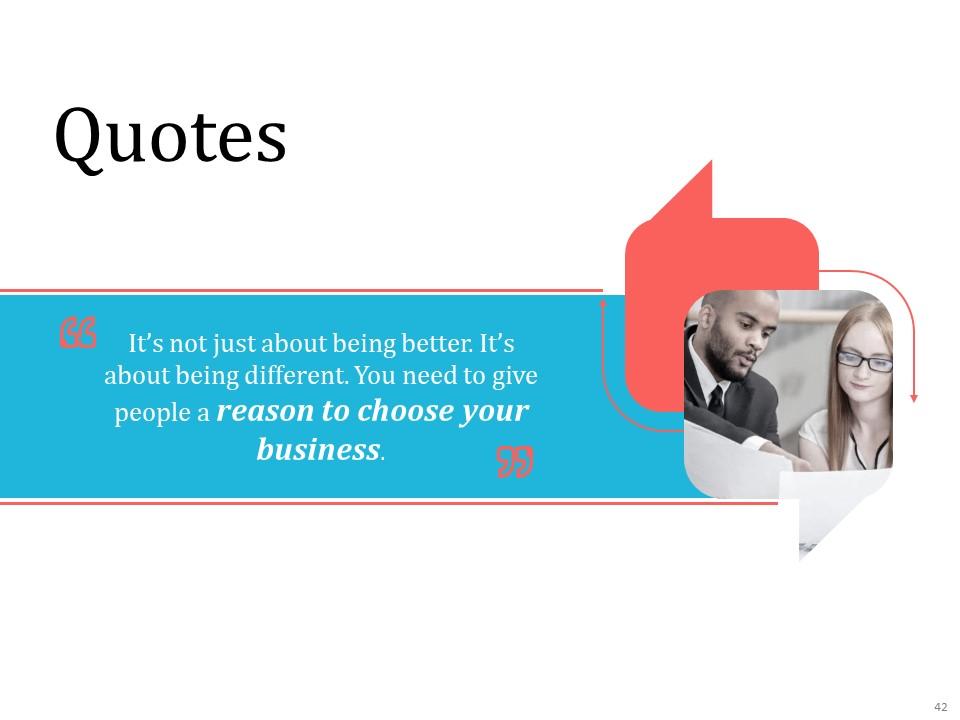
Slide 42: This is the Quotes slide.
Slide 43: This is a Thank You slide where details such as the address, contact number, email address are added.
Business analysis canvas powerpoint presentation slides with all 43 slides:
Use our Business Analysis Canvas Powerpoint Presentation Slides to effectively help you save your valuable time. They are readymade to fit into any presentation structure.
-
Very unique and reliable designs.
-
Editable templates with innovative design and color combination.
-
Very well designed and informative templates.
-
Easily Understandable slides.


