Web style market scorecard with tabs to choose quickly and fast powerpoint diagram templates graphics 712
Make your presentation stand out. With a nearly limitless selection our web style market scorecard with tabs to choose quickly and fast powerpoint diagram templates graphics 712 are aimed at every presentation need.
You must be logged in to download this presentation.
PowerPoint presentation slides
These high quality, editable pre-designed web style market scorecard with tabs to choose quickly and fast powerpoint diagram templates graphics 712 powerpoint slides and powerpoint templates have been carefully created by our professional team to help you impress your audience. Each graphic in every powerpoint slide is vector based and is 100% editable in powerpoint.
People who downloaded this PowerPoint presentation also viewed the following :
Content of this Powerpoint Presentation
Description:
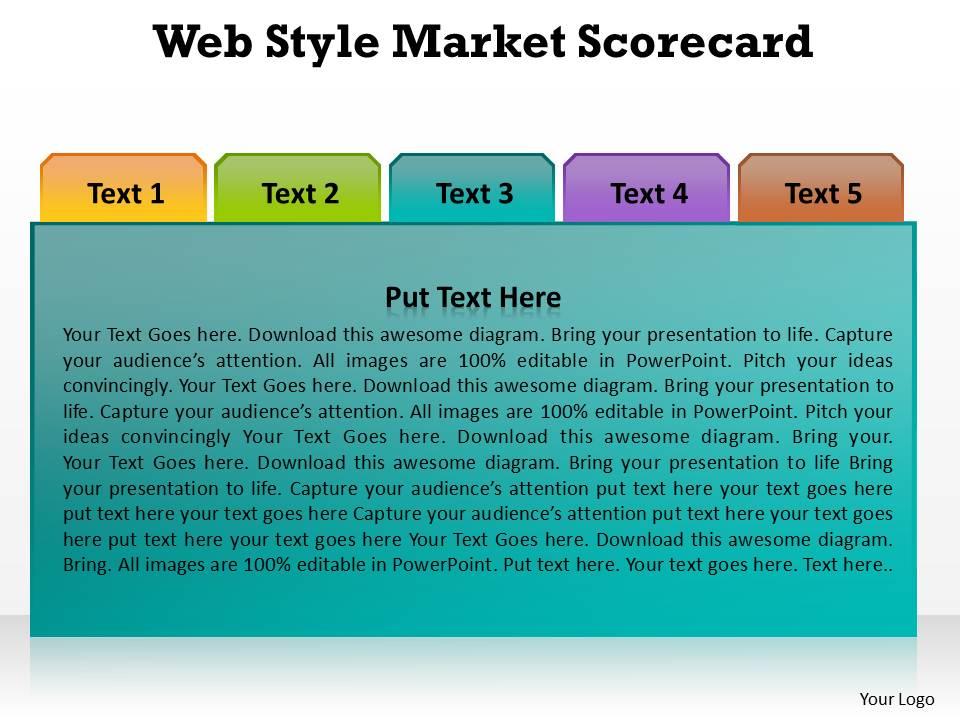
The image showcases a PowerPoint slide template titled "Web Style Market Scorecard," designed for presenting data or information neatly, particularly in the context of market assessments or evaluations, possibly related to web or digital performance metrics.
The template consists of a top header section featuring the bold title. Below the title in the main content area, there are five placeholder boxes labeled "Text 1"to "Text 5," intended for concise bullet points or discrete data entries, likely for category titles or key points. A larger text area on a teal background called "Put Text Here" spans almost the width of the slide below these boxes, likely designed for detailed explanations or elaborations of the bullet points above.
Throughout the template, there are repeated prompts to "Download this awesome diagram" and phrases to "Capture your audience's attention" and "Pitch your ideas convincingly," which seem like meta-instructions or placeholders for actual content to be added by the user. These also emphasize the customizable nature of the template, with claims that "All images are 100% editable in PowerPoint."
In the bottom right corner, there's a space for "Your Logo," indicating where a company or personal branding can be added.
Use Cases:
Given the structure and purpose of this slide, it can be applied across various industries:
1. E-commerce:
Use: Presenting web traffic and conversion analytics
Presenter: Marketing analyst
Audience: Marketing team and executives
2. Digital Marketing:
Use: Reporting on campaign performance metrics
Presenter: Digital marketing specialist
Audience: Clients or internal marketing teams
3. Education:
Use: Illustrating online course engagement statistics
Presenter: Education technologist
Audience: Faculty and administrative staff
4. Financial Services:
Use: Summarizing web-based customer service interactions
Presenter: Customer experience manager
Audience: Service team and management
5. Web Development:
Use: Detailing website usability scores and feedback
Presenter: User experience (UX) researcher
Audience: Web development team
6. Healthcare:
Use: Displaying patient portal usage and satisfaction levels
Presenter: Healthcare administrator
Audience: Hospital staff and stakeholders
7. Retail:
Use: Reviewing online store performance and customer satisfaction
Presenter: Retail analyst
Audience: Store managers and retail executives
Web style market scorecard with tabs to choose quickly and fast powerpoint diagram templates graphics 712 with all 4 slides:
Make a statement in your next meeting. Use vibrant web style market scorecard with tabs to choose quickly and fast powerpoint diagram templates graphics 712 to highlight your valuable contributions.
-
Qualitative and comprehensive slides.
-
Innovative and Colorful designs.


