Project product management status powerpoint presentation with slides
While working on a project plan often many of us have tasks that need to be finished as soon as possible. To make this race an overwhelming one here we are showcasing a readymade Project Product Management Status presentation deck. You can use this complete PowerPoint slide presentation sample to present your project management report in an engaging manner. Having exclusive status report template this PPT sample file also supports to emphasize whether operations are going on within the stipulated time frame or not. Not finished yet, as to give an edge with our PPT model we have conceptualized original slide templates like of Milestones Achieved, Target with Arrow, Budget Report, Risk Management Report, Project Health Card etc. Irrespective of the fact whether your project is in planning phase or on the move, our readymade PowerPoint show offers an opportunity to present a status report in an elegant style. Move from the fringes to the centre with our Project Product Management Status Complete Powerpoint Deck With Slides. They allow you to stake your claim.
While working on a project plan often many of us have tasks that need to be finished as soon as possible. To make this race..
- Google Slides is a new FREE Presentation software from Google.
- All our content is 100% compatible with Google Slides.
- Just download our designs, and upload them to Google Slides and they will work automatically.
- Amaze your audience with SlideTeam and Google Slides.
-
Want Changes to This PPT Slide? Check out our Presentation Design Services
- WideScreen Aspect ratio is becoming a very popular format. When you download this product, the downloaded ZIP will contain this product in both standard and widescreen format.
-

- Some older products that we have may only be in standard format, but they can easily be converted to widescreen.
- To do this, please open the SlideTeam product in Powerpoint, and go to
- Design ( On the top bar) -> Page Setup -> and select "On-screen Show (16:9)” in the drop down for "Slides Sized for".
- The slide or theme will change to widescreen, and all graphics will adjust automatically. You can similarly convert our content to any other desired screen aspect ratio.
Compatible With Google Slides

Get This In WideScreen
You must be logged in to download this presentation.
PowerPoint presentation slides
Complete set of 46 high resolution PowerPoint templates. Saves time as all set to bring into play. Adequate space given to insert text, titles and sub titles. Exclusive ‘Business Quote’ and ‘Thank you’ PPT slides at the conclusion. Fully customizable presentation designs, text, font, colors and layout. Professionally conceptualized colorful tables, graphs and diagrams. Easy to insert company logo, trademark, animation and more. Easy and quick downloading process.
People who downloaded this PowerPoint presentation also viewed the following :
Content of this Powerpoint Presentation
Slide 1: This slide introduces Project Product Management Status. State Your Company Name and get started.
Slide 2: This is Our Agenda slide. State your agendas here.
Slide 3: This is Our Mission slide. State mission here.
Slide 4: This is an About Us slide. State company/team specifications here.
Slide 5: This slide presents a Project Brief.
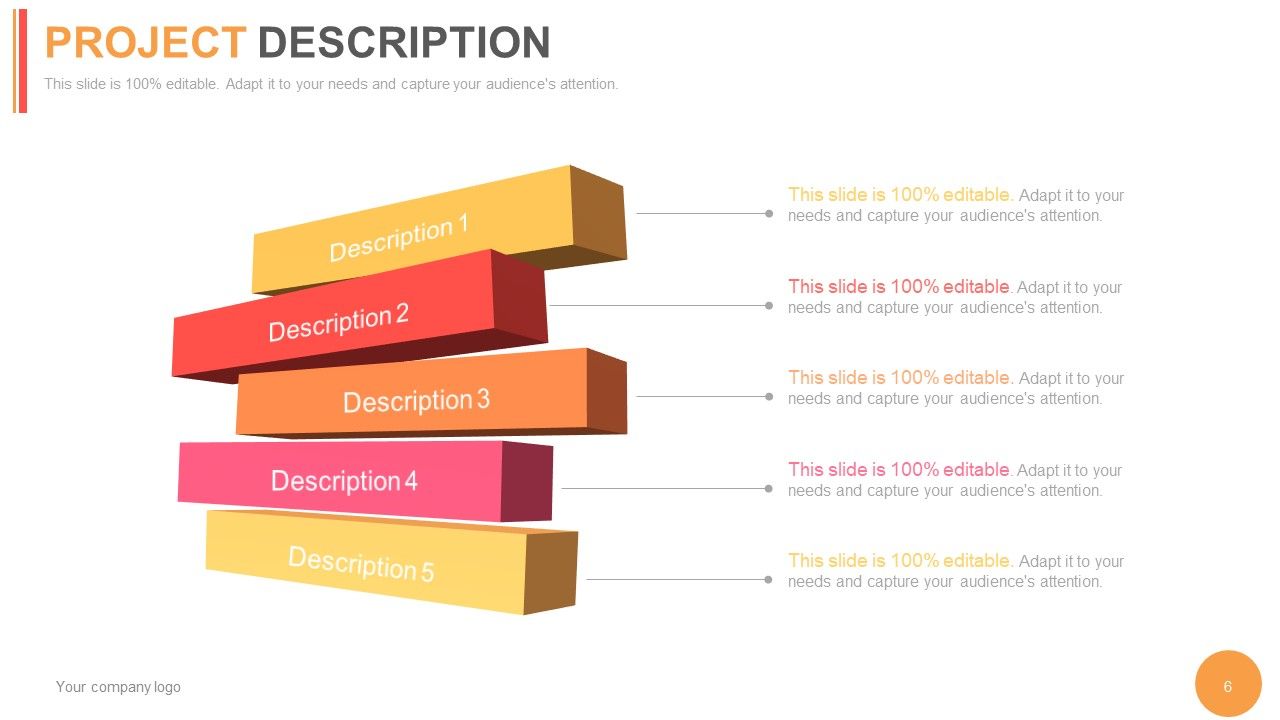
Slide 6: This slide showcases Project Description. Describe project nuances here.
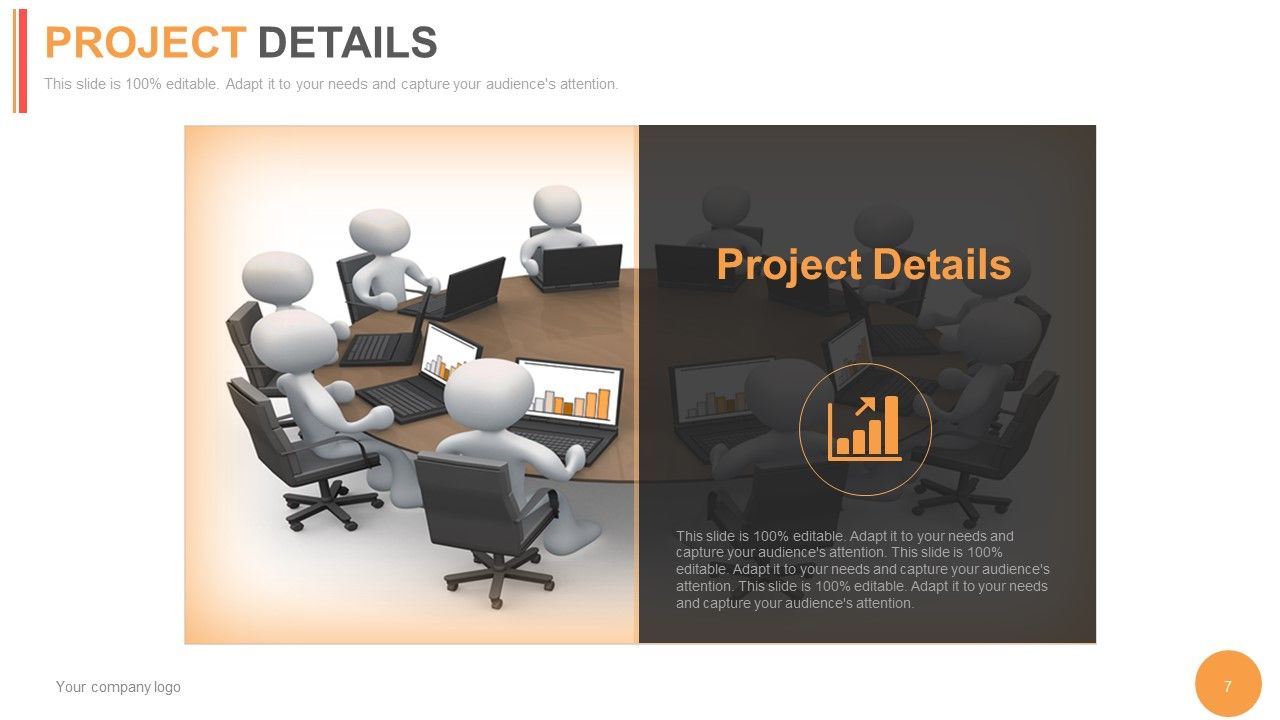
Slide 7: This slide showcases Project Details. Present details here.
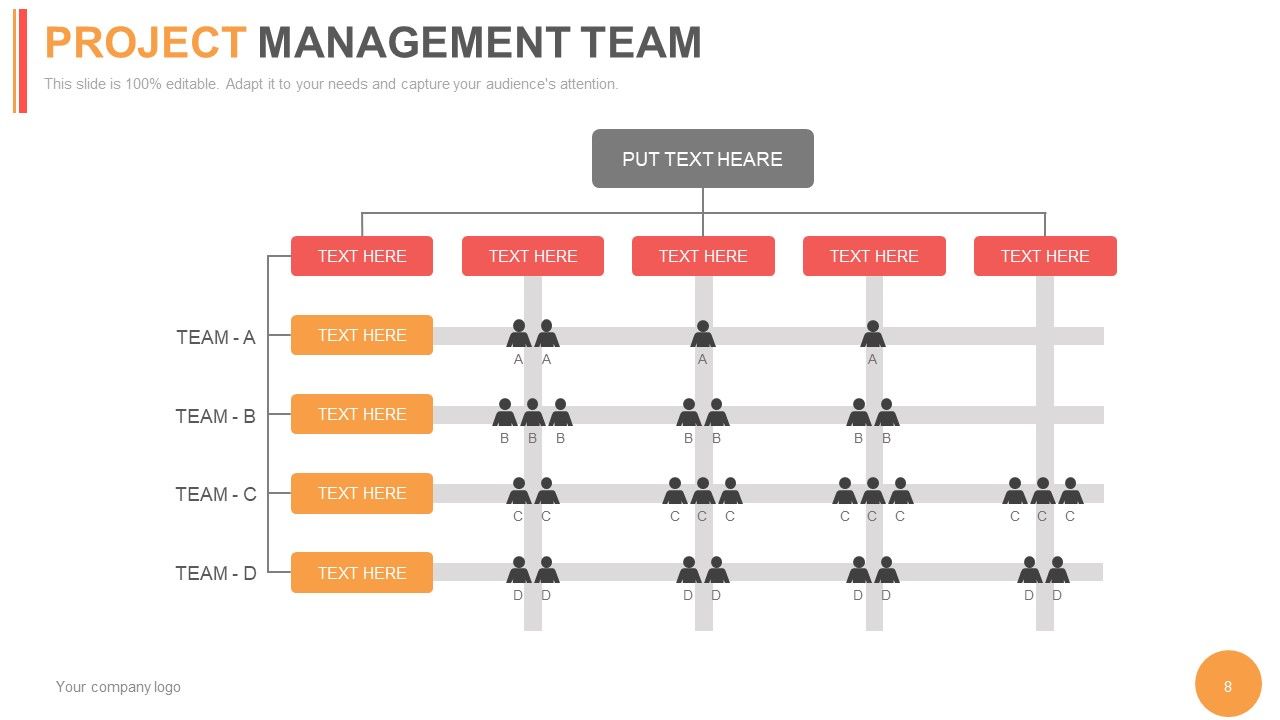
Slide 8: This slide showcases Project Management Team in Hierarchy form. Present team specifications here.
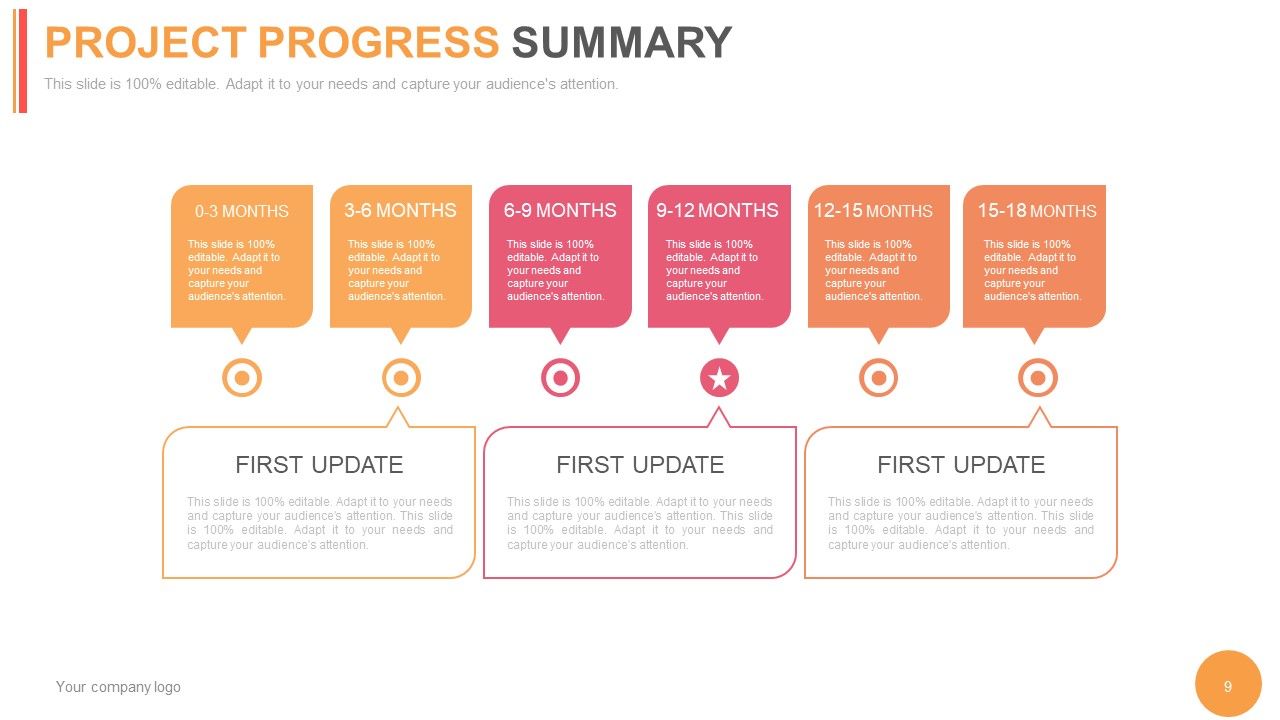
Slide 9: This slide shows Project Progress Summary in terms of months.
Slide 10: This slide shows another variation of Project Progress Summary in terms of months.
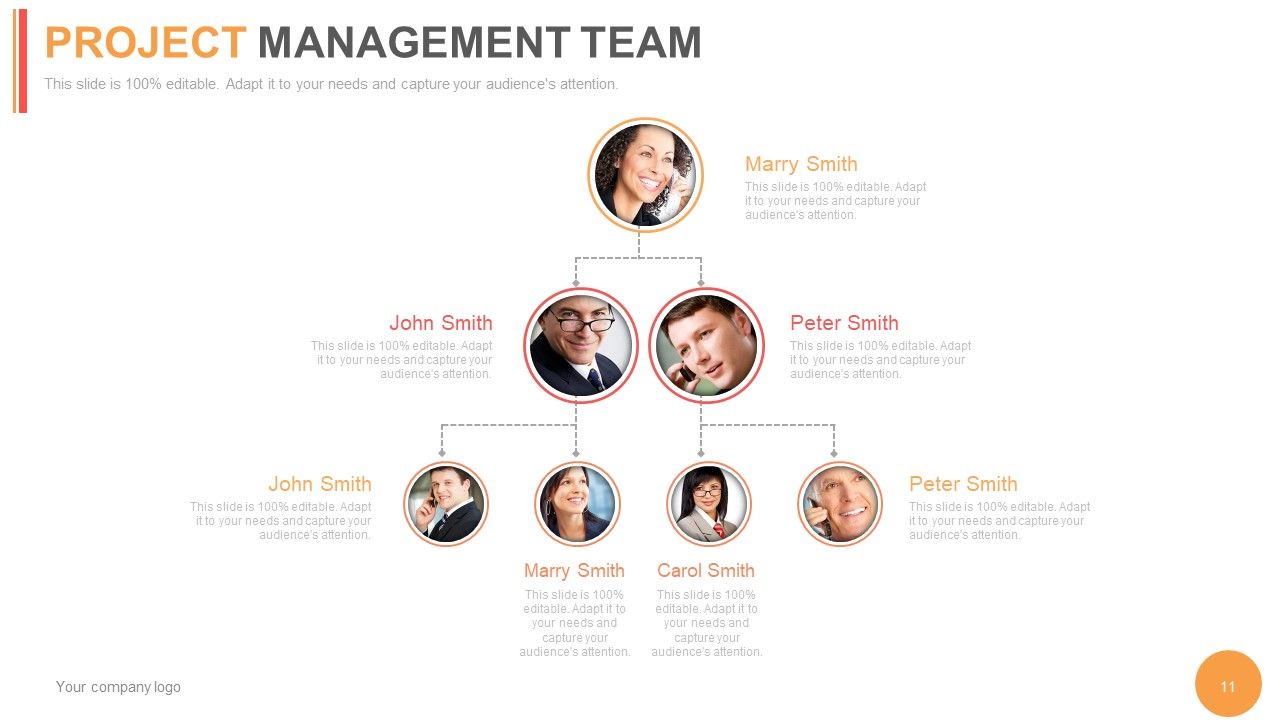
Slide 11: This slide showcases Project Management Team in Hierarchy form with image boxes. State name, designations, departments etc. here
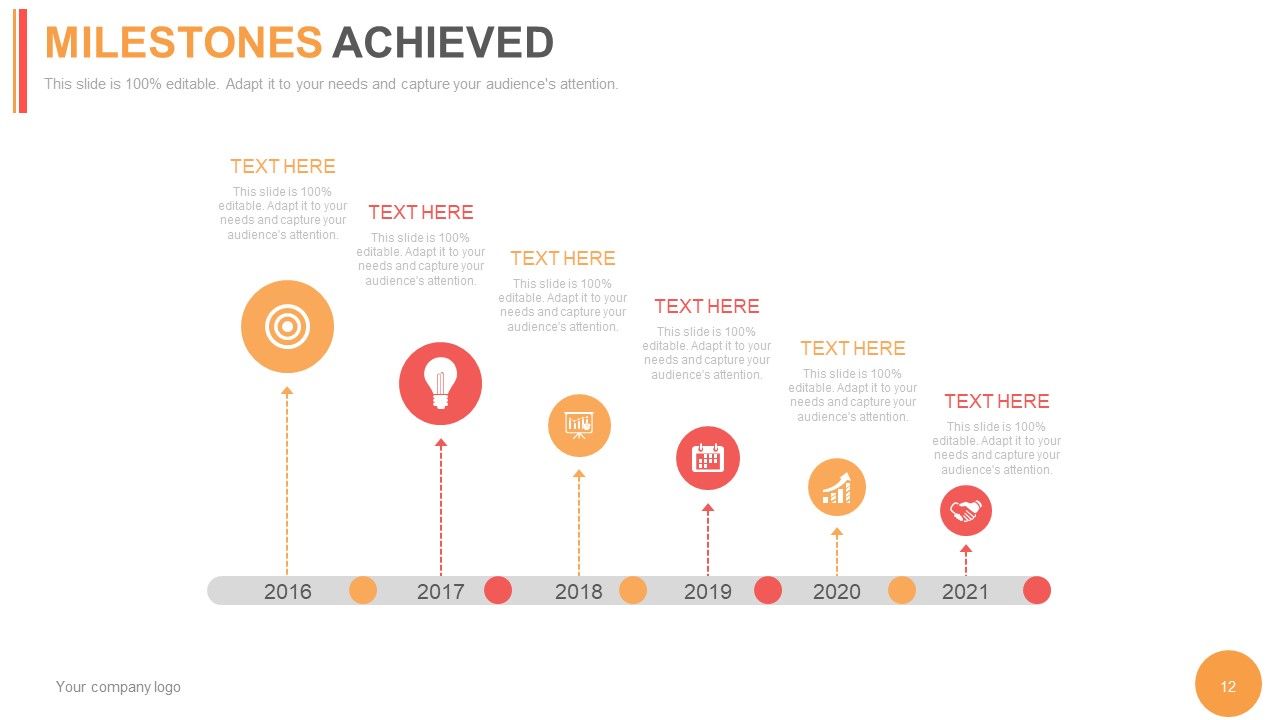
Slide 12: This slide presents Milestones Achieved for the Project. State them here.
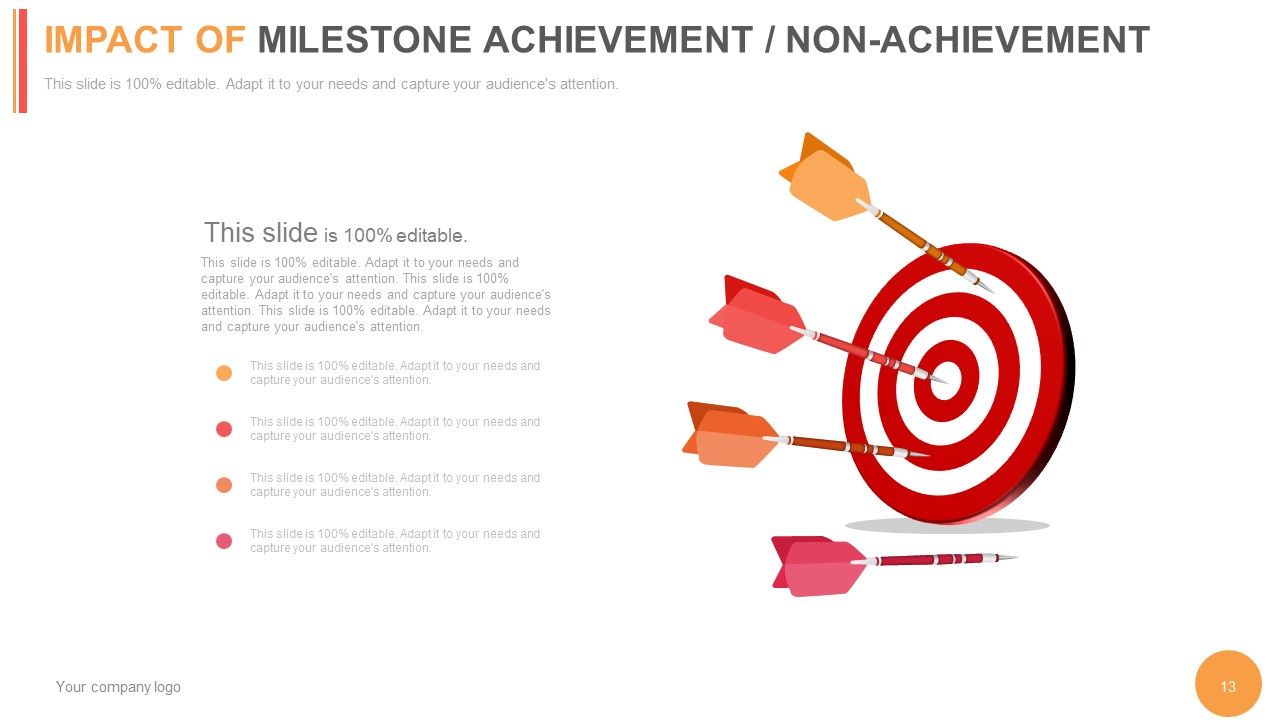
Slide 13: This slide presents Impact of Milestone Achievement/Non Achievement for the Project. State them here
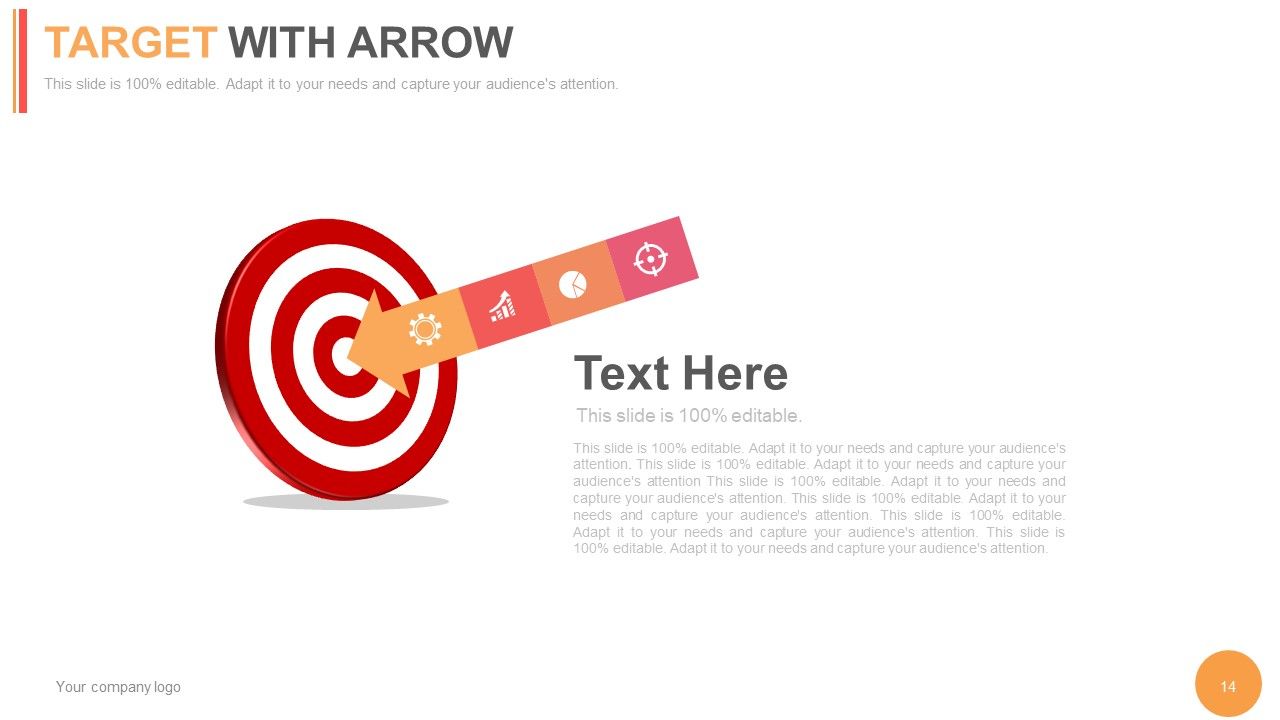
Slide 14: This slide presents Target With Arrow. State important targeted goals etc here.
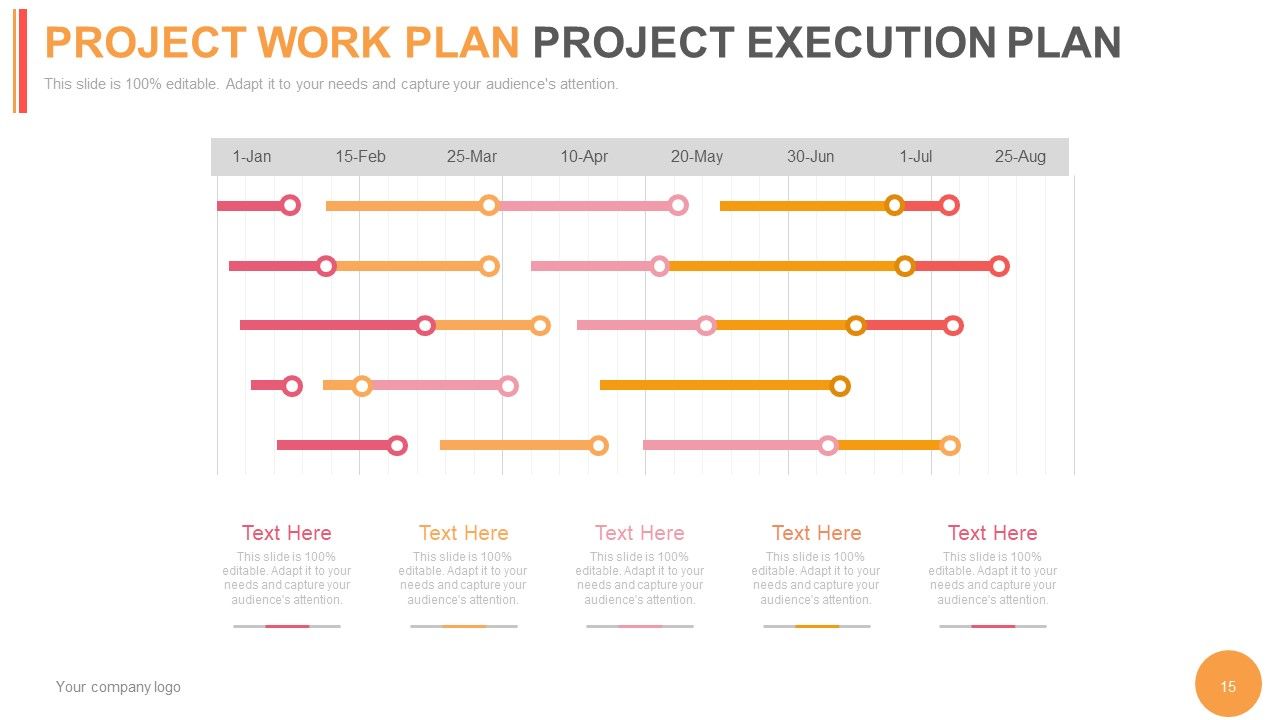
Slide 15: This slide presents Project Work Plan Project Execution Plan in terms of months.
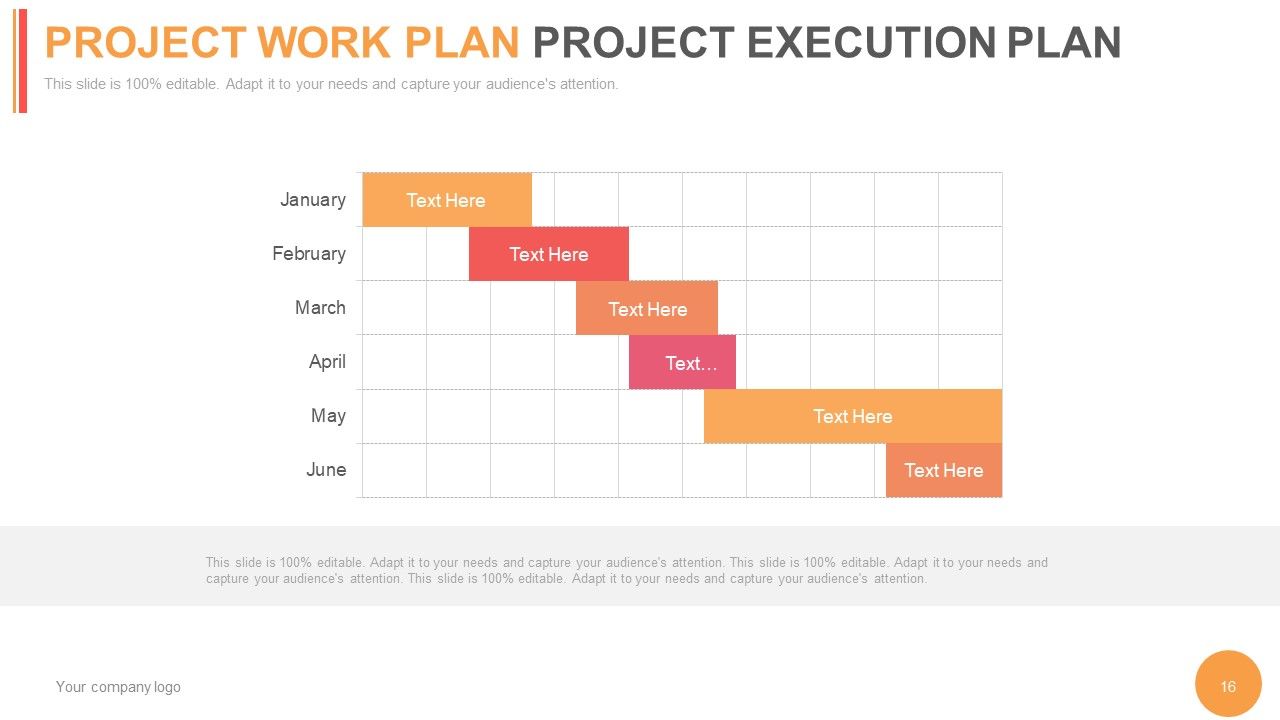
Slide 16: This slide presents Project Work Plan Project Execution Plan in Gantt Chart form.
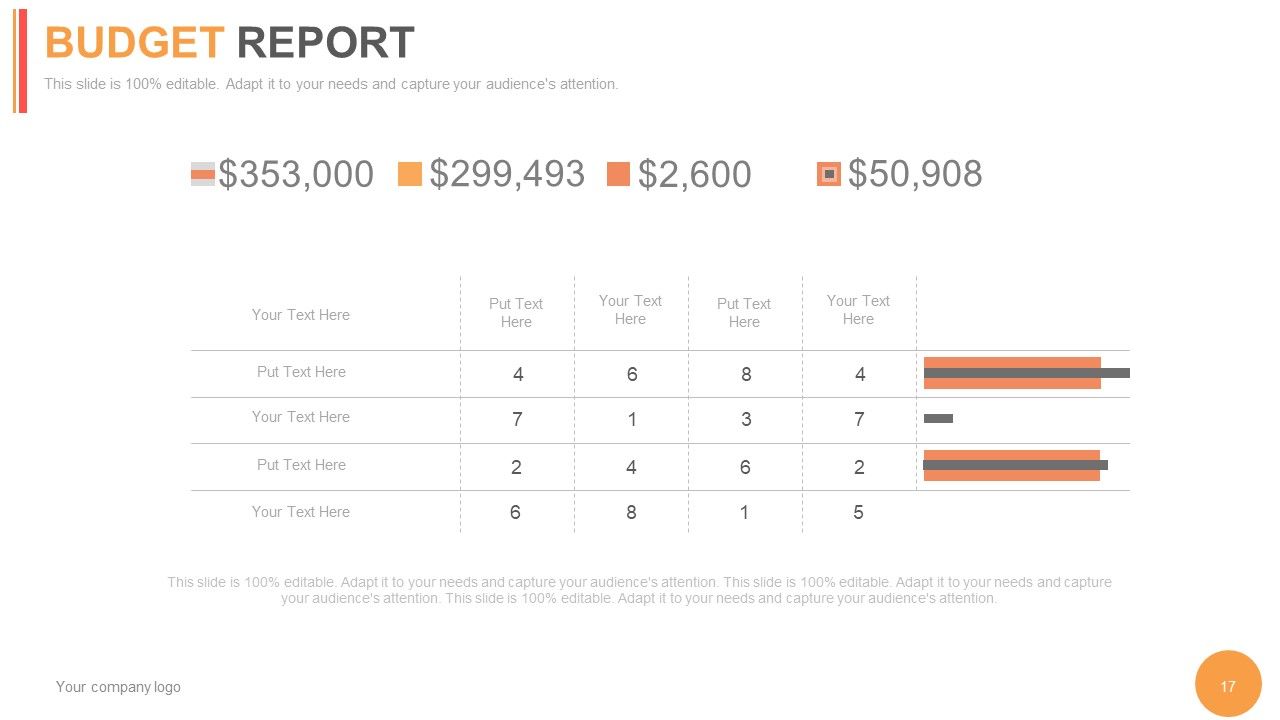
Slide 17: This slide presents a Budget Report for the Project.
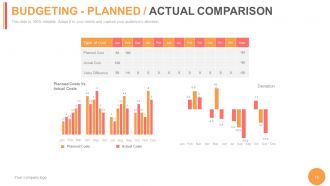
Slide 18: This slide showcases Budgeting - Planned / Actual Comparison.
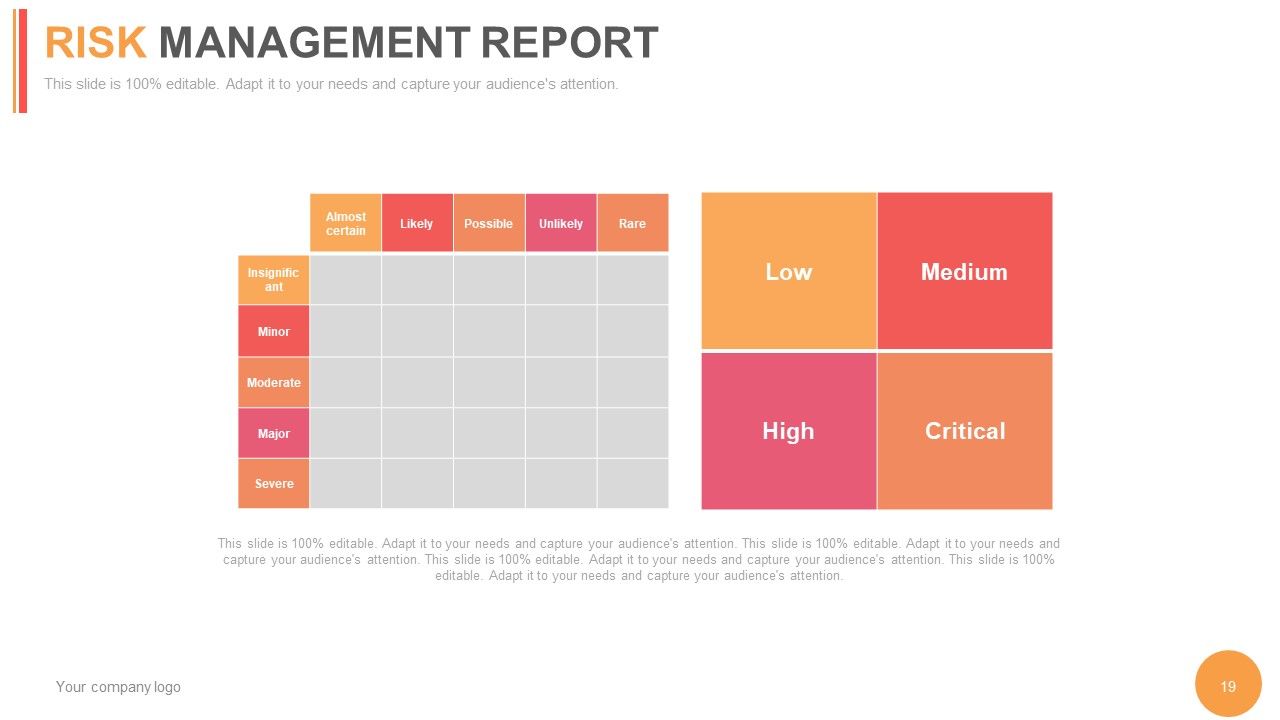
Slide 19: This slide shows Risk Management Report with low, medium and high.
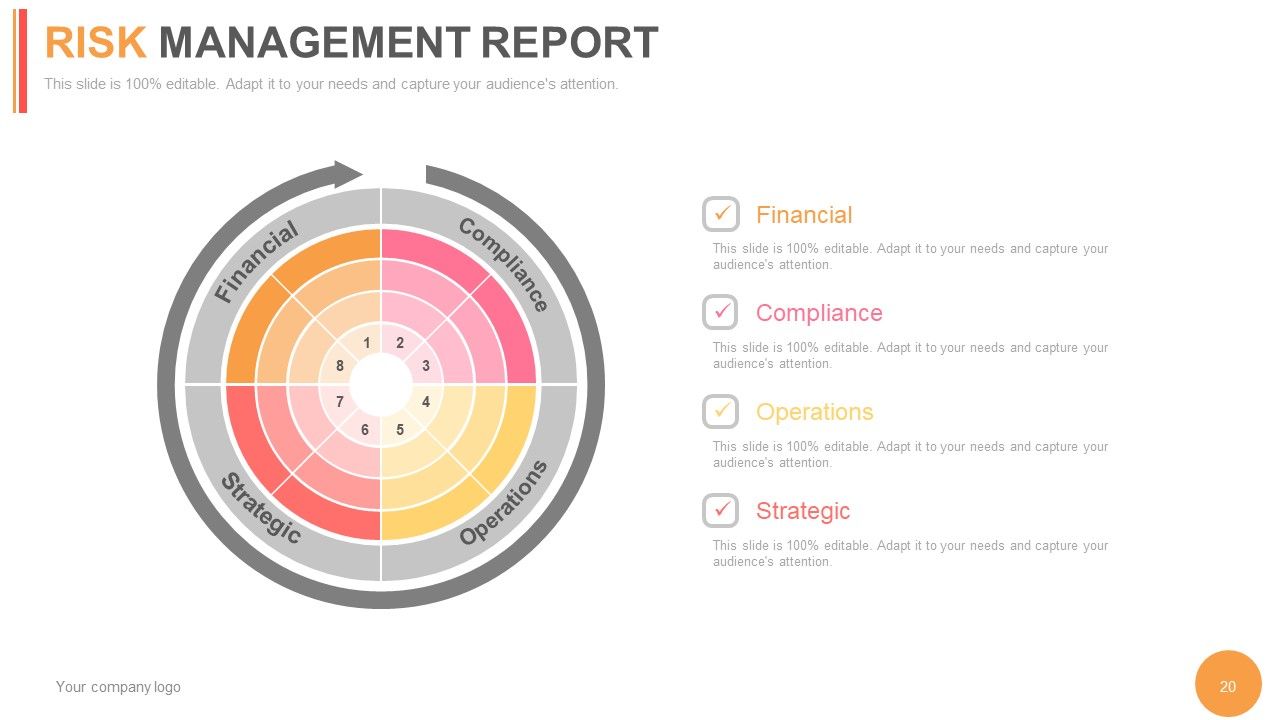
Slide 20: This slide shows Risk Management Report with- Financial, Compliance, Operations, Strategic subheadings.
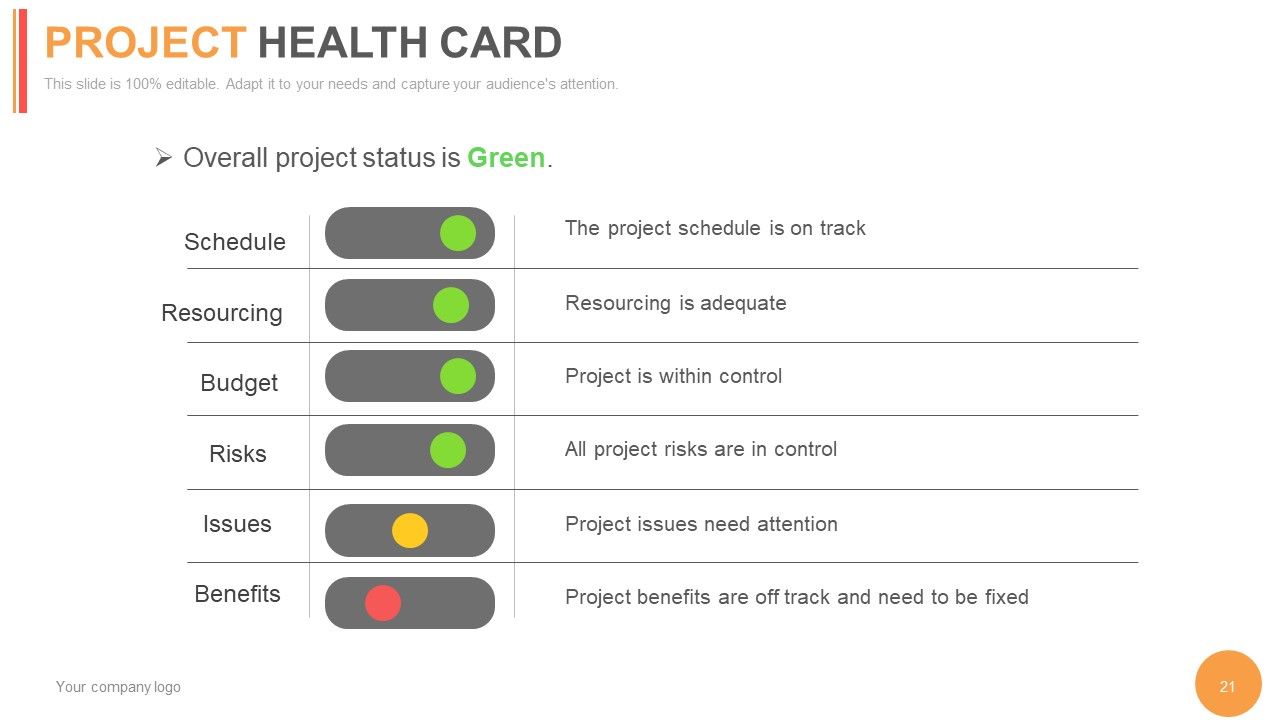
Slide 21: This slide presents a Project Health Card showcasing- Benefits, Issues, Schedule, Resourcing, Budget, Risks.
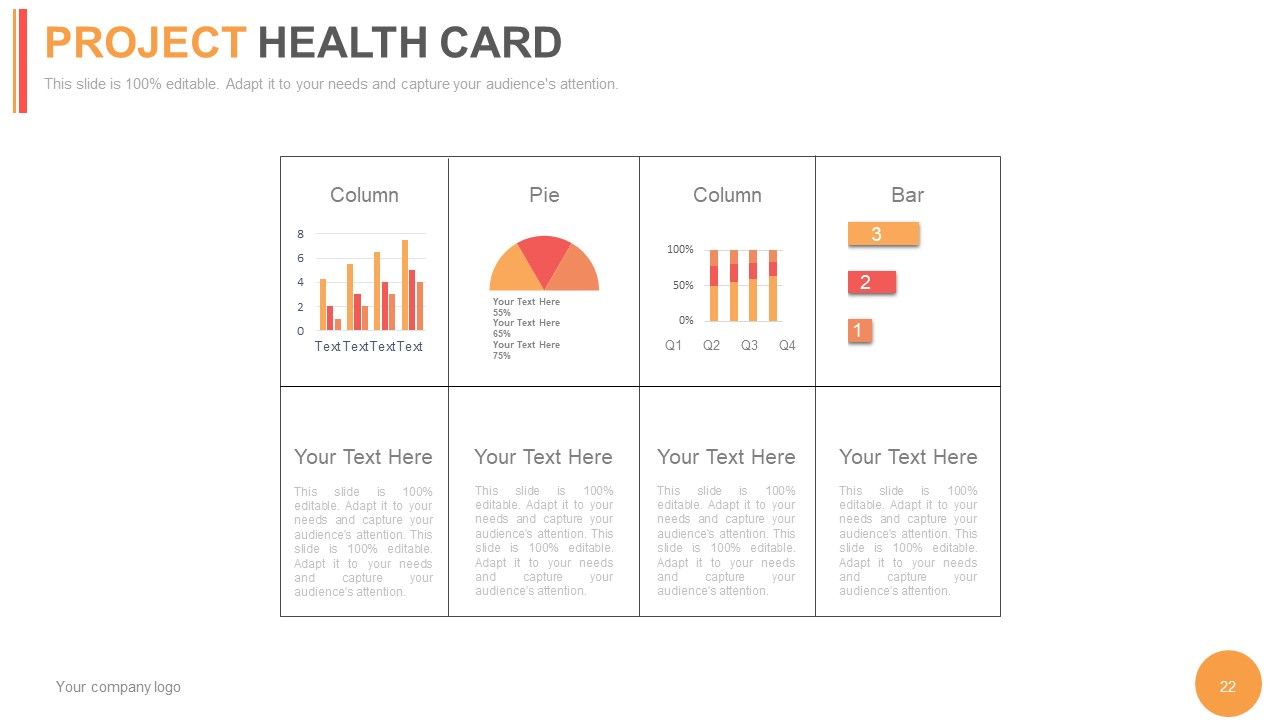
Slide 22: This slide presents a Project Health Card in Pie chart, Column Chart and Bar Chart form.
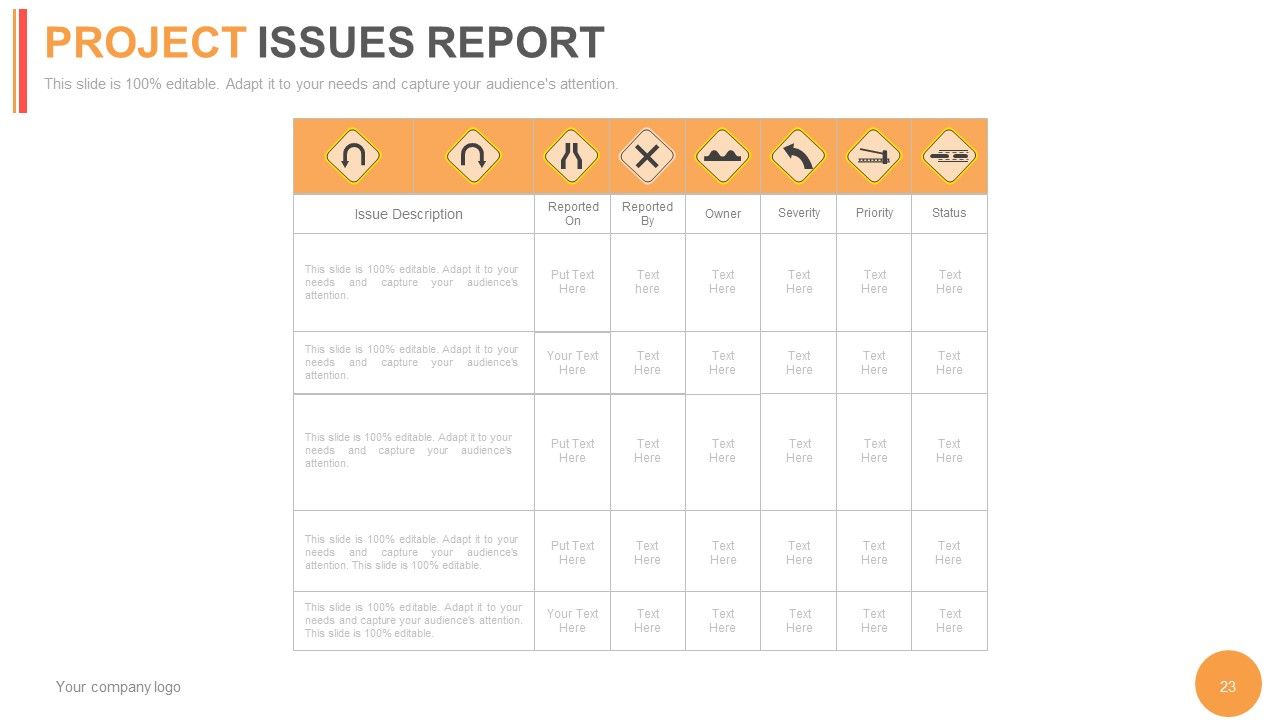
Slide 23: This slide presents Project Issues Report with- Issue Description, Reported On, Reported By, Owner, Severity, Priority, Status.
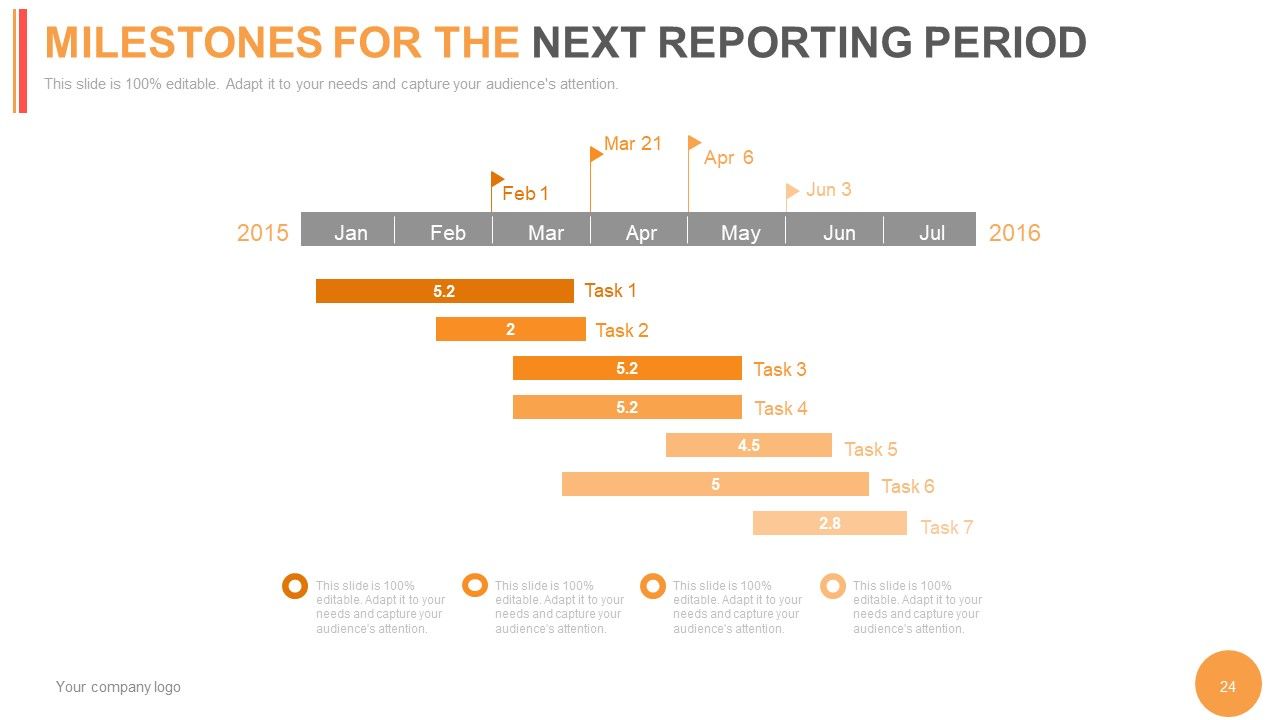
Slide 24: This slide shows Milestones For The Next Reporting Period in Gantt chart form.
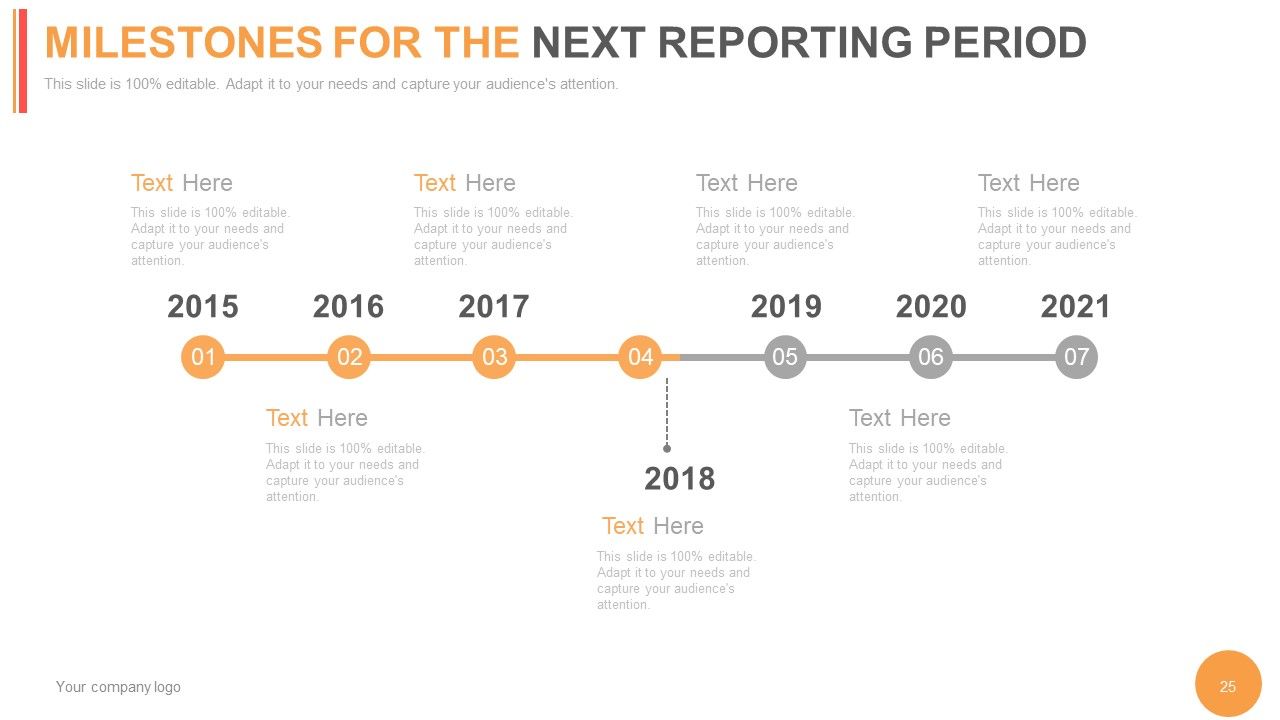
Slide 25: This slide shows Milestones For The Next Reporting Period in simple timeline form.
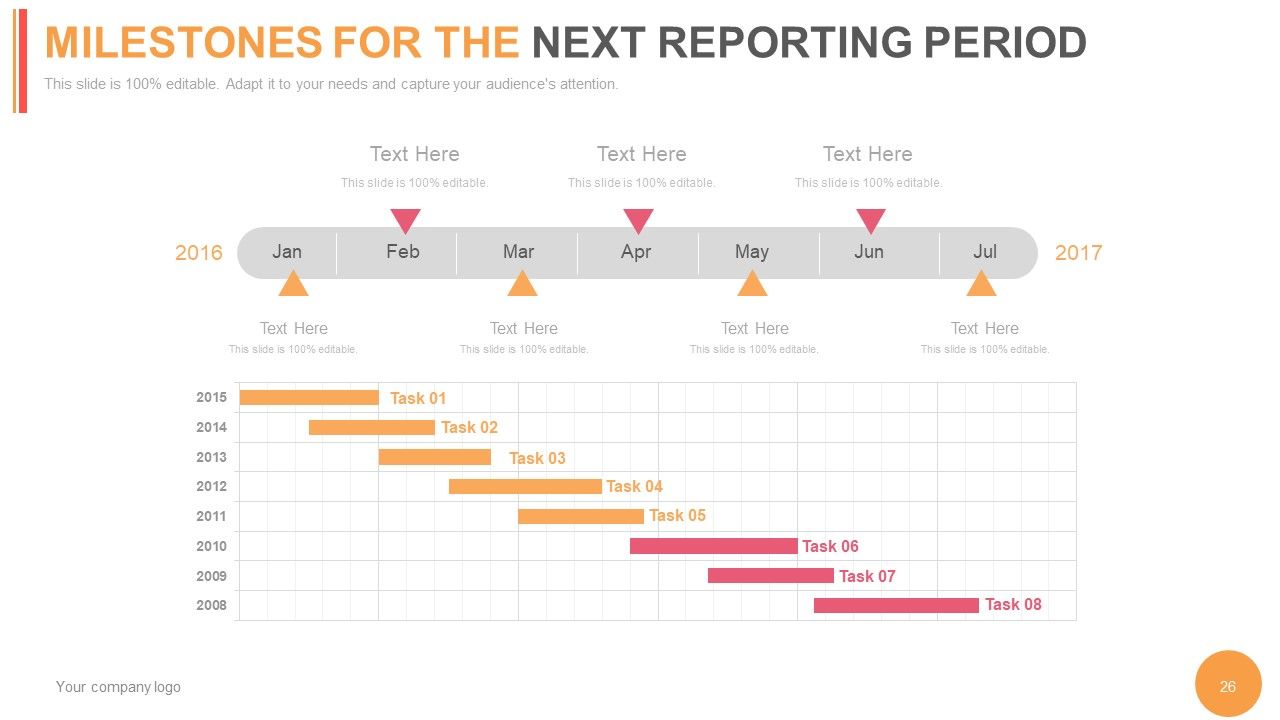
Slide 26: This slide shows Milestones For The Next Reporting Period in Gantt chart form displaying months and years.
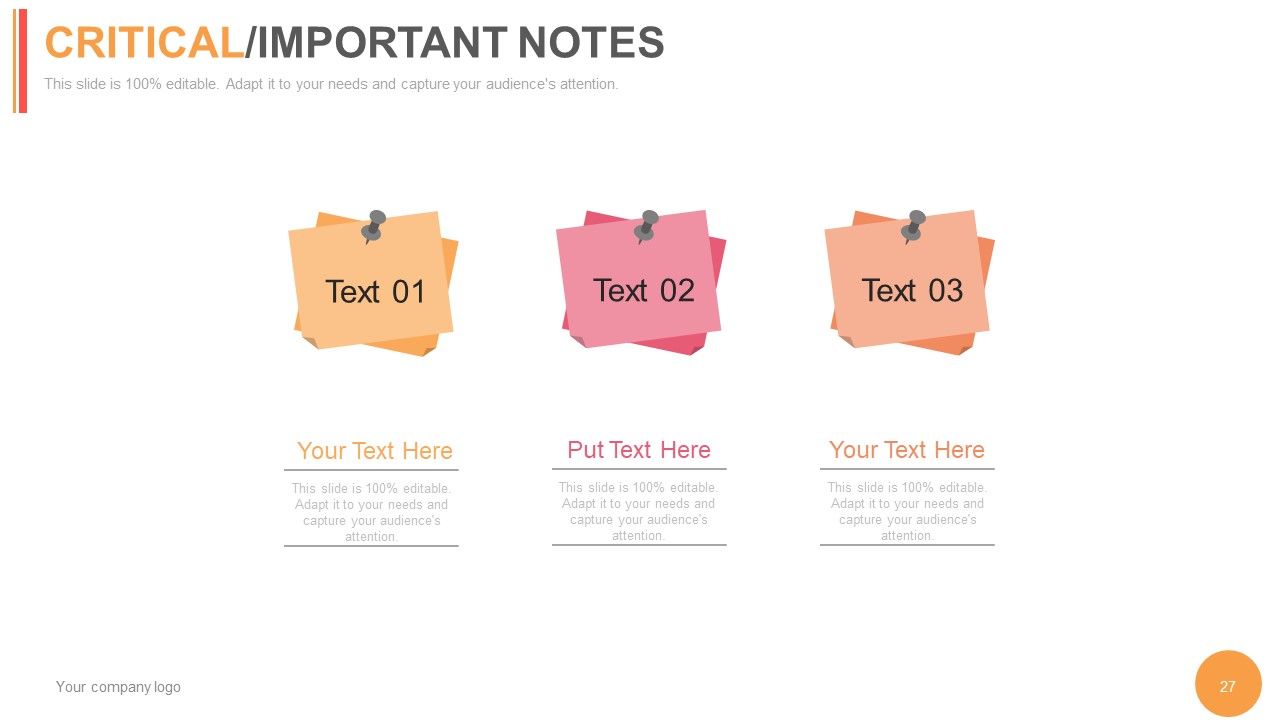
Slide 27: This slide showcases Critical/Important Notes to mark reminder, events or display important highlights.
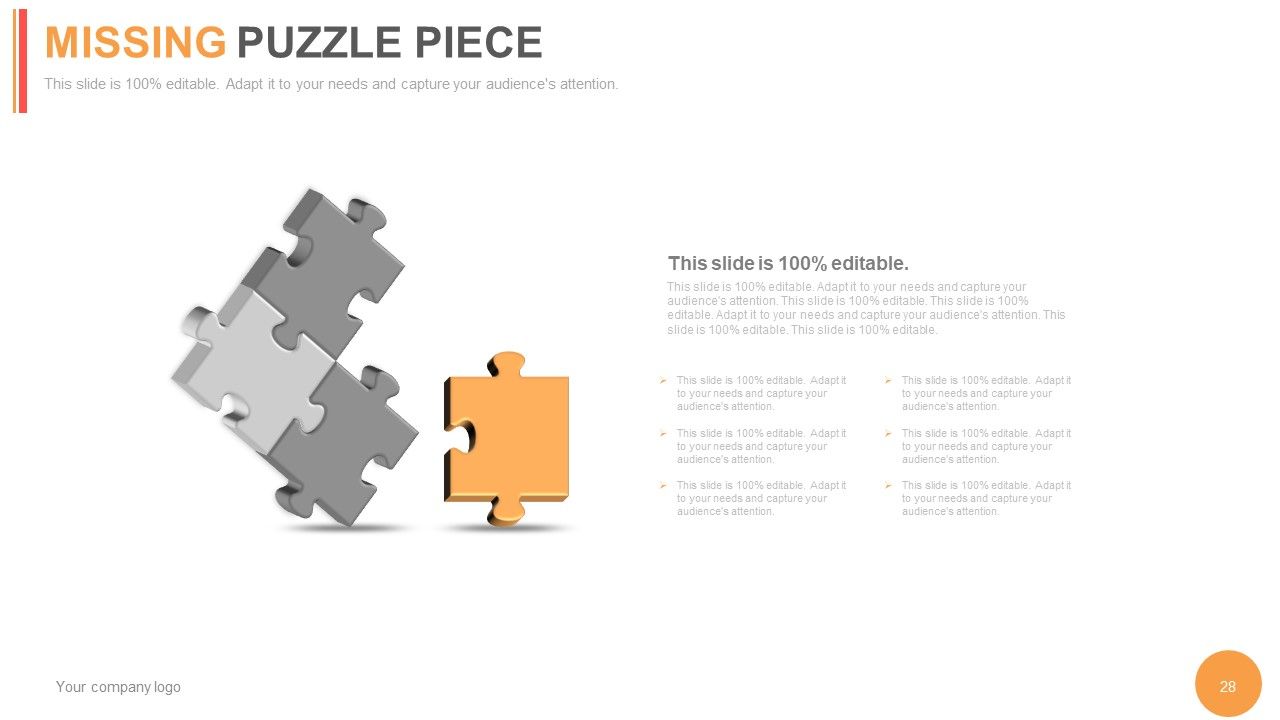
Slide 28: This slide presents Missing Puzzle Piece to highlight, or show important aspect.
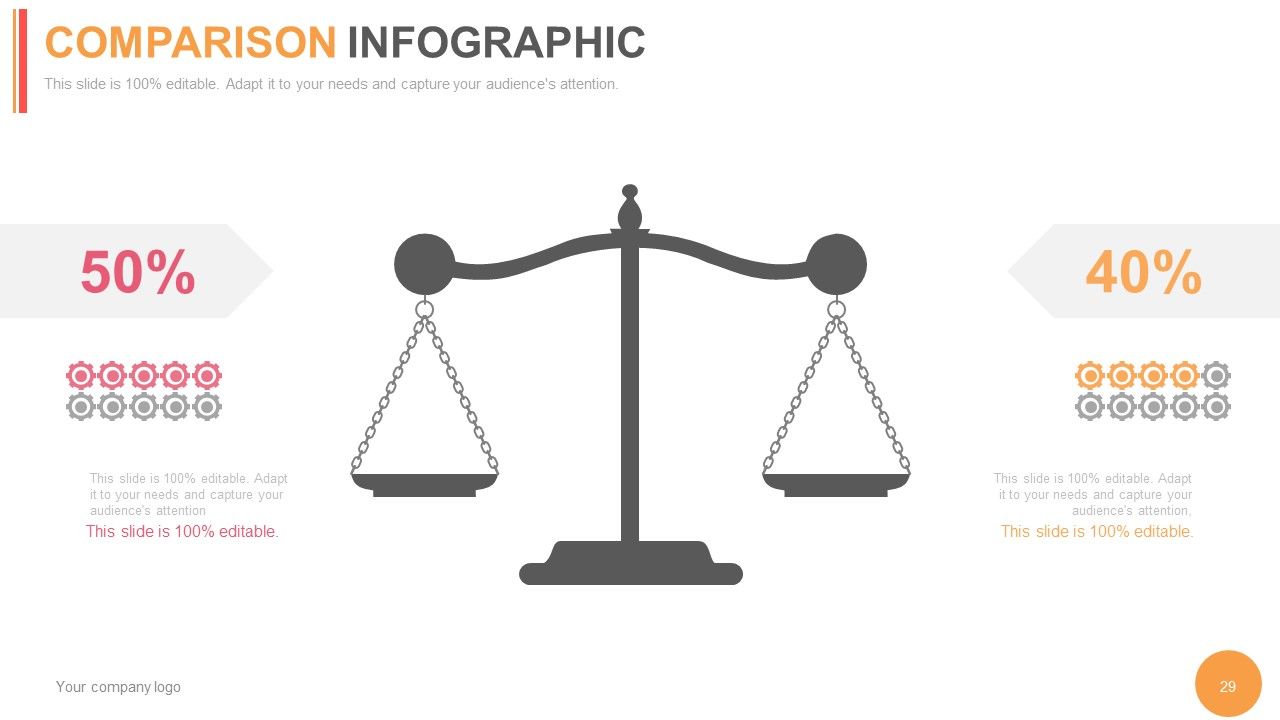
Slide 29: This slide presents a Comparison Infographic as balance scale image to show comparison.
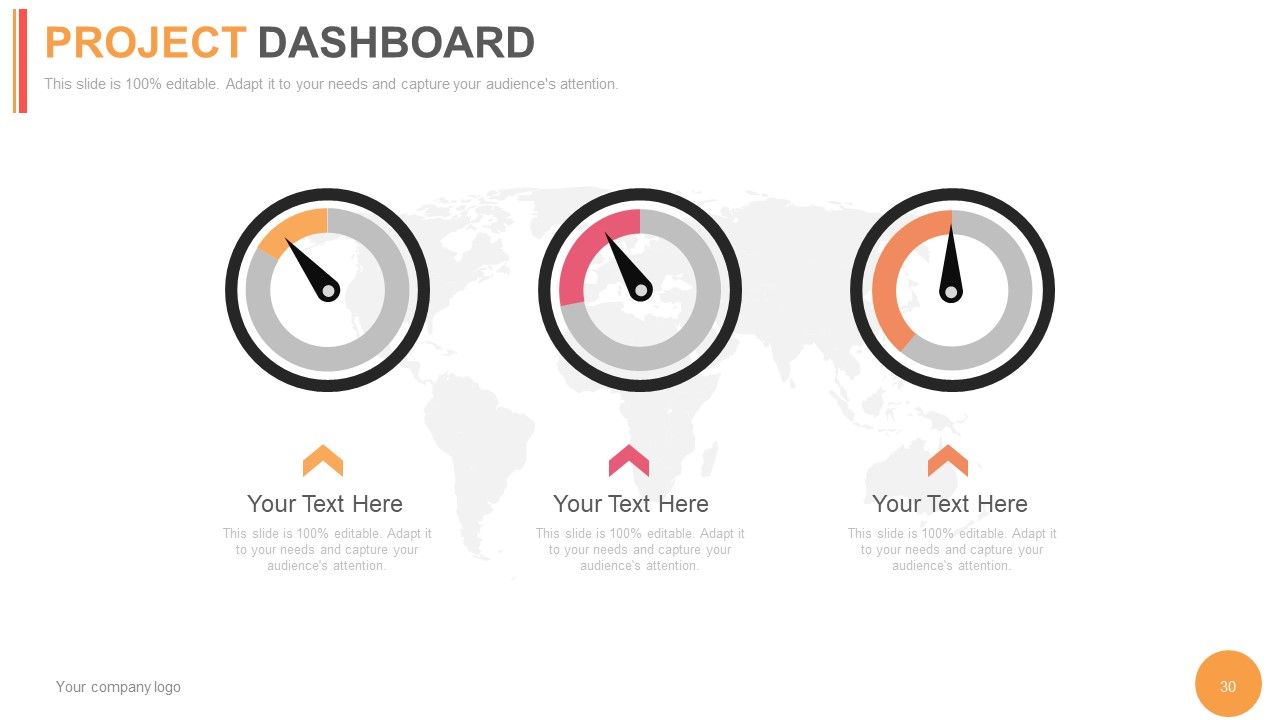
Slide 30: This slide presents a Project Dashboard. State KPI, metrics etc. here.
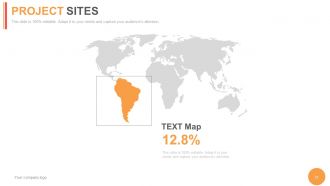
Slide 31: This slide presents Project Sites to show company specific project.
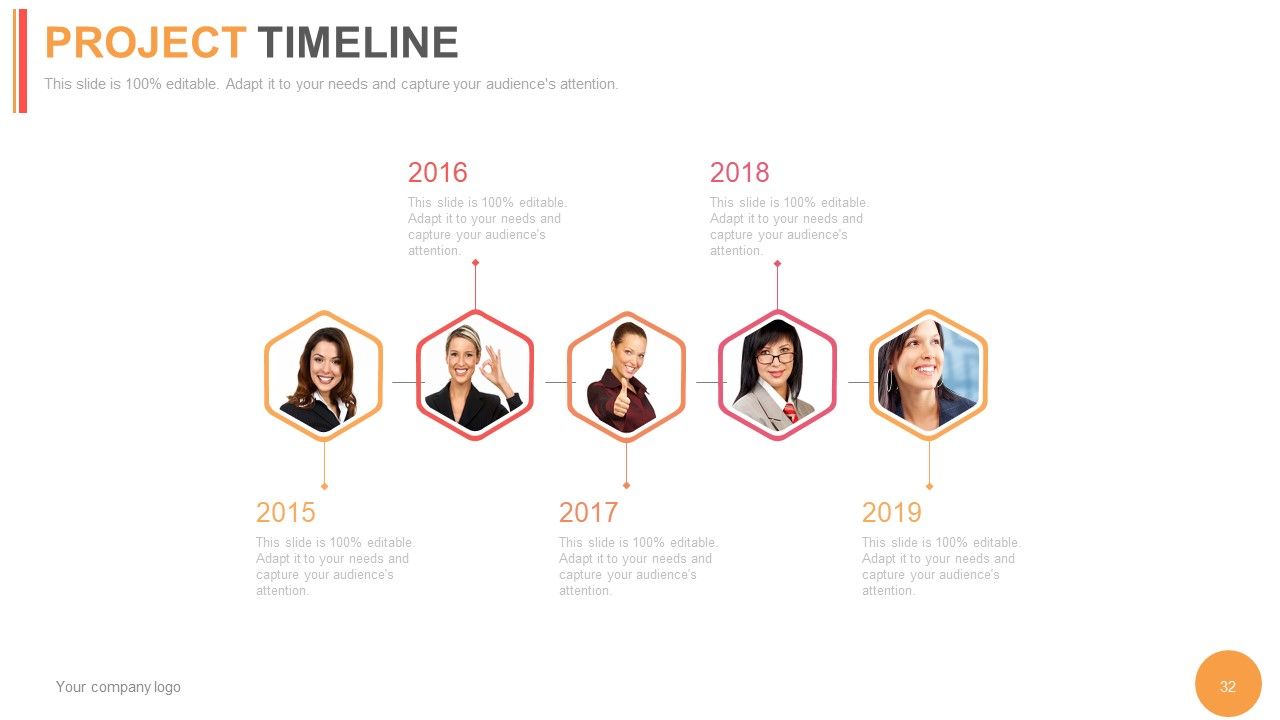
Slide 32: This slide showcases a Project Timeline to show milestones, important highlights etc.
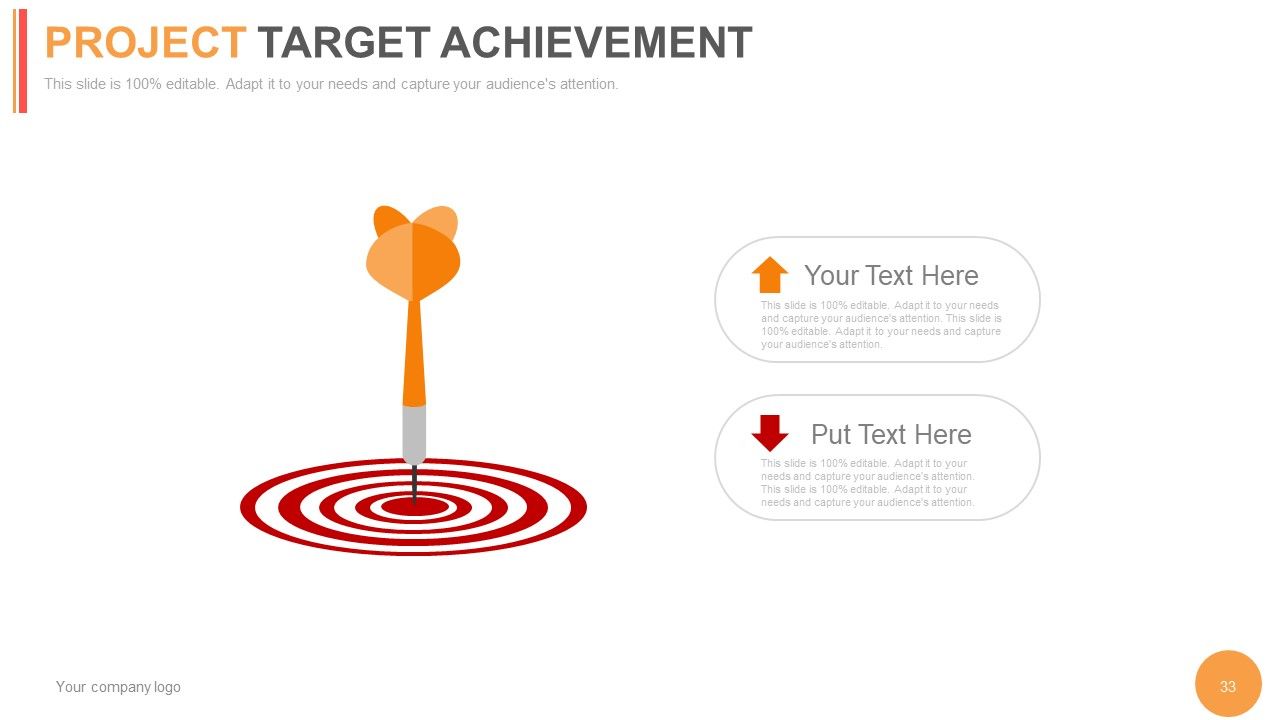
Slide 33: This slide showcases Project Target Achievement to state target, goals etc.
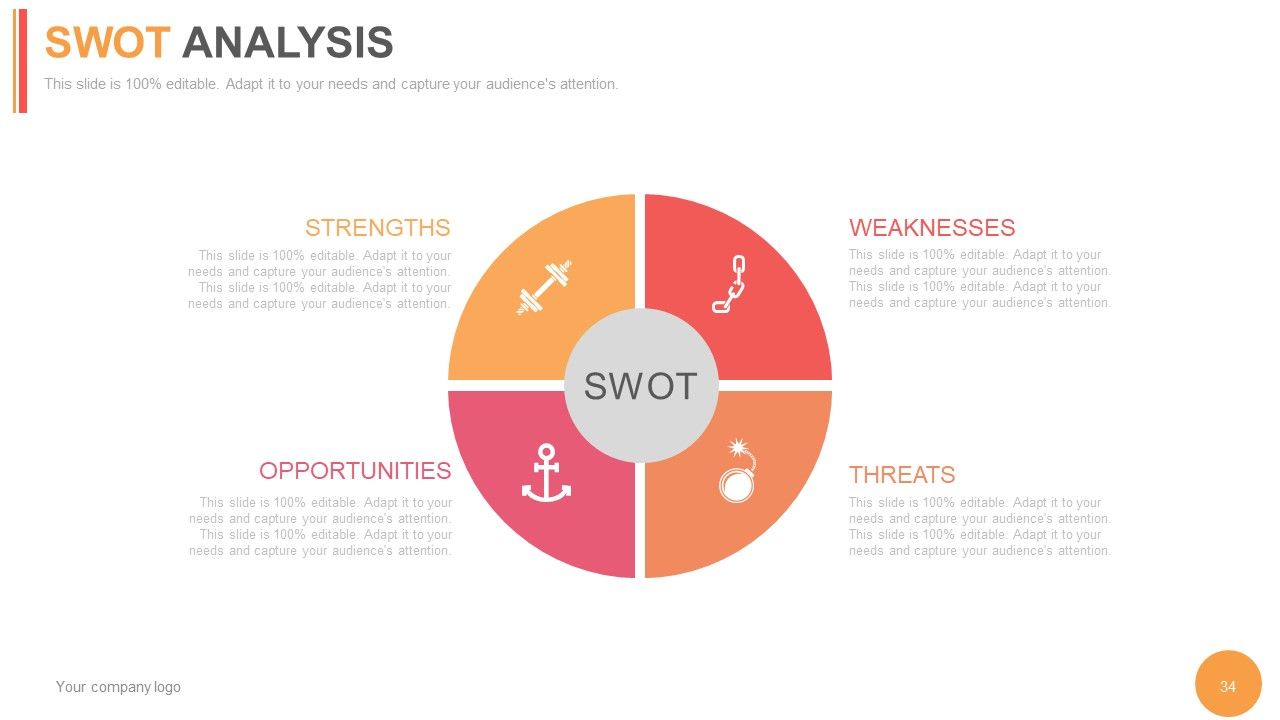
Slide 34: This slide presents a SWOT anslysis.
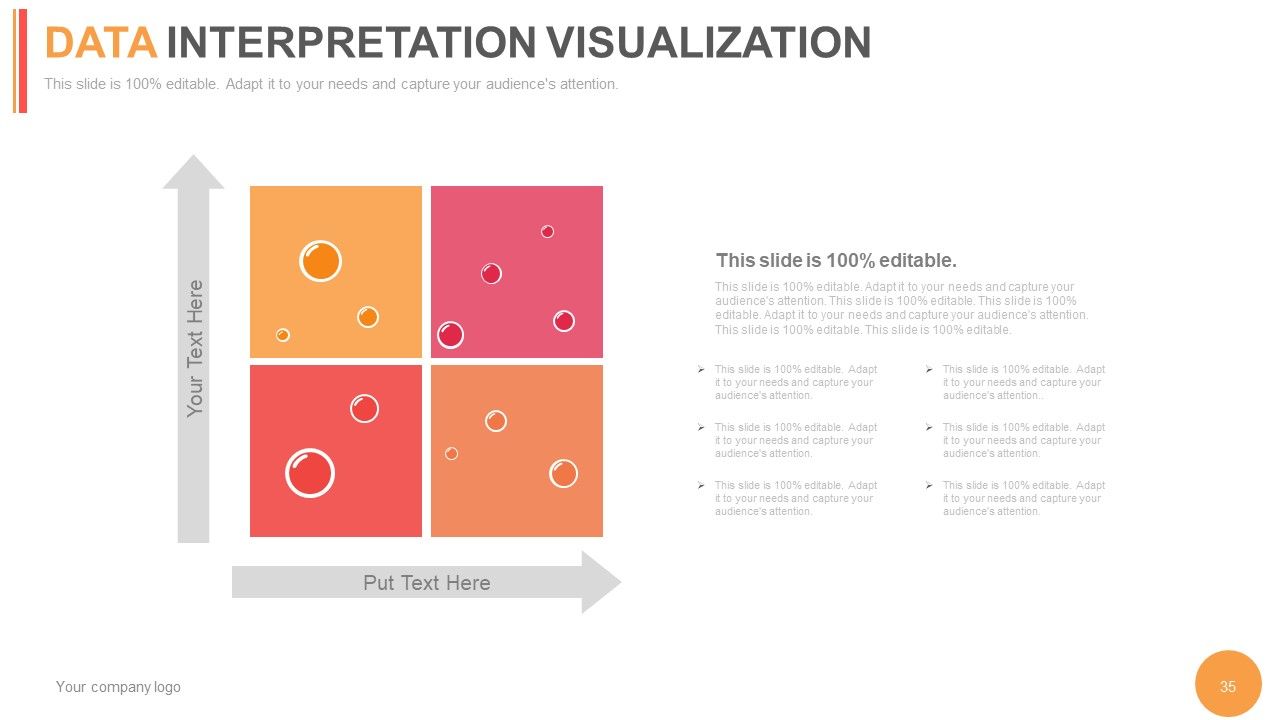
Slide 35: This slide showcases Data Interpretation Visualization matrix.
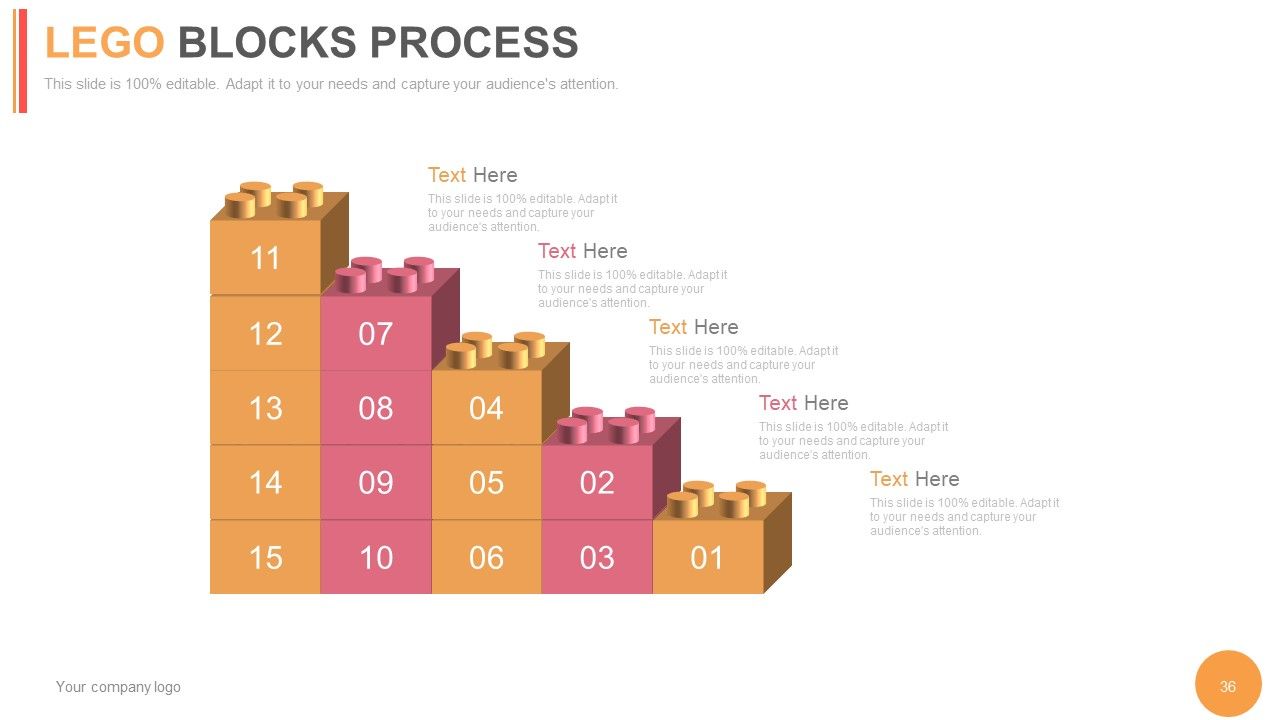
Slide 36: This slide presents Lego Blocks Process. State information etc. here.
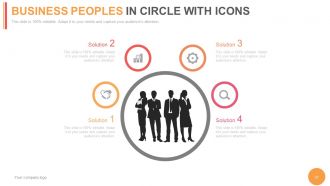
Slide 37: This slide presents Business People In Circle With Icons. Use this silhouette image as per need.
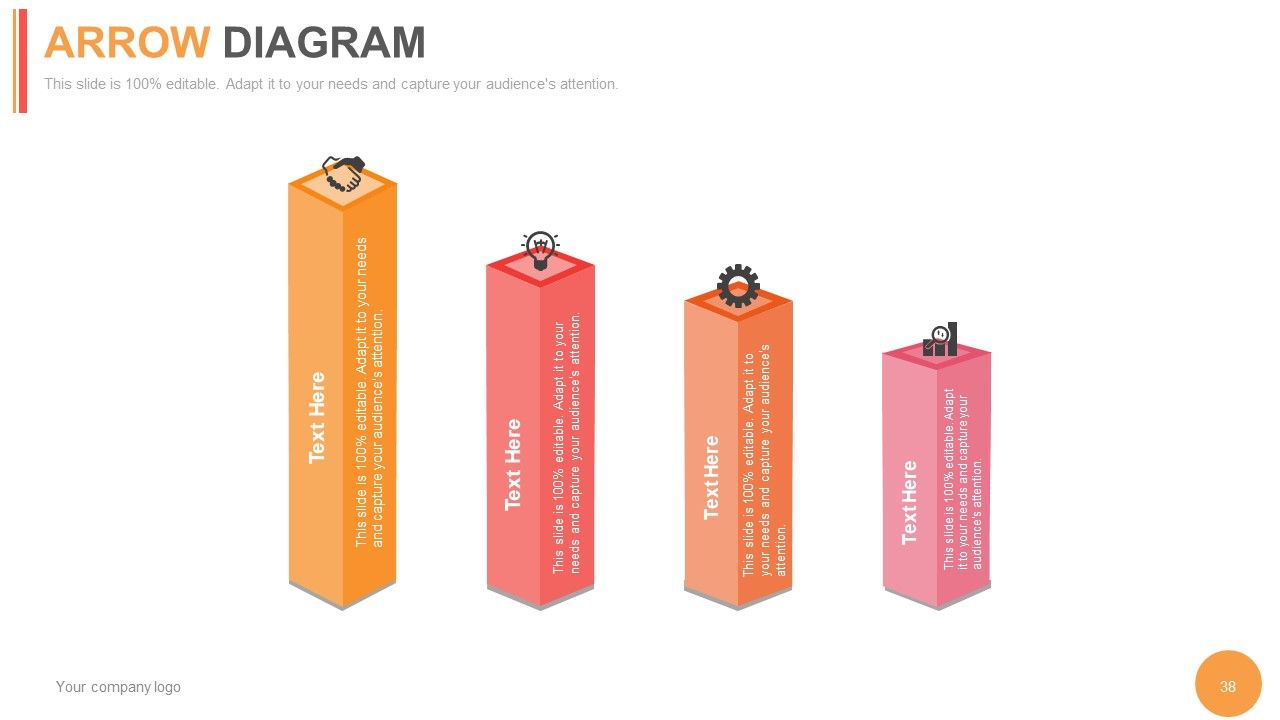
Slide 38: This slide shows an Arrow Diagram.
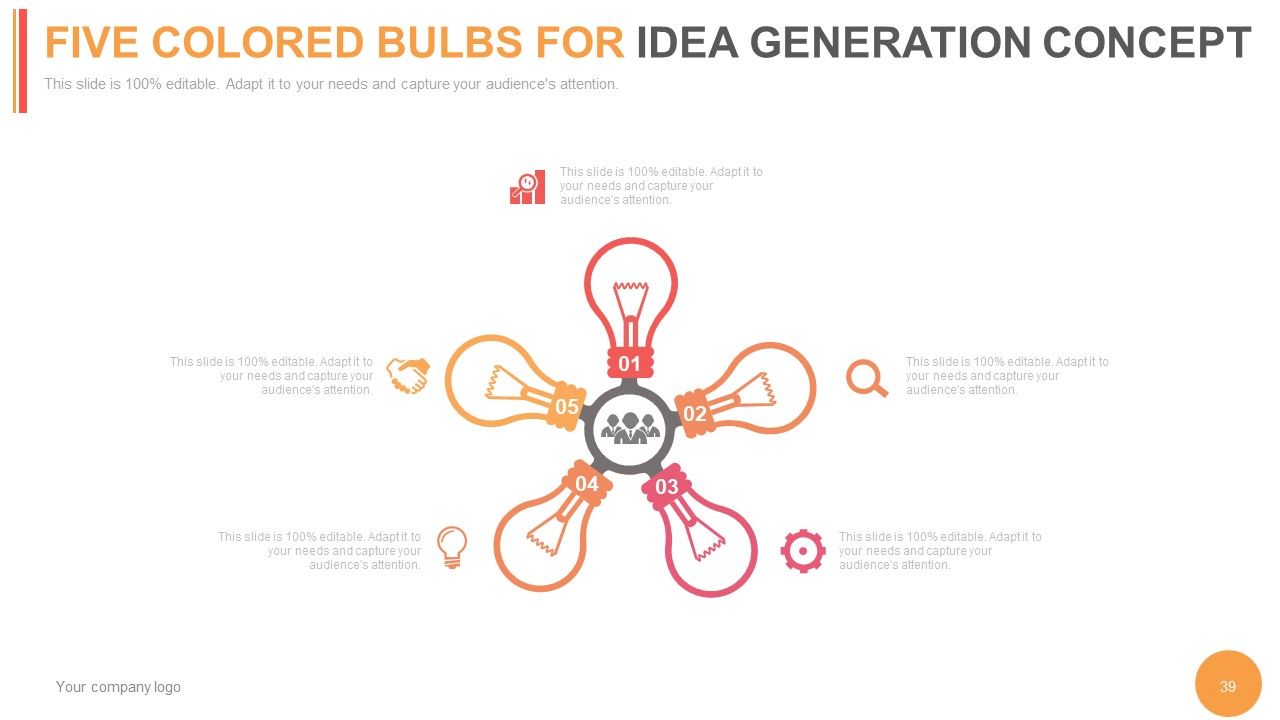
Slide 39: This slide presents Five Colored Bulbs For Idea Generation Concept.
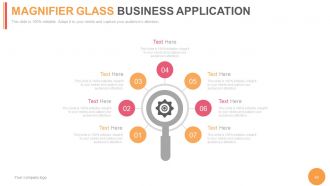
Slide 40: This slide presents Magnifier Glass Business Application to show information, specifications tc.
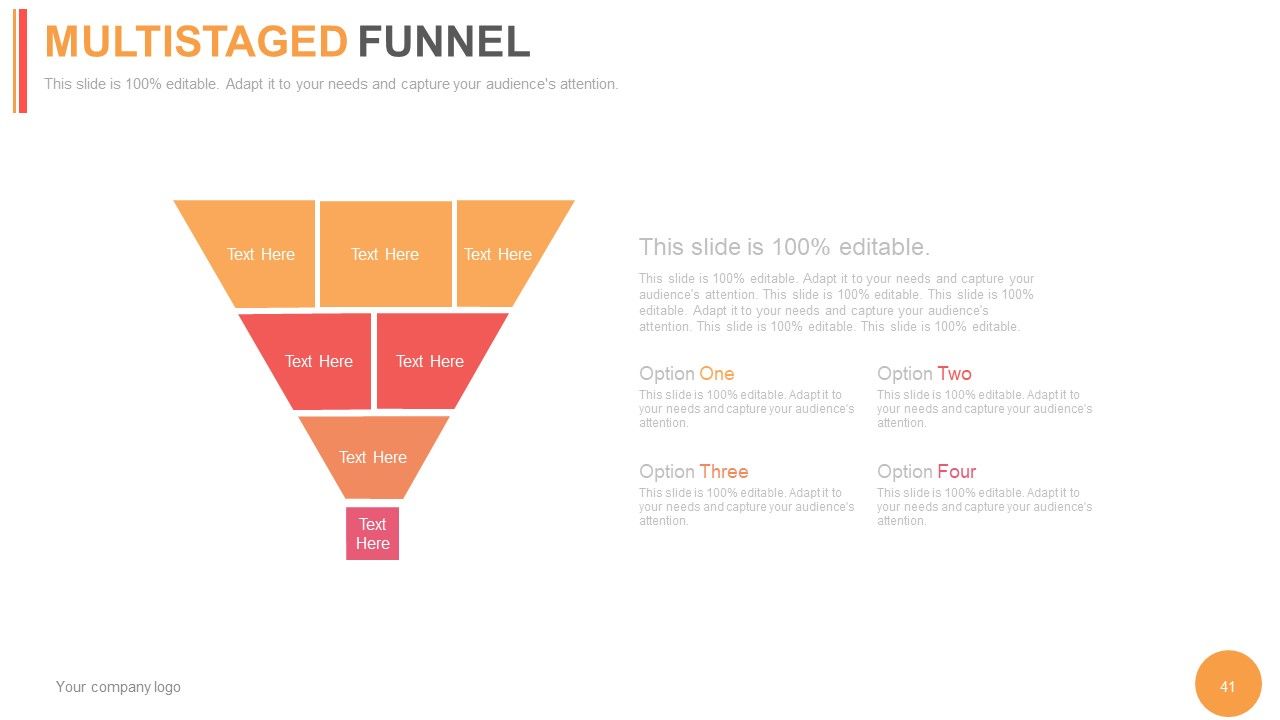
Slide 41: This slide shows a Multistaged Funnel to present information, data in funnel form.
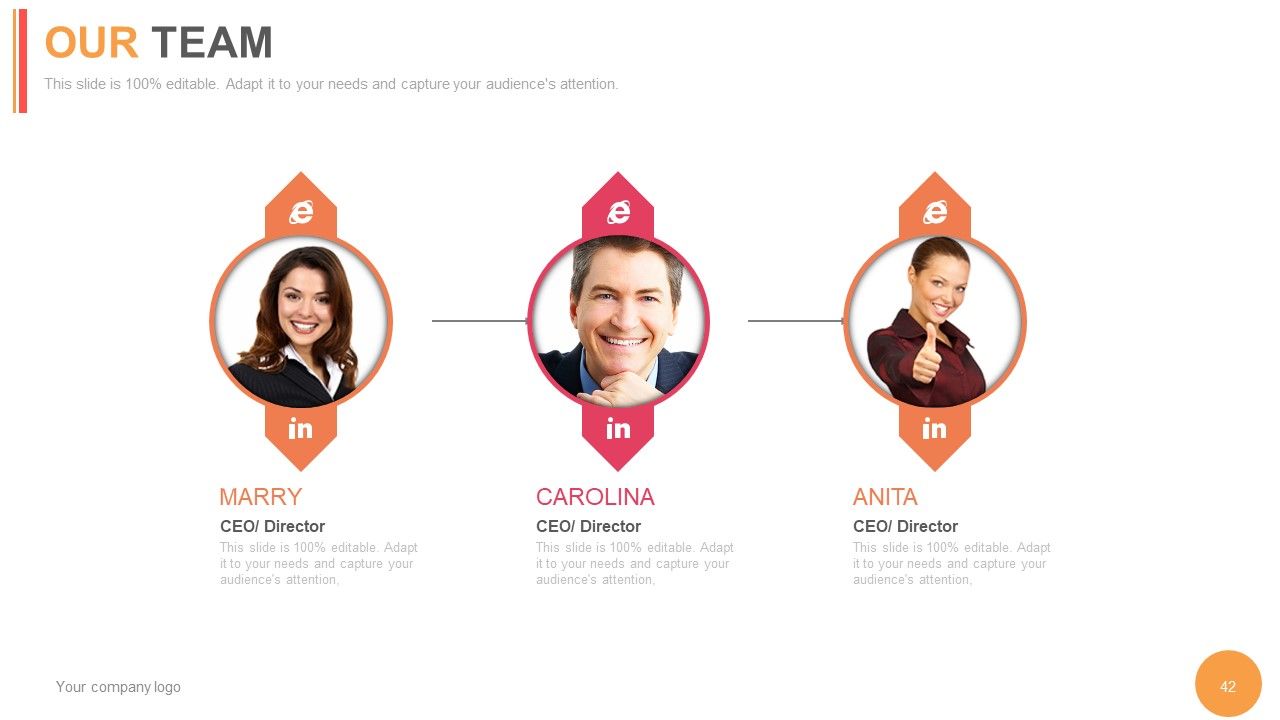
Slide 42: This is Our Team slide with name, designation, image & text boxes.
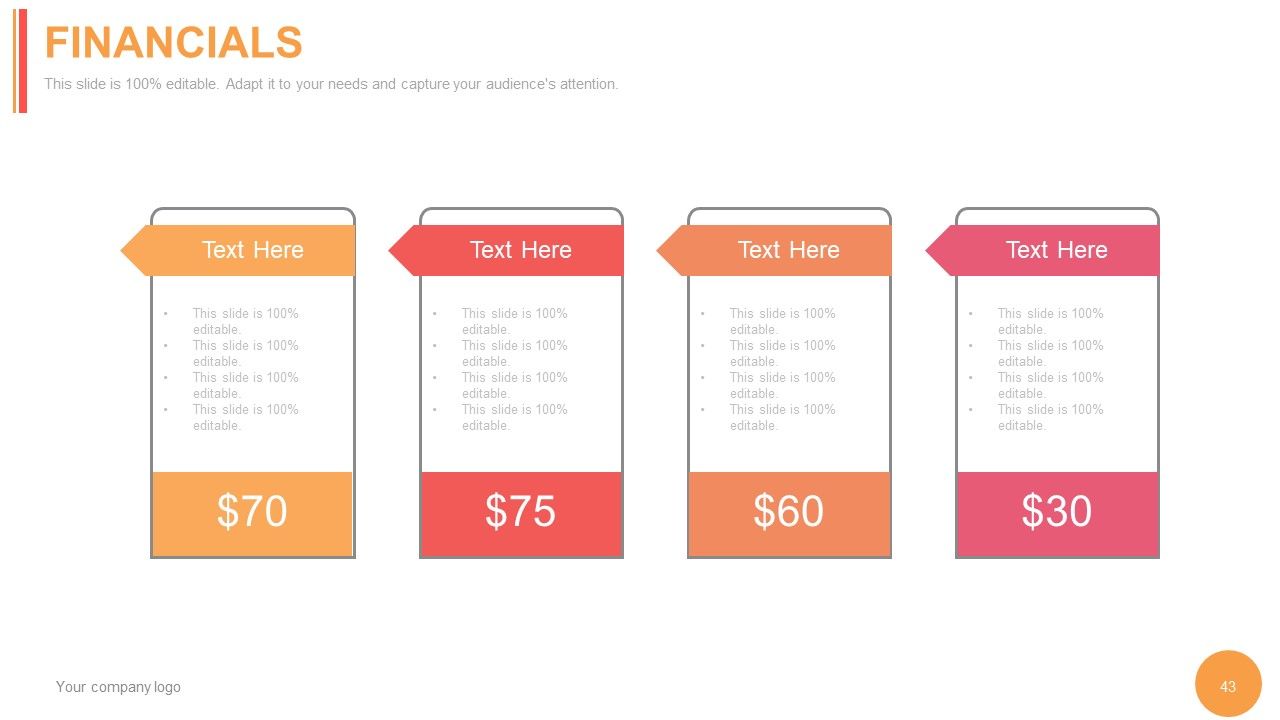
Slide 43: This slide showcases Financial scores slide. State financial aspects etc. here.
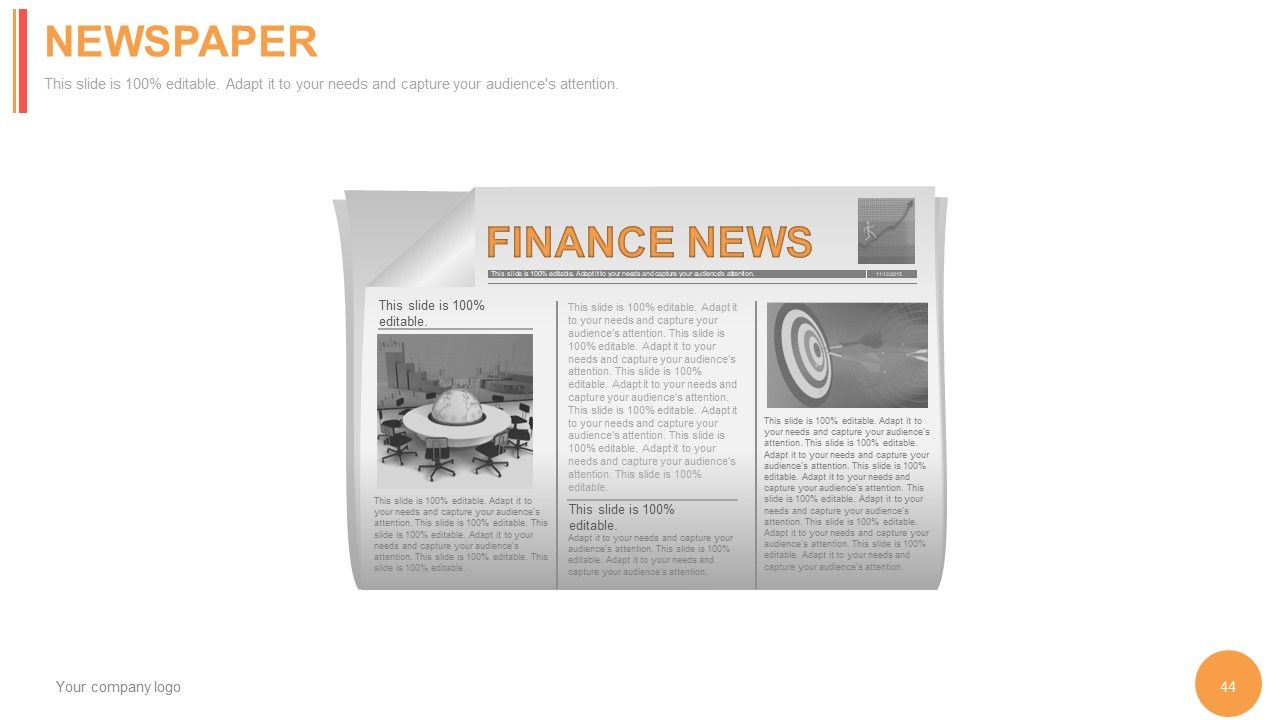
Slide 44: This slide showcases NewsPaper to show company news, event etc. You can change the slide content as per need.
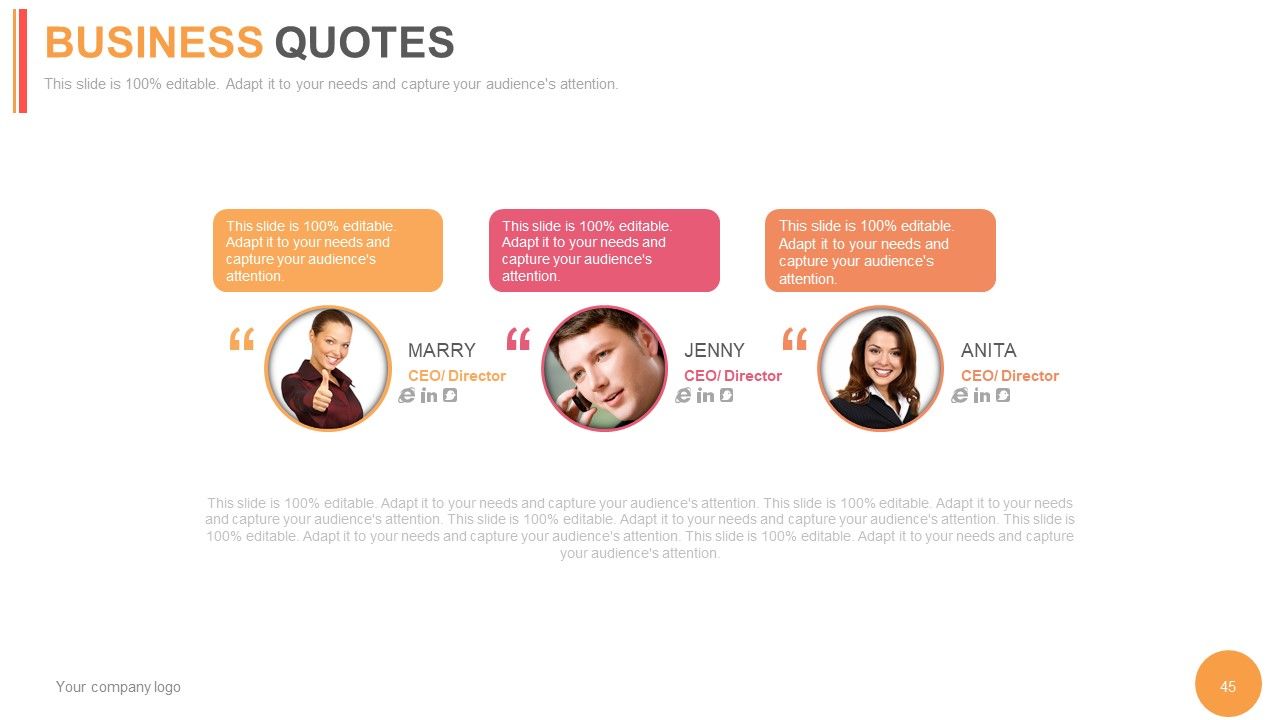
Slide 45: This slide presents Business Quotes to convey company beliefs, messages etc.
Slide 46: This is a Thank You slide for acknowledgement.
Project product management status powerpoint presentation with slides with all 46 slides:
If you need ideas to create the most appealing presentations that could lead to that once in a lifetime opportunity make use of our premade PowerPoint Templates and Slides. You are free to edit it as you wish.
FAQs
The Project Health Card is used to showcase the benefits, issues, schedule, resourcing, budget, and risks associated with the project in a summarized form.
Both variations of Project Progress Summary present the project's progress in terms of months, but they may differ in their format or layout.
A Gantt chart is a bar chart used in project management to illustrate a project's schedule. It shows the start and end dates of project activities and the dependencies between them.
SWOT analysis is a strategic planning tool used to identify the strengths, weaknesses, opportunities, and threats of a project or a company. It helps in understanding the project's internal and external factors and creating strategies to address them.
The Project Dashboard is used to monitor and track project progress and performance. It provides a visual representation of key performance indicators (KPIs) and metrics, enabling project managers to make informed decisions and take corrective actions when necessary.
-
Excellent products for quick understanding.
-
Unique research projects to present in meeting.


