Quality control engineering setting acceptable product quality level benchmark ppt graph charts
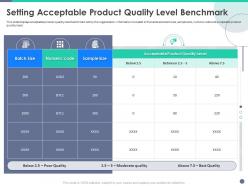
This slide displays acceptable product quality level benchmark set by the organization. information included in the table are batch size, sample size, numeric code and acceptable product quality level.
You must be logged in to download this presentation.
PowerPoint presentation slides
This slide displays acceptable product quality level benchmark set by the organization. information included in the table are batch size, sample size, numeric code and acceptable product quality level. Deliver an outstanding presentation on the topic using this Quality Control Engineering Setting Acceptable Product Quality Level Benchmark Ppt Graph Charts. Dispense information and present a thorough explanation of Setting Acceptable Product Quality Level Benchmark using the slides given. This template can be altered and personalized to fit your needs. It is also available for immediate download. So grab it now.
People who downloaded this PowerPoint presentation also viewed the following :
Quality control engineering setting acceptable product quality level benchmark ppt graph charts with all 2 slides:
Use our Quality Control Engineering Setting Acceptable Product Quality Level Benchmark Ppt Graph Charts to effectively help you save your valuable time. They are readymade to fit into any presentation structure.
-
Presentation Design is very nice, good work with the content as well.
-
Illustrative design with editable content. Exceptional value for money. Highly pleased with the product.


