Quarterly Business Review Meeting Summary
Try Before you Buy Download Free Sample Product
Audience
Editable
of Time
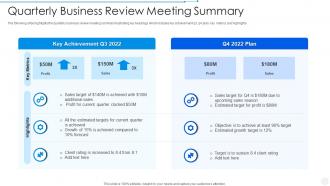
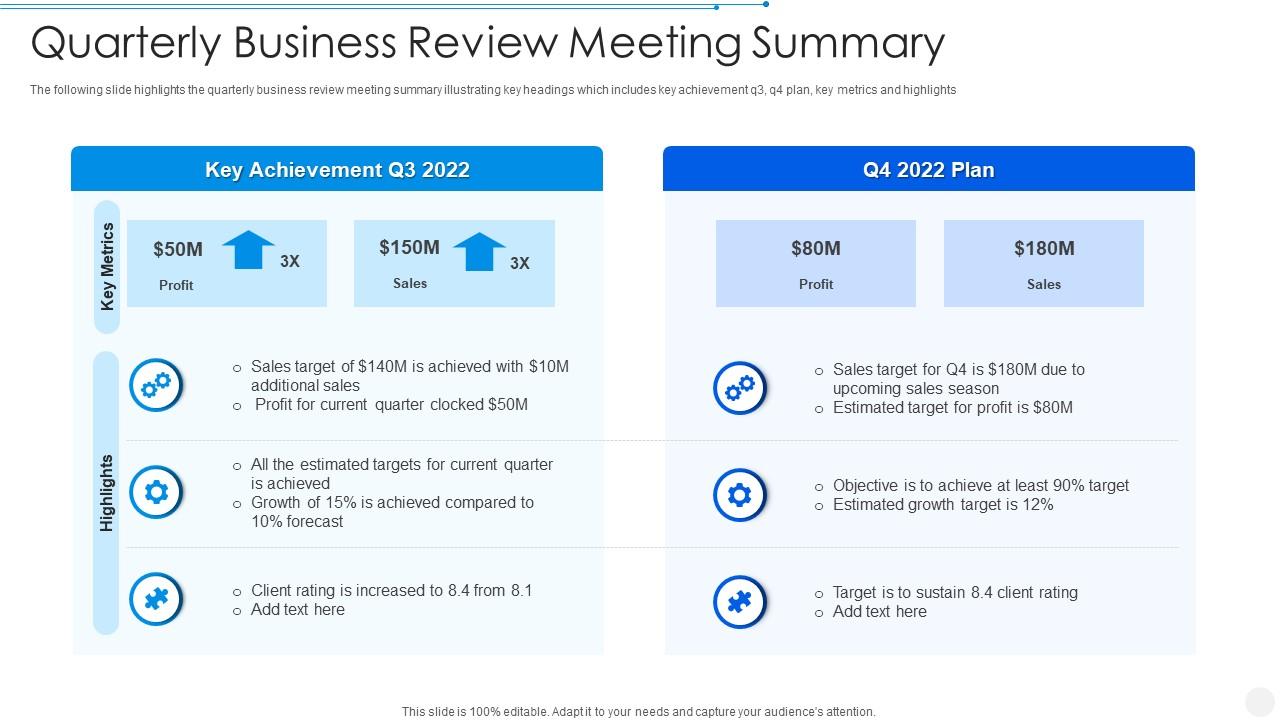
The following slide highlights the quarterly business review meeting summary illustrating key headings which includes key achievement q3, q4 plan, key metrics and highlights
People who downloaded this PowerPoint presentation also viewed the following :
Quarterly Business Review Meeting Summary with all 6 slides:
Use our Quarterly Business Review Meeting Summary to effectively help you save your valuable time. They are readymade to fit into any presentation structure.
FAQs for Quarterly Business
Focus on the big four: revenue, customer stuff, operations, and strategy progress. Break revenue down by segment and track acquisition/retention rates plus churn. Burn rate and headcount changes matter too - execs eat that stuff up when the trends look good. Year-over-year comparisons are your friend here. Honestly, the forecasting piece for next quarter is probably what they care about most. Each metric should connect back to your goals so it actually tells a story instead of being random numbers. Oh, and definitely prep explanations for any weird variances beforehand.
Honestly, visuals will save your QBR from being a total slog. Nobody wants to stare at spreadsheets for an hour - charts and graphs actually make the data make sense. People can spot trends and problems right away instead of getting lost in numbers. Bar charts work great for comparisons, line graphs for showing changes over time. Heat maps are clutch for team performance stuff. The trick is matching the right visual to what you're trying to show. I'd start simple though - you don't need to go crazy with fancy dashboards right off the bat. Your audience will thank you for not making them do math in their heads.
So for your QBR prep, grab metrics that actually connect to your quarterly goals - revenue numbers, customer acquisition, the big KPIs. Skip the data dump approach (those 50-slide presentations are brutal for everyone). Clean everything beforehand and double-check accuracy because wrong numbers will tank your credibility instantly. Show clear before/after comparisons so people can see what's working and what isn't. Oh, and prep some talking points for any weird trends or dips. You don't want to be scrambling for explanations when someone inevitably asks about that random spike in March.
Honestly, the real work happens way before you step into that room. Send out your team's goals like 2-3 weeks early, then set up smaller meetings with the key people to work through any disagreements. Trust me, you don't want to be negotiating priorities during the actual QBR - that's awkward for everyone. Get leadership to sign off on how your stuff connects to company goals beforehand. I learned this the hard way last year. Walk in knowing everyone's already aligned so you can actually talk about execution instead of arguing about what you should even be doing.
Honestly, stakeholder feedback makes or breaks your QBR. Without it, you're just presenting stuff you think matters while everyone's mentally checking out. Get their input beforehand - like a week early - so you can actually weave their concerns into your presentation. Nobody wants to sit through metrics that feel irrelevant to their world. Their feedback catches things you'd totally miss otherwise and keeps you focused on actual problems instead of vanity metrics. Plus it validates whether you're even prioritizing the right stuff. Trust me, it's the difference between a useful meeting and corporate theater.
Definitely throw some competitive analysis into your QBR - it's a game changer for spotting what you're missing. I like comparing the obvious stuff: market share, pricing, how they're snagging customers. Honestly, seeing it all laid out side by side can be pretty brutal but super helpful. Look for those gaps where competitors are eating your lunch, then turn those findings into actual next-quarter moves. Way better than just staring at your own numbers in a vacuum. Your QBR gets so much more strategic when you're tracking where you stand against everyone else.
Ugh, don't cram every metric onto your slides - I've been in meetings where people just read spreadsheets for an hour. Pick maybe 3-4 big themes instead of showing everything. Tell a story, not just "revenue went up 12%." Explain WHY things happened and what you're actually gonna do about it. Those cookie-cutter templates are the worst too. Oh, and end with real action items, not that "we'll keep monitoring" BS that means nothing. People zone out fast when it's just data dumps.
Dude, turn your QBR into actual stories instead of just throwing charts at people. Start with the challenge, then what you did about it, then boom - results. Like instead of "revenue went up 15%," say "Company X had this massive problem, we fixed it, and that's why we grew 15% in Q3." Executives eat that stuff up way more than spreadsheets - trust me on this one. Hook them right away with a killer customer quote or something surprising about the market. Structure it like beginning/middle/end for each section. Customer success stories work great as proof too. Way more memorable than boring data dumps.
Okay so for QBRs with heavy data, think visual storytelling. Start big picture with exec summary dashboards, then get into the weeds with detailed charts. I do this "so what?" test on every slide - honestly, nobody wants to sit there decoding numbers forever. Keep it to 3-4 key metrics max per slide, use the same colors throughout, and throw in trend lines or quarter-over-quarter comparisons so people can actually follow the story you're telling. The real trick? End each section with what it means and what you're gonna do about it. That's what the bosses actually want to hear anyway.
Honestly? Every 6-12 months, or when big stuff changes in your business. I've watched teams (including mine, oops) use the exact same boring format for literally years. New products launching? Different markets? Your audience shifts? Time to switch it up. Nothing major happening? Still do a quick check twice a year - just ask people what's actually useful versus what makes them want to scroll their phones. The whole point is giving stakeholders what they need from these meetings instead of just... existing, I guess. Don't be the person who runs QBRs on autopilot forever.
Hey! So definitely lead with hard numbers - like "Customer X cut processing time by 40%, saved $200K." That stuff lands way better than generic success stories. Got any customer quotes? Executives eat that up honestly. I'd structure each one as: problem they had, what you did, actual results with metrics. Charts or screenshots help too if you can swing it. Oh and don't spread yourself thin - better to nail 2-3 really solid stories than ramble through a bunch of mediocre ones. Quality over quantity here.
Honestly, good dashboard tools will save your life here. Tableau or Power BI can auto-generate those metric visualizations instead of you manually building charts in PowerPoint like some kind of masochist. I've been there - never again. Notion or Monday.com are clutch for tracking action items without drowning in email threads. Your presentation itself? Prezi keeps people way more engaged than boring static slides. Just pick whatever's eating up most of your time right now and find one tool to fix that first. You'll probably cut prep time in half, maybe more.
QBRs work because they put everyone's numbers out there for all to see. No more hiding behind those "making good progress" updates that mean nothing. Honestly, it's pretty uncomfortable at first but that discomfort is what makes people actually deliver. The quarterly timing is perfect too - gives folks enough time to make real changes without letting things drag on forever. When you connect individual work to company goals, suddenly people get why their stuff matters. Oh and definitely walk out with clear action items and deadlines, otherwise you're just wasting time in another meeting.
So for your QBR, carve out a whole section for what's coming next - don't just rehash old numbers. Research industry reports and what competitors are doing, plus any new tech that might shake things up in the next 6-12 months. Honestly, I always get sucked into this part because it's way more fun than spreadsheets! Build out 2-3 scenarios: best case, worst case, most likely. Here's the thing though - you gotta tie these predictions to actual next steps. Budget changes, new projects, whatever. Otherwise you're just making fancy guesses that nobody acts on.
Templates will save your sanity, trust me. Create 3-4 core slide layouts that everyone can use - same chart styles, same data formats, all that good stuff. Your stakeholders won't have to hunt around for info because everything's in the same spot every quarter. Flexible enough for different teams but structured enough that you're not rebuilding presentations from zero each time. I learned this the hard way after way too many late nights reformatting slides. Once you've got solid templates down, QBRs become so much smoother.
-
Loved the fact that SlideTeam provides clean, high-definition, and professional PowerPoint products.Â
-
Innovative and Colorful designs.