Relative market share cash generation powerpoint presentation slide template
Affordable high quality Relative Market Share Cash Generation Powerpoint Presentation Slide Template are available in thousands of styles. Suited for every presentation need.
Affordable high quality Relative Market Share Cash Generation Powerpoint Presentation Slide Template are available in thous..
- Google Slides is a new FREE Presentation software from Google.
- All our content is 100% compatible with Google Slides.
- Just download our designs, and upload them to Google Slides and they will work automatically.
- Amaze your audience with SlideTeam and Google Slides.
-
Want Changes to This PPT Slide? Check out our Presentation Design Services
- WideScreen Aspect ratio is becoming a very popular format. When you download this product, the downloaded ZIP will contain this product in both standard and widescreen format.
-

- Some older products that we have may only be in standard format, but they can easily be converted to widescreen.
- To do this, please open the SlideTeam product in Powerpoint, and go to
- Design ( On the top bar) -> Page Setup -> and select "On-screen Show (16:9)” in the drop down for "Slides Sized for".
- The slide or theme will change to widescreen, and all graphics will adjust automatically. You can similarly convert our content to any other desired screen aspect ratio.
Compatible With Google Slides

Get This In WideScreen
You must be logged in to download this presentation.
PowerPoint presentation slides
We are proud to present our relative market share cash generation powerpoint presentation slide template. Our Relative Market Share Cash Generation Powerpoint Presentation Slide Template Power Point Templates Provide The Links In Your Chain Of Thought. Once Intertwined They Enhance The Strength Of Your Words. Our Relative Market Share Cash Generation Powerpoint Presentation Slide Template Power Point Templates Are Like Ingredients In Your Recipe Of Success. Stir Them Together And Get People Licking Their Lips. Perfect for presentations on Relative Market Share Cash Generation, Market Growth Rate, High, Low, Market Growth Rate, Cash Usage, High, Low, Stars, Question Marks, Cash Cows, Dogs.
People who downloaded this PowerPoint presentation also viewed the following :
Content of this Powerpoint Presentation
Description:
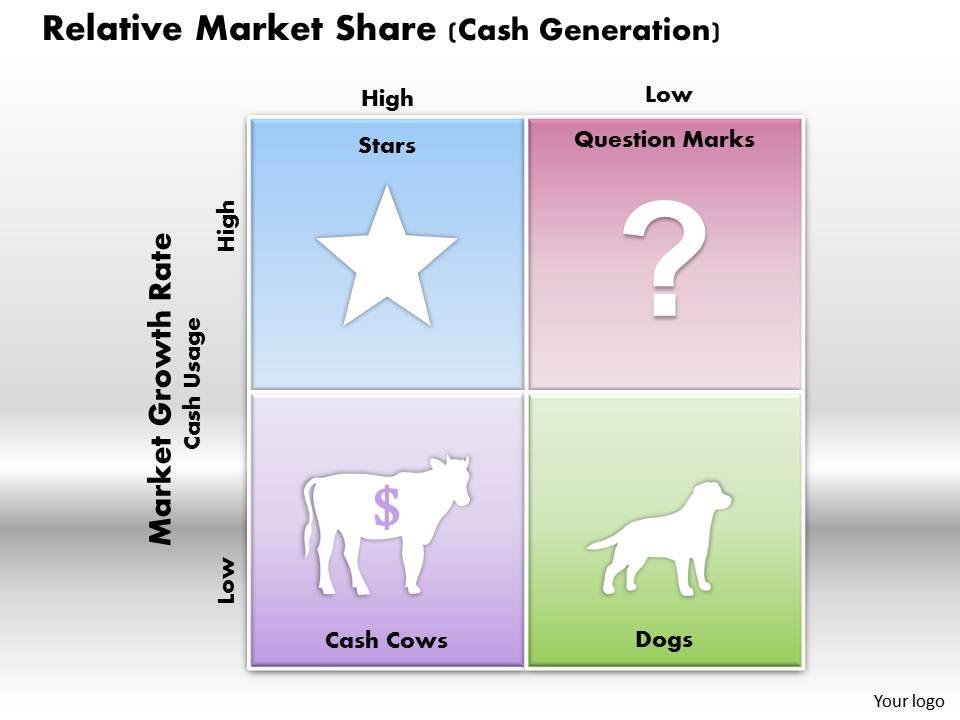
The image is a PowerPoint slide illustrating the Boston Consulting Group (BCG) Matrix, a strategic business tool used to analyze a company's product portfolio based on relative market share and market growth rate, which are indicative of cash usage and generation. The matrix is divided into four quadrants:
1. Stars (Top Left Quadrant):
High market growth rate, high relative market share. Products in this category have the best market position and are expected to generate significant revenues and profits. They require continued investment to maintain their market position.
2. Question Marks (Top Right Quadrant):
High market growth rate, low relative market share. These products have potential but may require substantial investment to increase their market share.
3. Cash Cows (Bottom Left Quadrant):
Low market growth rate, high relative market share. These are mature, successful products with less need for investment. They generate more cash than is needed to maintain market share.
4. Dogs (Bottom Right Quadrant):
Low market growth rate, low relative market share. Products in this category typically generate low profits or may even incur losses. They are often considered for divestiture.
5. Each quadrant has an icon representing its category:
a star, a question mark, a cow with a dollar sign (indicating money), and a dog. There is a placeholder for a company logo at the bottom right corner.
Use Cases:
The BCG Matrix can be utilized across different industries for strategic planning and resource allocation:
1. Consumer Goods:
Use: Portfolio analysis for diverse product lines.
Presenter: Brand Manager
Audience: Marketing Team, Executives
2. Pharmaceuticals:
Use: Evaluating drug portfolio for investment decisions.
Presenter: Portfolio Manager
Audience: Investors, R&D Heads
3. Technology:
Use: Strategy planning for software products or services.
Presenter: Chief Strategy Officer
Audience: Product Managers, Development Teams
4. Automotive:
Use: Assessing the life cycle of vehicle models.
Presenter: Product Line Manager
Audience: Senior Management, Strategy Department
5. Financial Services:
Use: Determining the viability of investment products.
Presenter: Financial Analyst
Audience: Investment Committee, Clients
6. Retail:
Use: Merchandise management and shelf-space optimization.
Presenter: Merchandising Director
Audience: Category Managers, Supply Chain Partners
7. Entertainment:
Use: Analyzing profitability and investment in media content.
Presenter: Content Strategy Officer
Audience: Production Teams, Finance Department
Relative market share cash generation powerpoint presentation slide template with all 5 slides:
Gift them comfort with our Relative Market Share Cash Generation Powerpoint Presentation Slide Template. Your thoughts will make them feel completely free.
-
Excellent Designs.
-
Top Quality presentations that are easily editable.


