Revenue decline of carbonated drink company powerpoint presentation slides
Create an exceptional presentation with our revenue decline of carbonated drink company PowerPoint presentation slides. This informative profit reduction PPT deck gives the viewers an overview of the company as well as the past trends in the market. This income diminishing PowerPoint layout consists of a few slides that are solely dedicated to the problems and related recommendations for better operating efficiency. The competitive analysis of a financial year is also showcased in this return decrease creative PPT set, which focuses on the possible factors and metrics responsible for the downfall. This gain shrinkage PowerPoint bundle is extremely helpful as it displays effective strategies that can be adopted by the organization to upgrade their sales figures. Focus on research, hitting the audience's emotions, and launching healthy drinks are a few of the research areas in the slides of this dividend declination PPT set. Assimilate it immediately to ensure the upgrading of your figures.
Create an exceptional presentation with our revenue decline of carbonated drink company PowerPoint presentation slides. Thi..
- Google Slides is a new FREE Presentation software from Google.
- All our content is 100% compatible with Google Slides.
- Just download our designs, and upload them to Google Slides and they will work automatically.
- Amaze your audience with SlideTeam and Google Slides.
-
Want Changes to This PPT Slide? Check out our Presentation Design Services
- WideScreen Aspect ratio is becoming a very popular format. When you download this product, the downloaded ZIP will contain this product in both standard and widescreen format.
-

- Some older products that we have may only be in standard format, but they can easily be converted to widescreen.
- To do this, please open the SlideTeam product in Powerpoint, and go to
- Design ( On the top bar) -> Page Setup -> and select "On-screen Show (16:9)” in the drop down for "Slides Sized for".
- The slide or theme will change to widescreen, and all graphics will adjust automatically. You can similarly convert our content to any other desired screen aspect ratio.
Compatible With Google Slides

Get This In WideScreen
You must be logged in to download this presentation.
PowerPoint presentation slides
Presenting our revenue decline of carbonated drink company PowerPoint presentation slides. This PPT layout holds forty-seven slides and each slide is accessible in standard as well as wide-screen formats. It is completely editable as per your requirements and preferences as well. You can use it with Microsoft Office, Google slides and many other presentation software.
People who downloaded this PowerPoint presentation also viewed the following :
Content of this Powerpoint Presentation
Slide 1: This slide displays title i.e. 'Revenue Decline Of Carbonated Drink Company' and your Company Name.
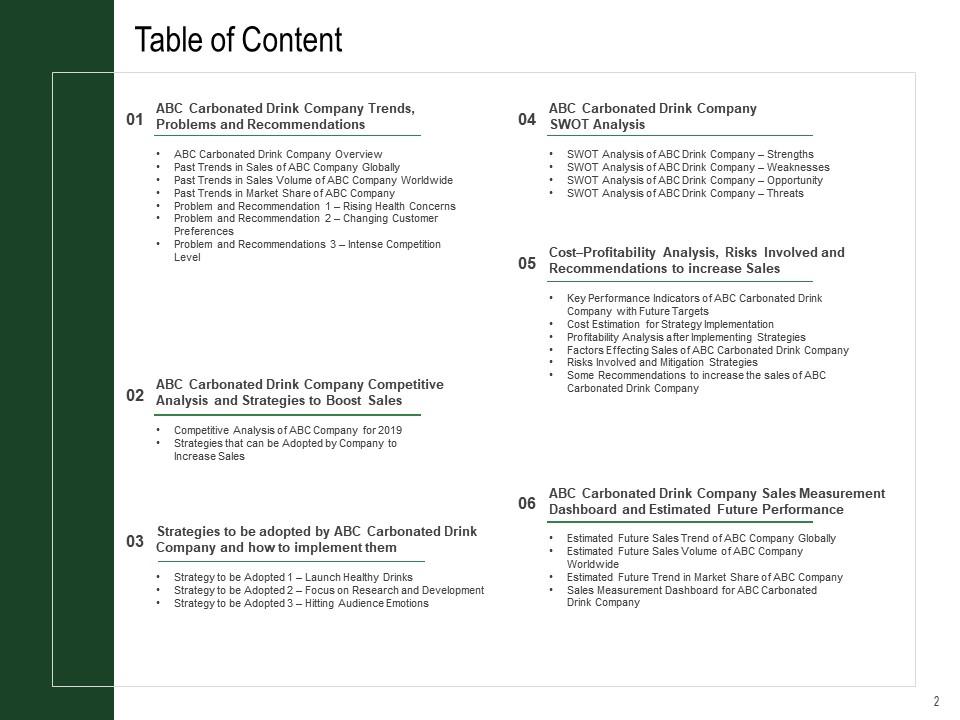
Slide 2: This slide presents table of contents.
Slide 3: This slide exhibits recommendations, problems and trends of the drink company.
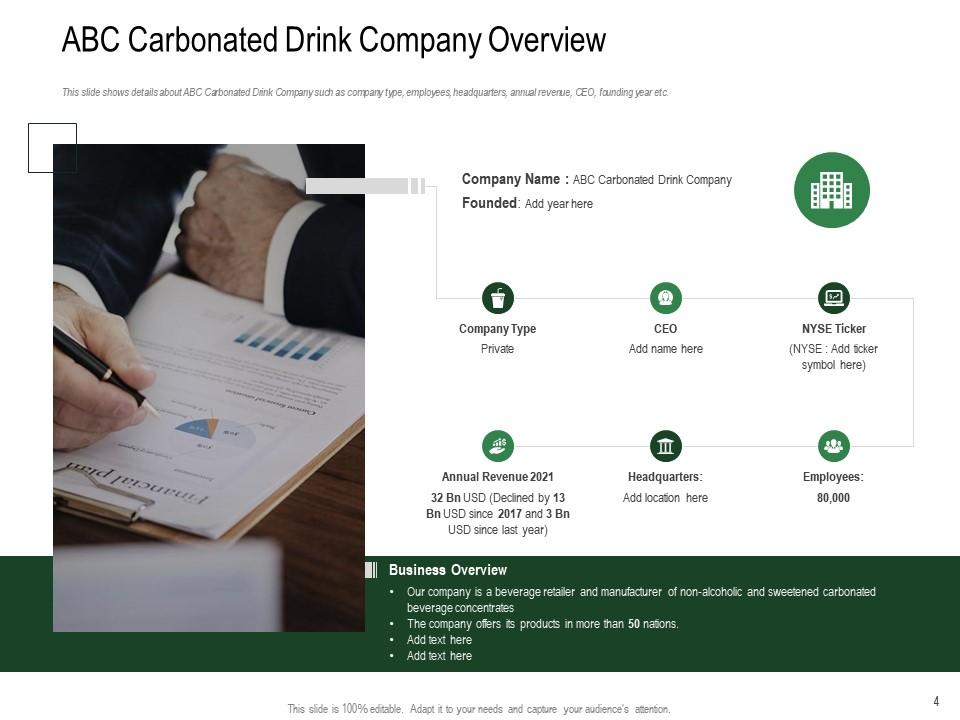
Slide 4: This slide shows details about ABC Carbonated Drink Company such as company type, employees, etc.
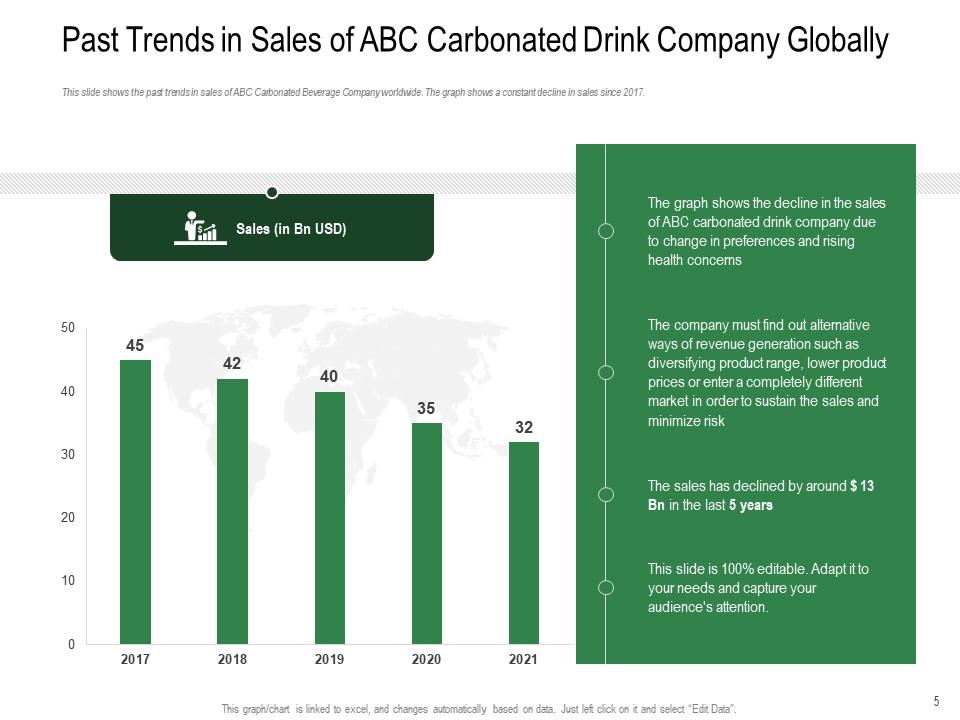
Slide 5: This slide shows the past trends in sales of ABC Carbonated Beverage Company worldwide.
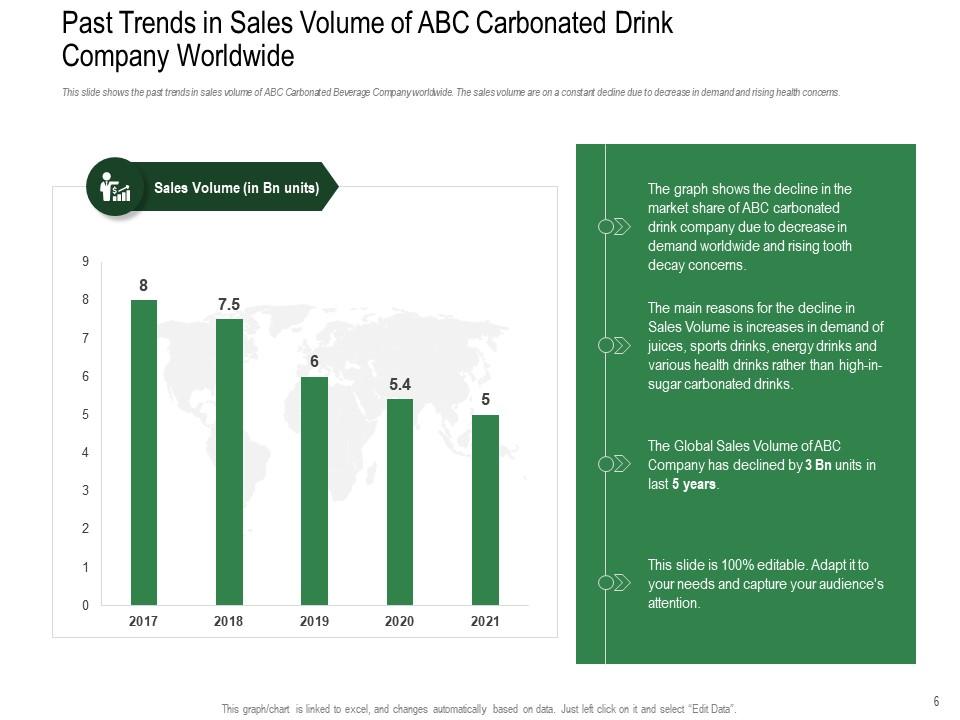
Slide 6: This slide shows the past trends in sales volume of ABC Carbonated Beverage Company worldwide.
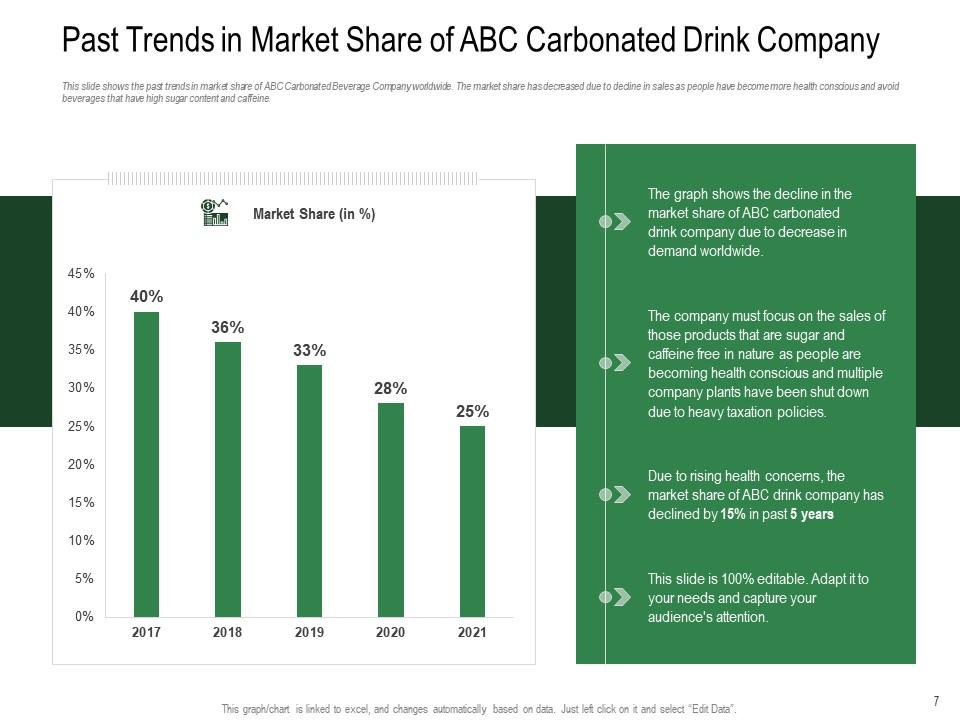
Slide 7: This slide shows the past trends in market share of ABC Carbonated Beverage Company worldwide.
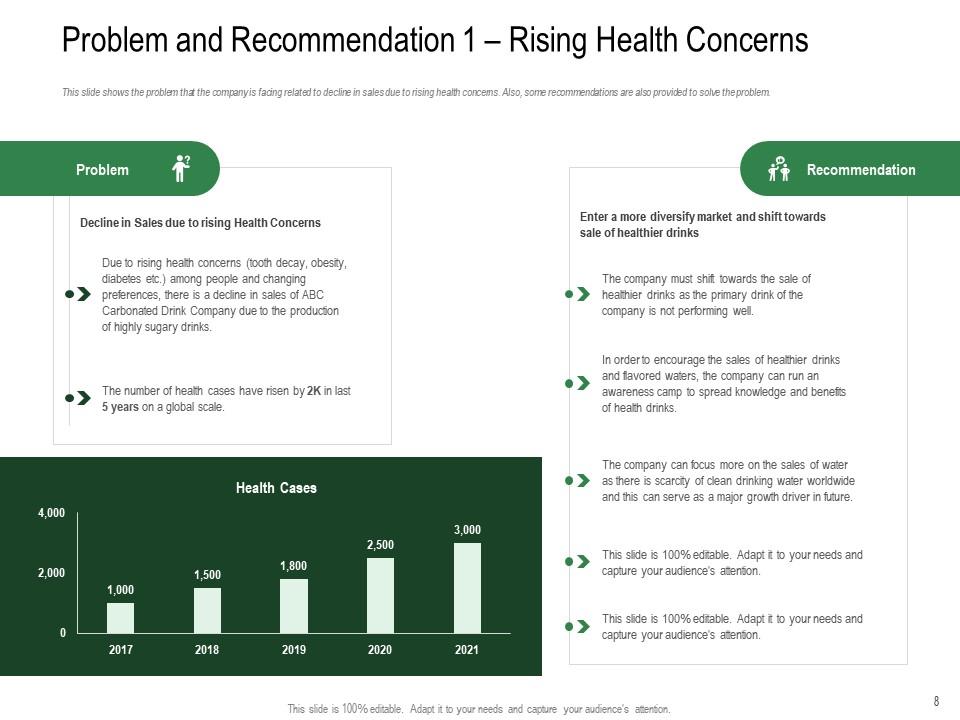
Slide 8: This slide shows the problem that the company is facing related to decline in sales due to rising health concerns.
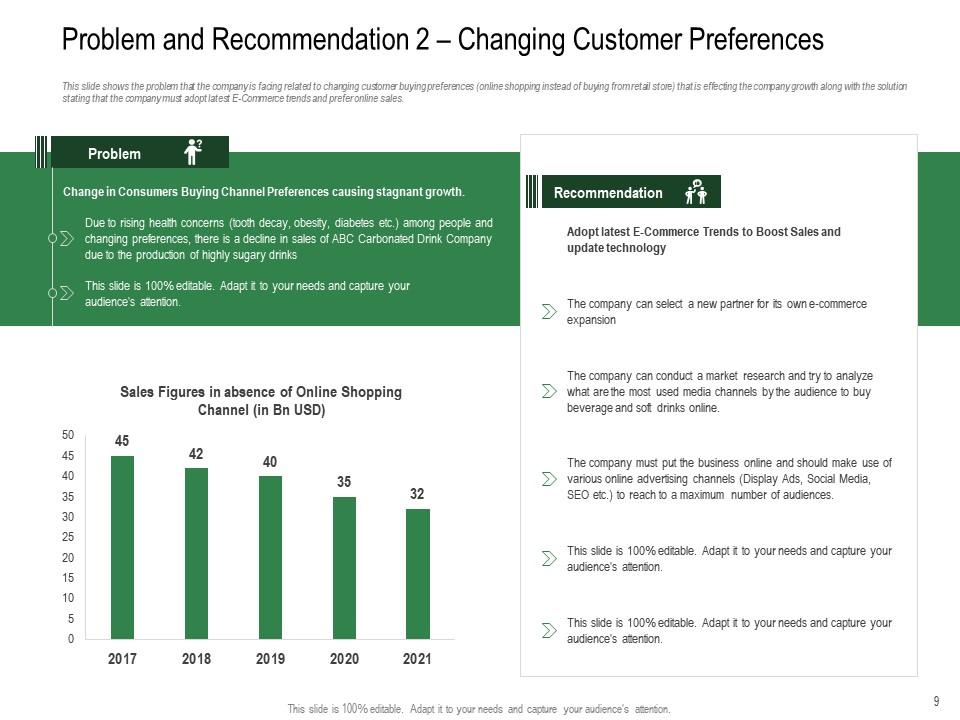
Slide 9: This slide shows the problem that the company is facing related to changing customer buying preferences.
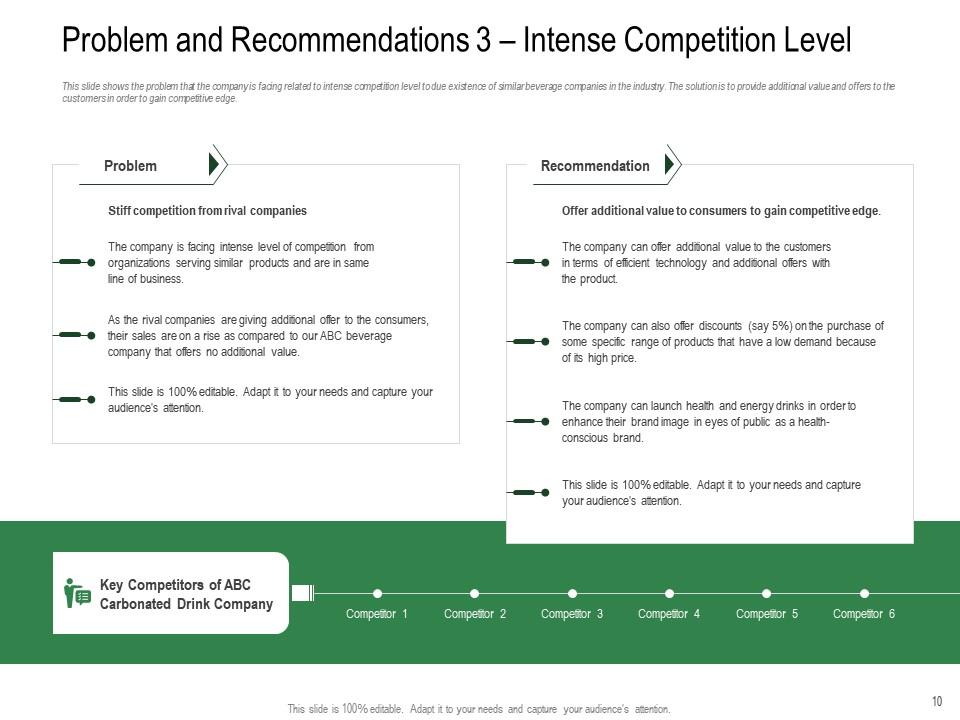
Slide 10: This slide shows the problem that the company is facing related to intense competition level.
Slide 11: This slide depicts title for competitive analysis & strategies to boost sales'.
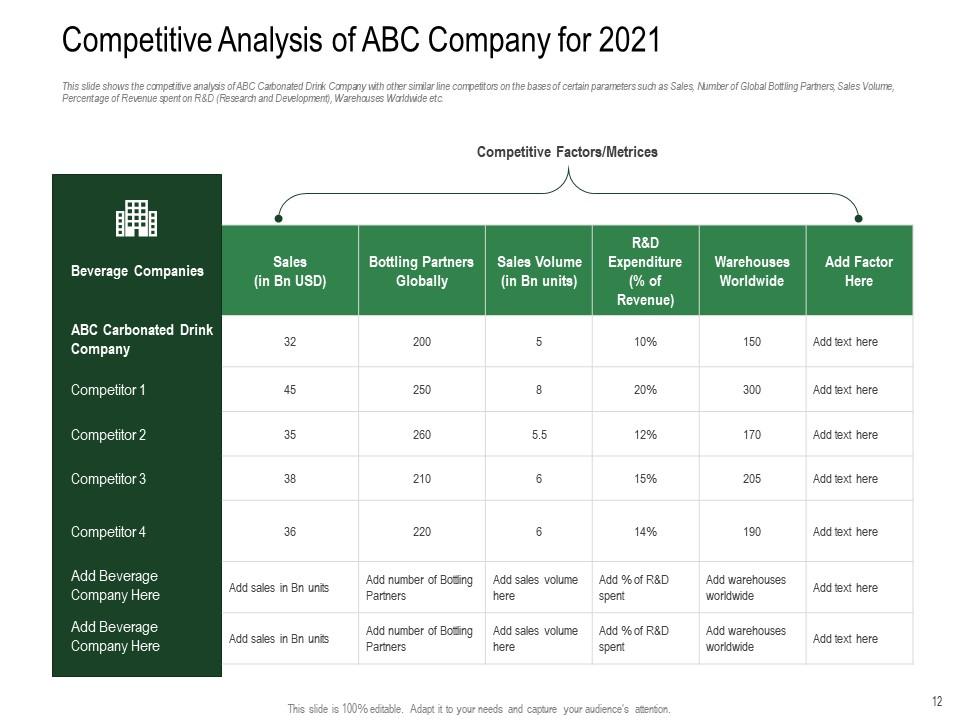
Slide 12: This slide shows the competitive analysis of ABC Carbonated Drink Company with other similar line partners.
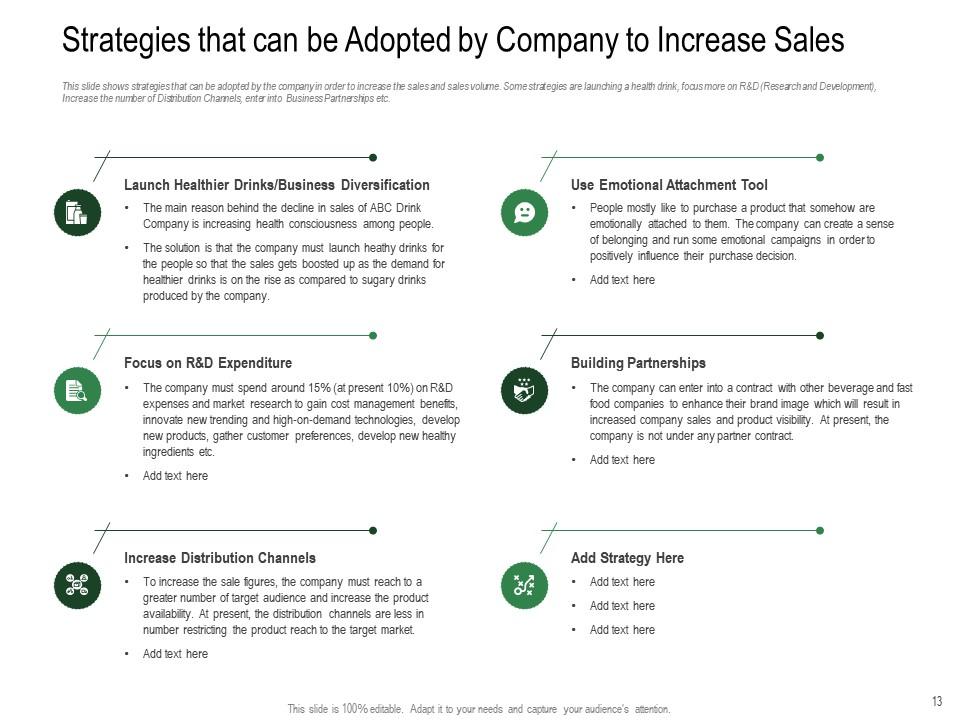
Slide 13: This slide shows strategies that can be adopted by the company in order to increase the sales and sales volume.
Slide 14: This slide displays title for strategies to be adopted by company.
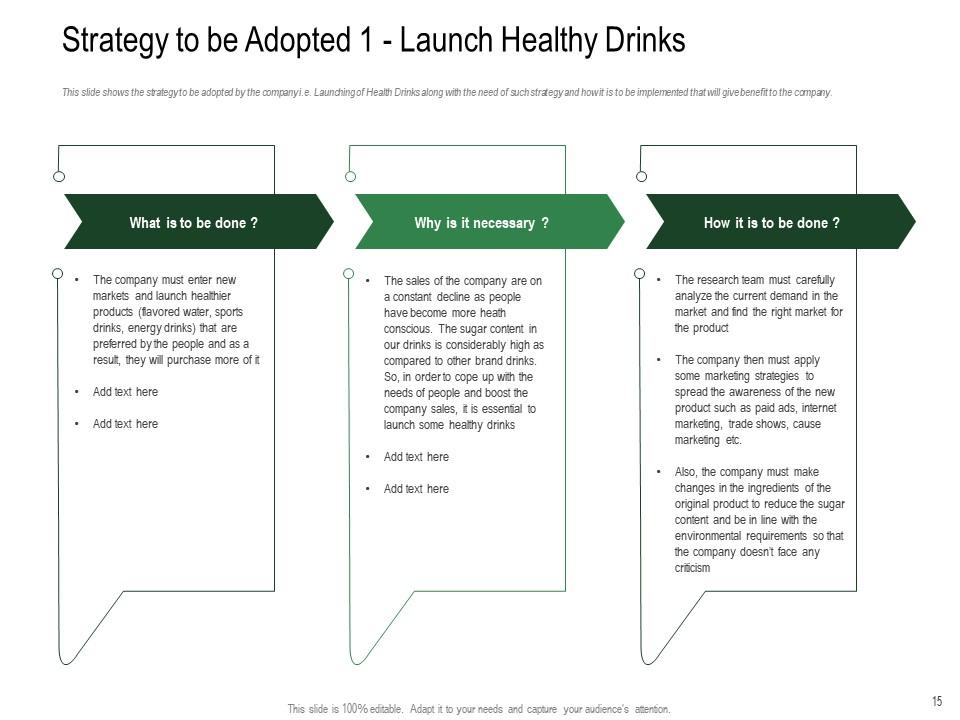
Slide 15: This slide shows the strategy to be adopted by the company i.e. launch healthy drinks.
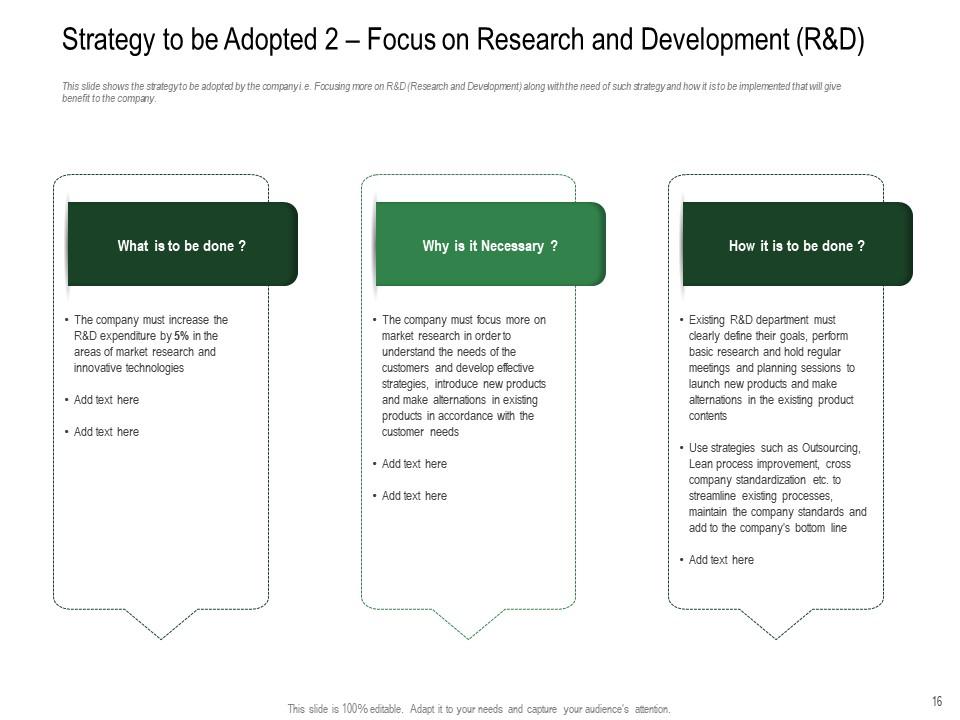
Slide 16: This slide shows the strategy to be adopted by the company i.e. Focusing on R&D (Research and Development).
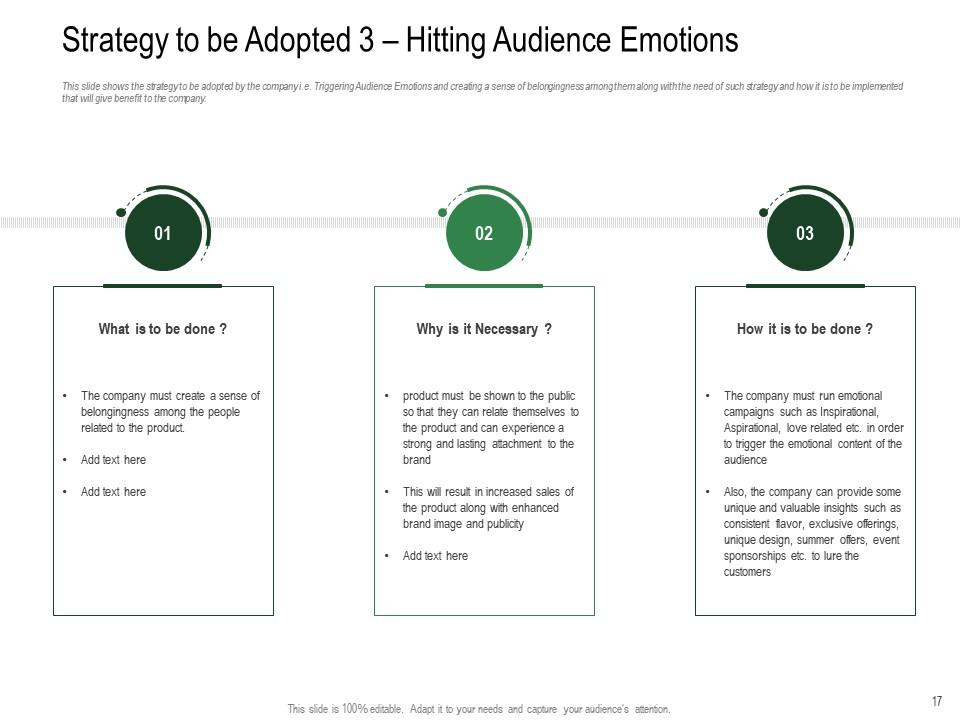
Slide 17: This slide shows the strategy to be adopted by the company i.e. Triggering Audience Emotions.
Slide 18: This slide presents title for SWOT analysis.
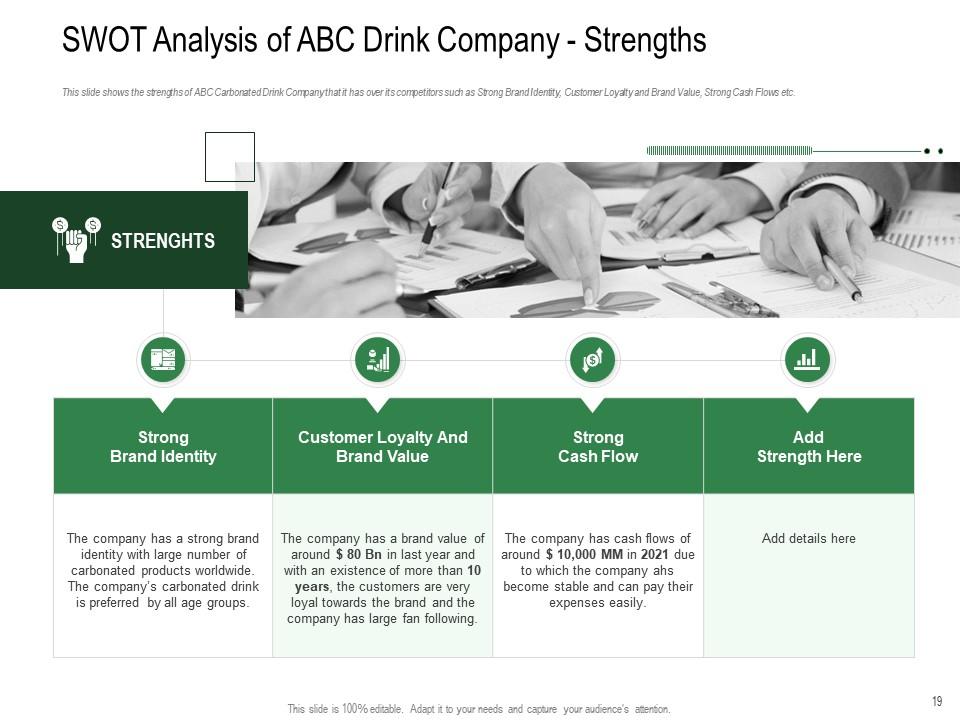
Slide 19: This slide shows the strengths of ABC Carbonated Drink Company.
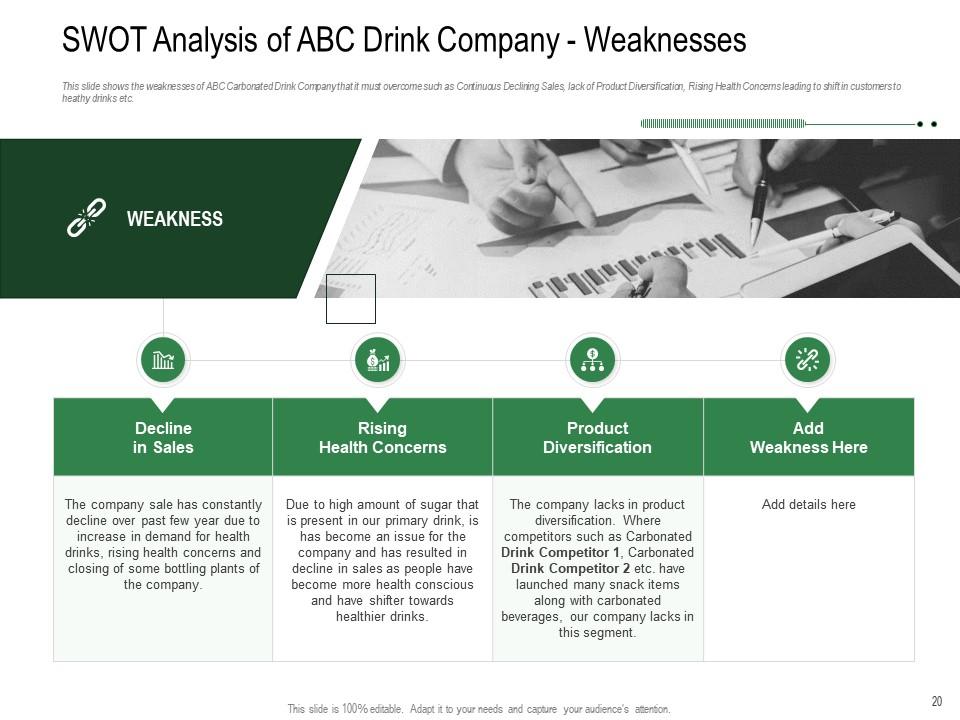
Slide 20: This slide shows the weaknesses of ABC Carbonated Drink Company.
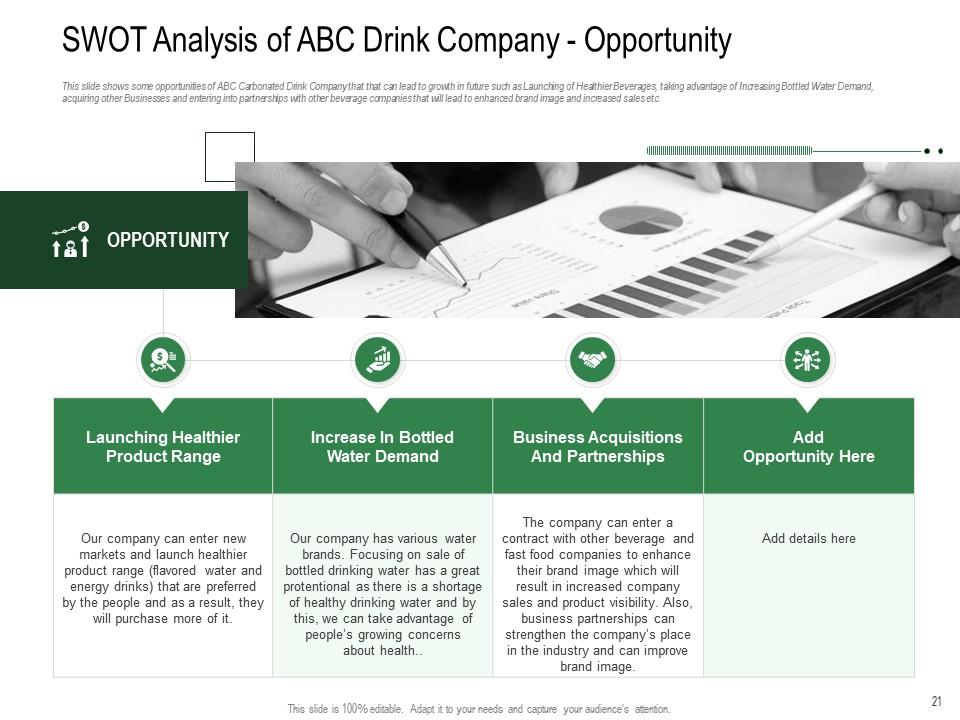
Slide 21: This slide shows some opportunities of ABC Carbonated Drink Company.
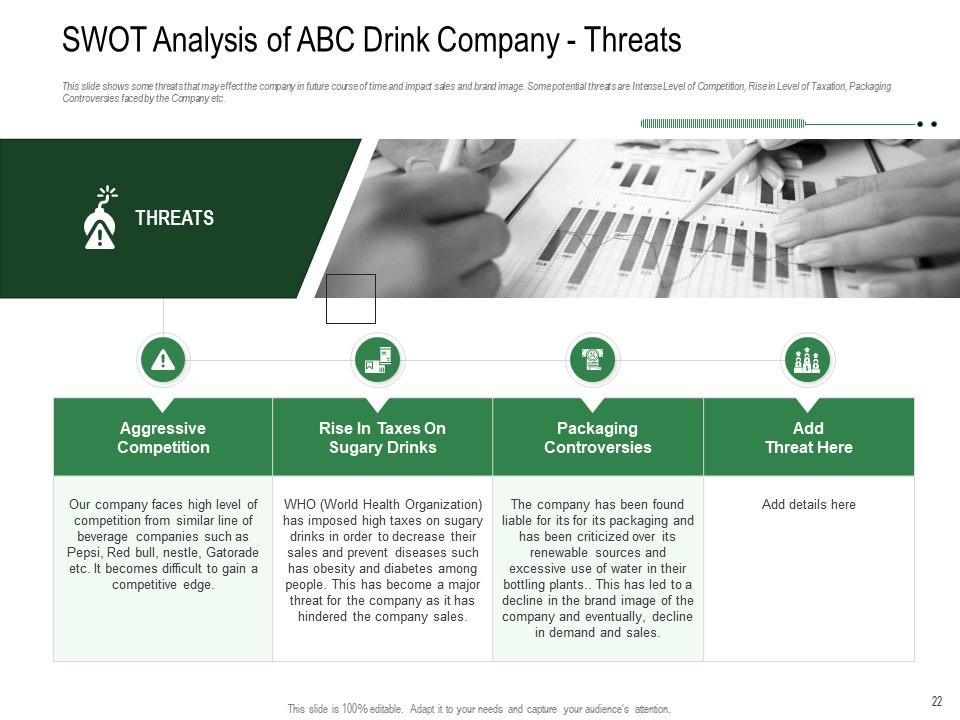
Slide 22: This slide shows some threats that may effect the company in future.
Slide 23: This slide exhibits title for 'Cost-profitability analysis'.
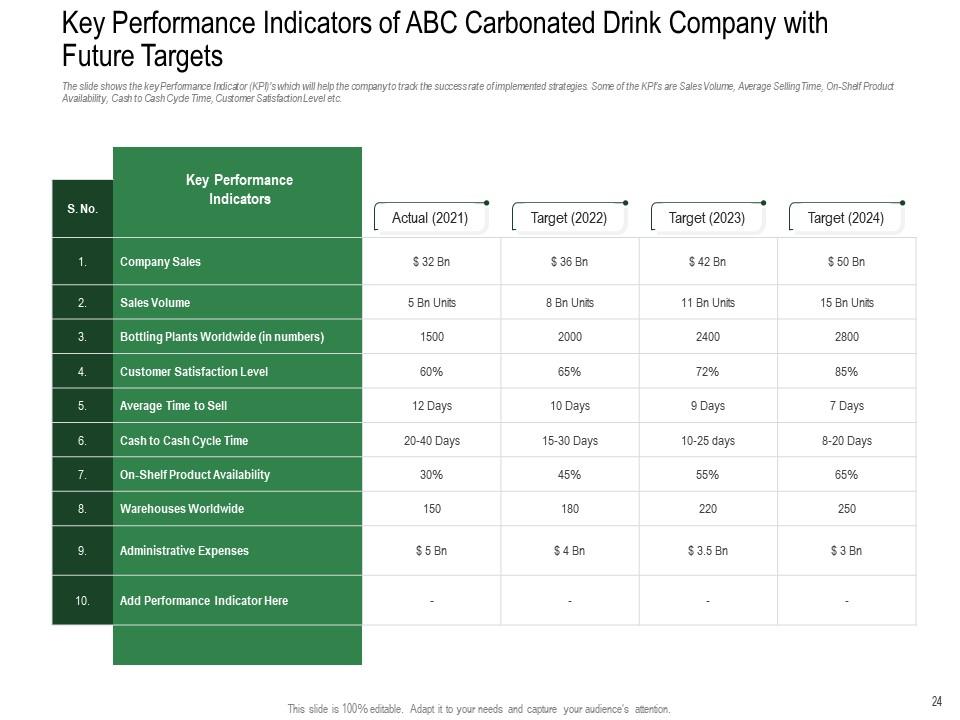
Slide 24: The slide shows the key Performance Indicator (KPI)’s which will help the company to track the success rate of implemented strategies.
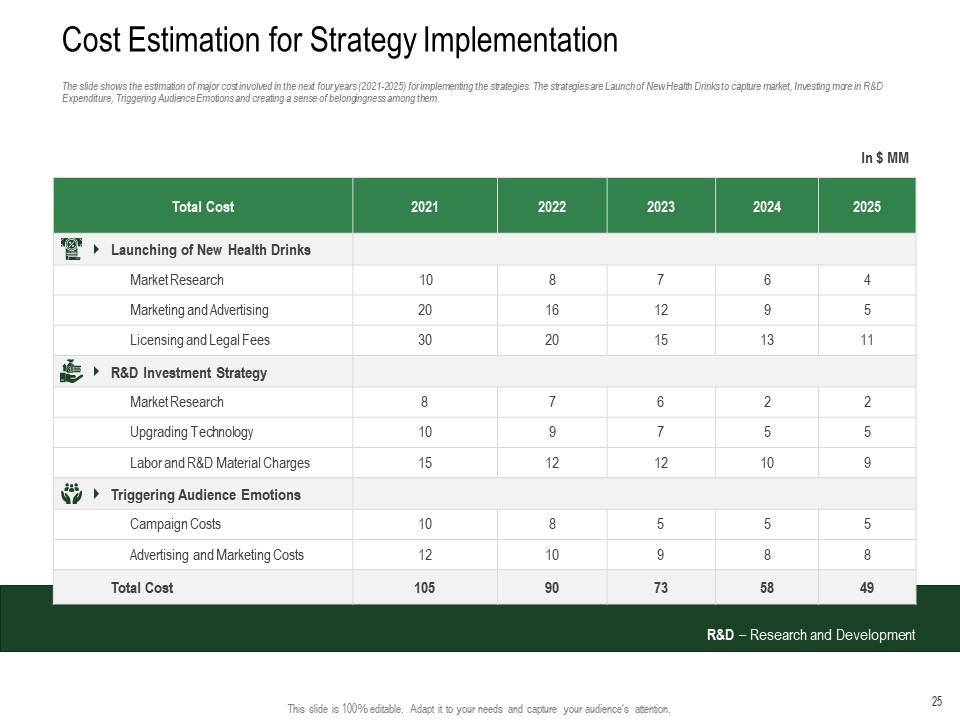
Slide 25: The slide shows the estimation of major cost involved in the next four years (2021-2025) for implementing the strategies.
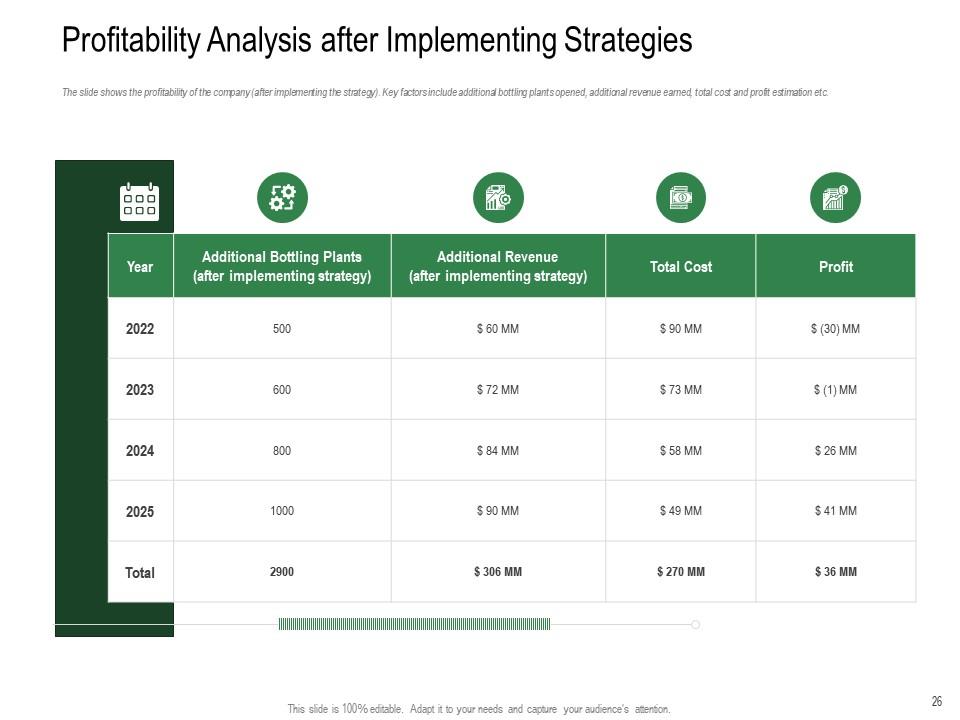
Slide 26: The slide shows the profitability of the company (after implementing the strategy).
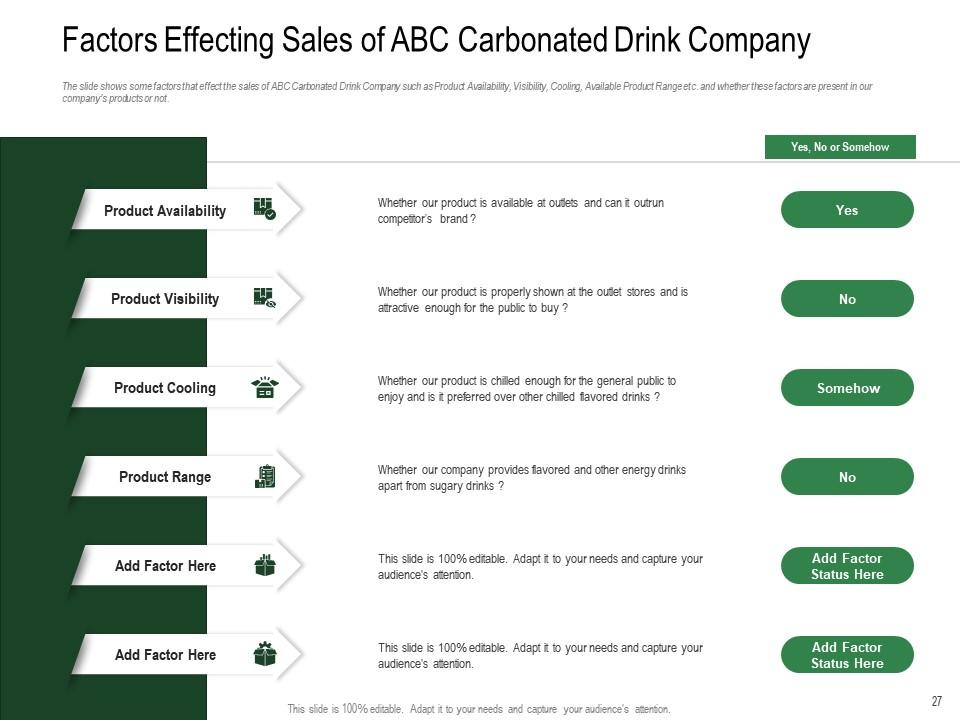
Slide 27: The slide shows some factors that effect the sales of ABC Carbonated Drink Company.
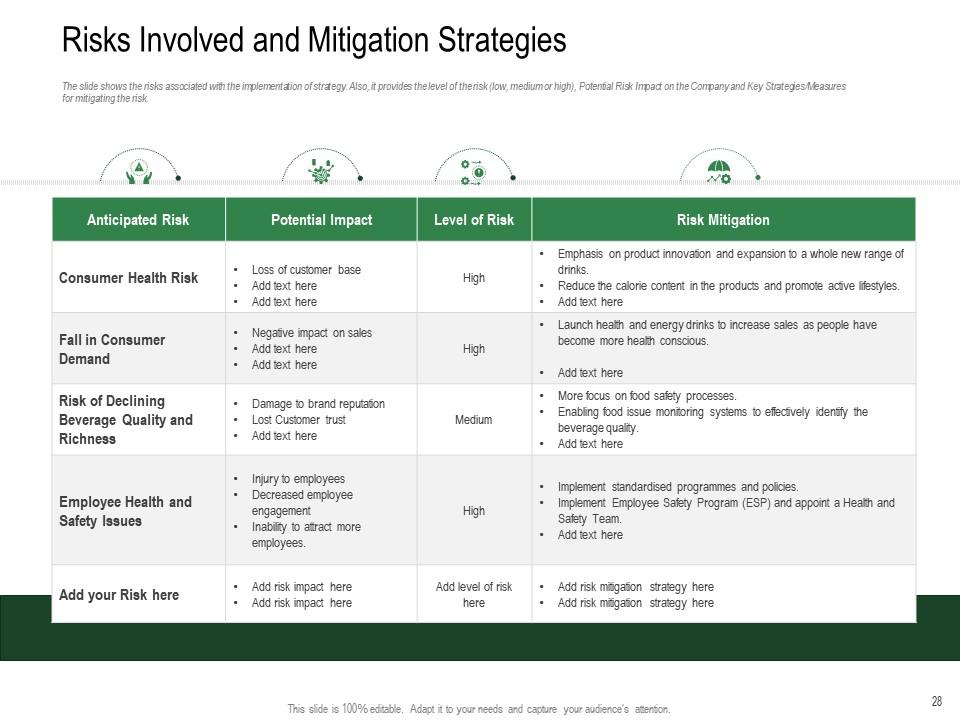
Slide 28: The slide shows the risks associated with the implementation of strategy.
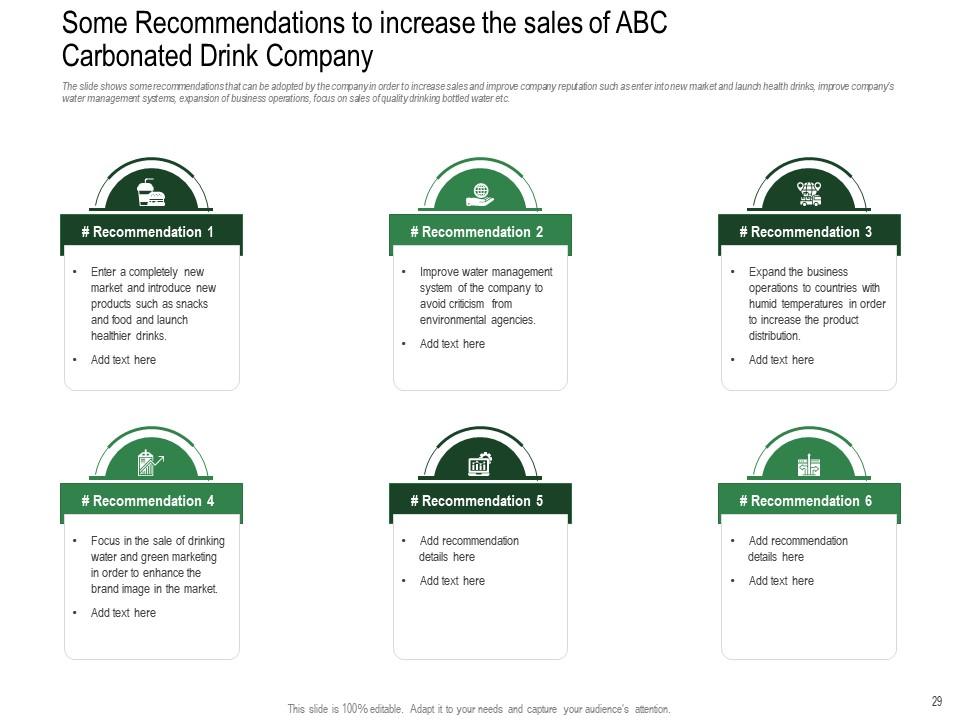
Slide 29: The slide shows some recommendations that can be adopted by the company in order to increase sales.
Slide 30: This slide depicts title for 'Sales measurement dashboard'.
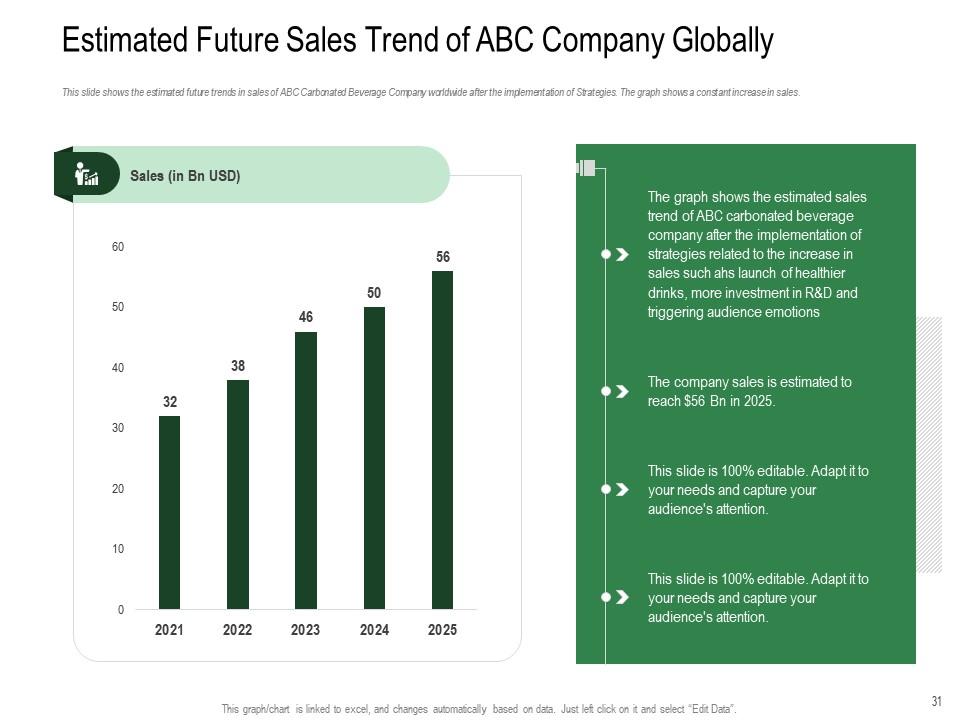
Slide 31: This slide shows the estimated future trends in sales of ABC Carbonated Beverage Company worldwide.
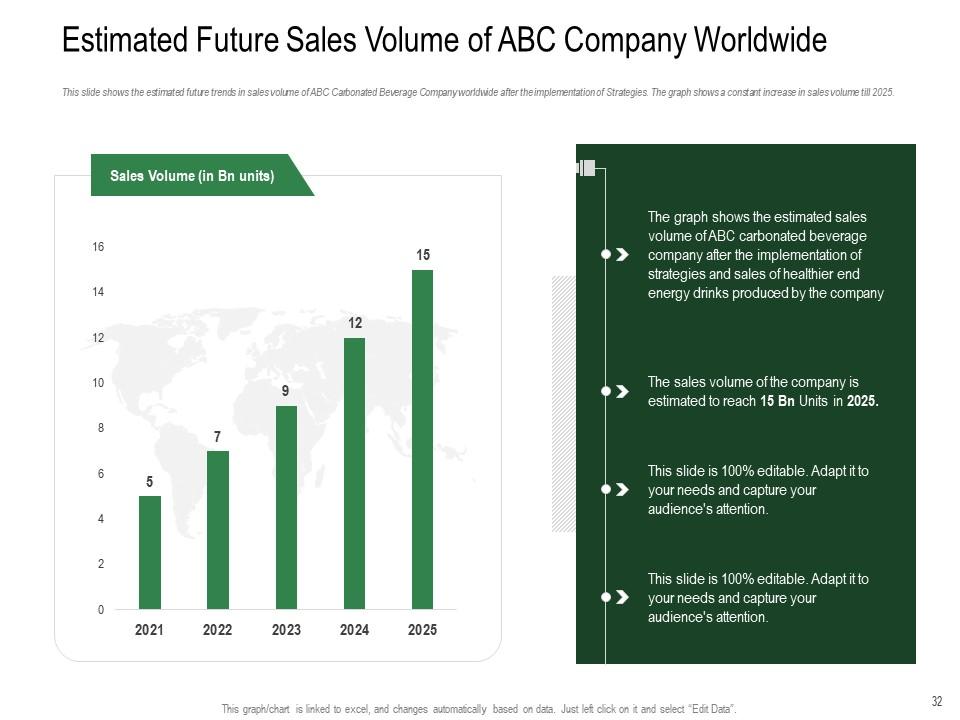
Slide 32: This slide shows the estimated future trends in sales volume of ABC Carbonated Beverage Company worldwide.
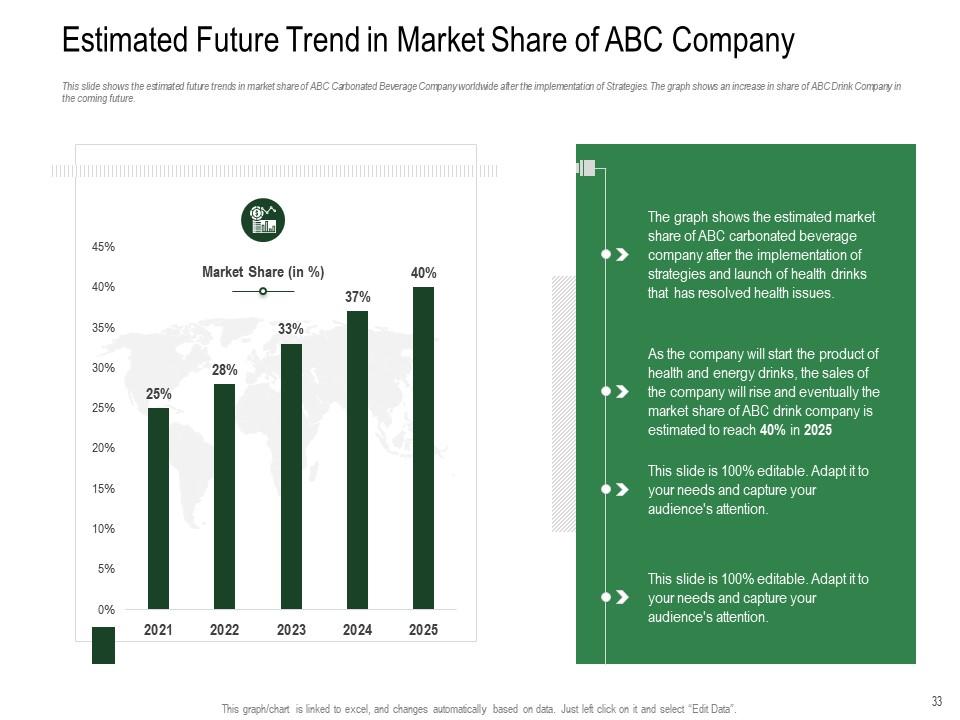
Slide 33: This slide shows the estimated future trends in market share of ABC Carbonated Beverage Company worldwide.
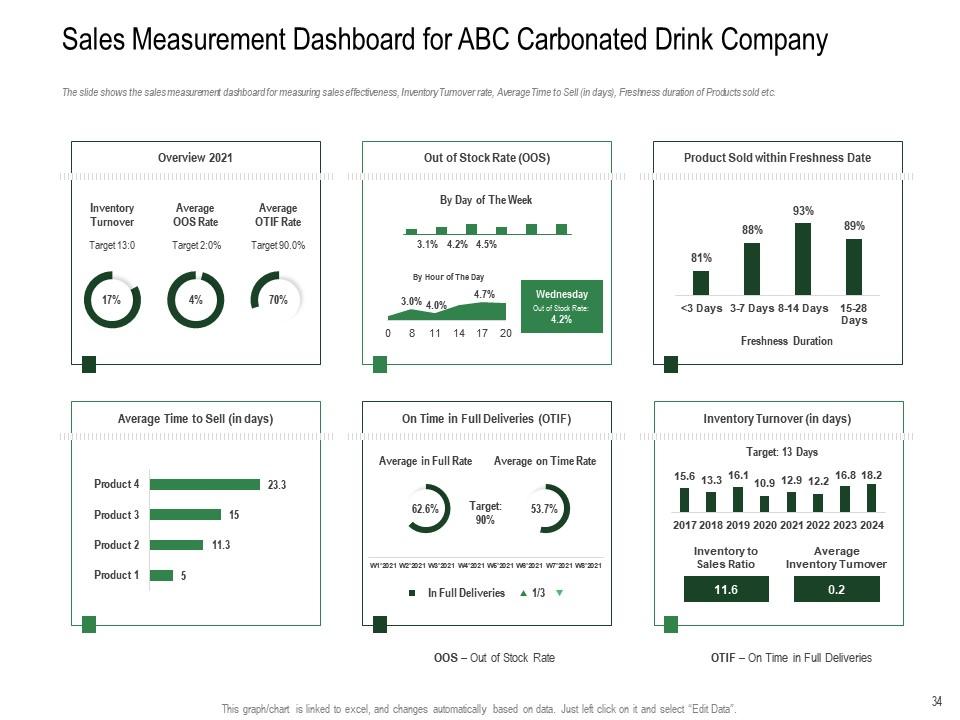
Slide 34: The slide shows the sales measurement dashboard for measuring sales effectiveness, Inventory Turnover rate, etc.
Slide 35: This is the icons slide.
Slide 36: This slide presents title for additional slides.
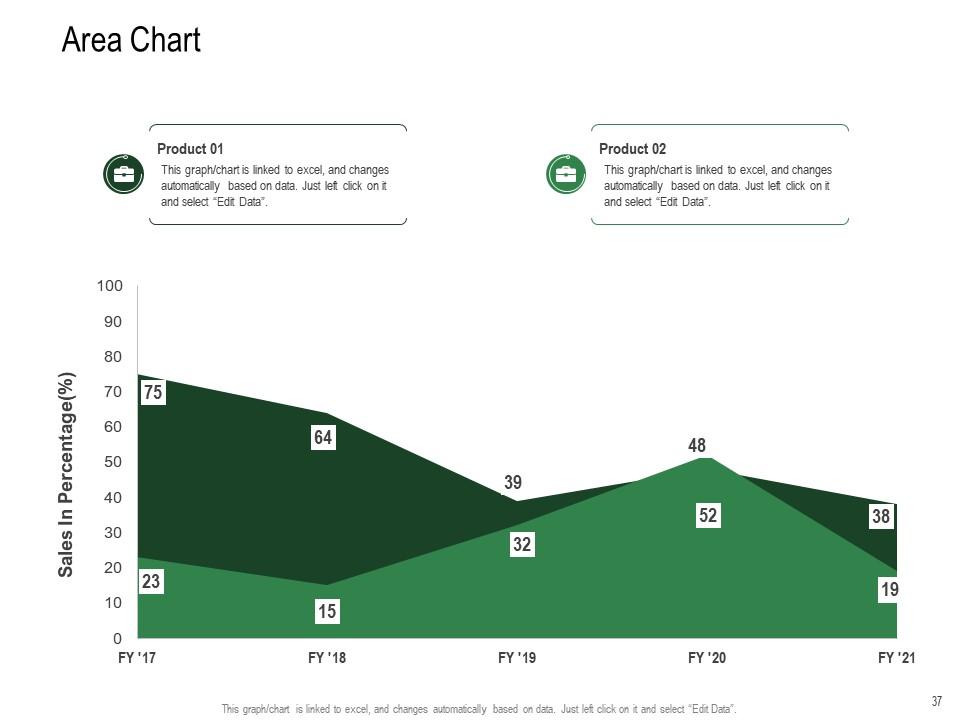
Slide 37: This slide exhibits yearly sales area charts for different products. The charts are linked to Excel.
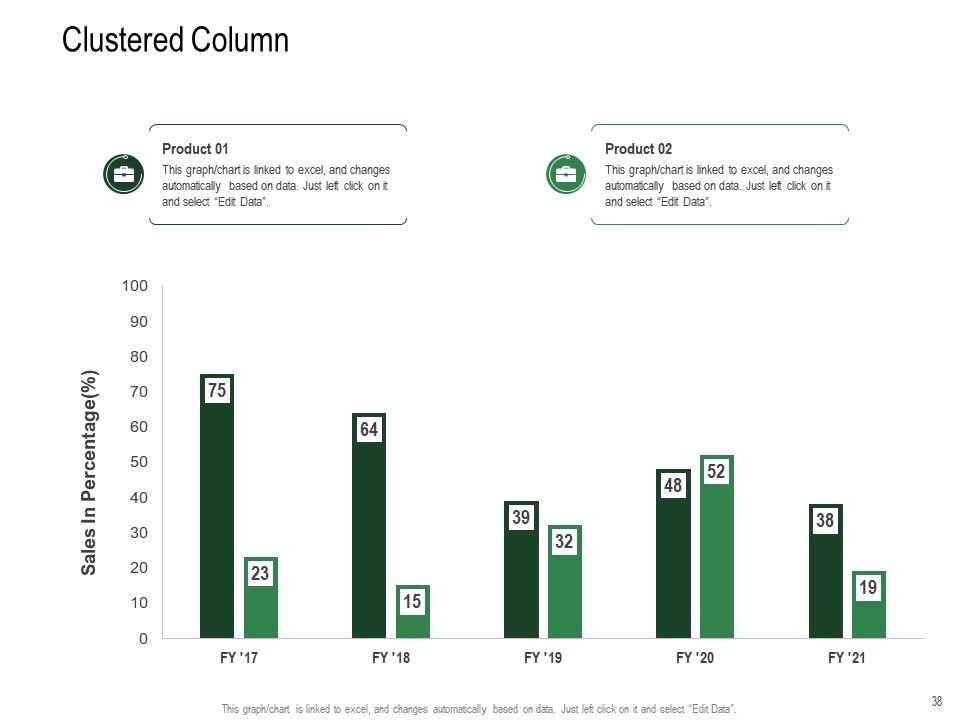
Slide 38: This slide displays yearly sales clustered column charts for different products. The charts are linked to Excel.
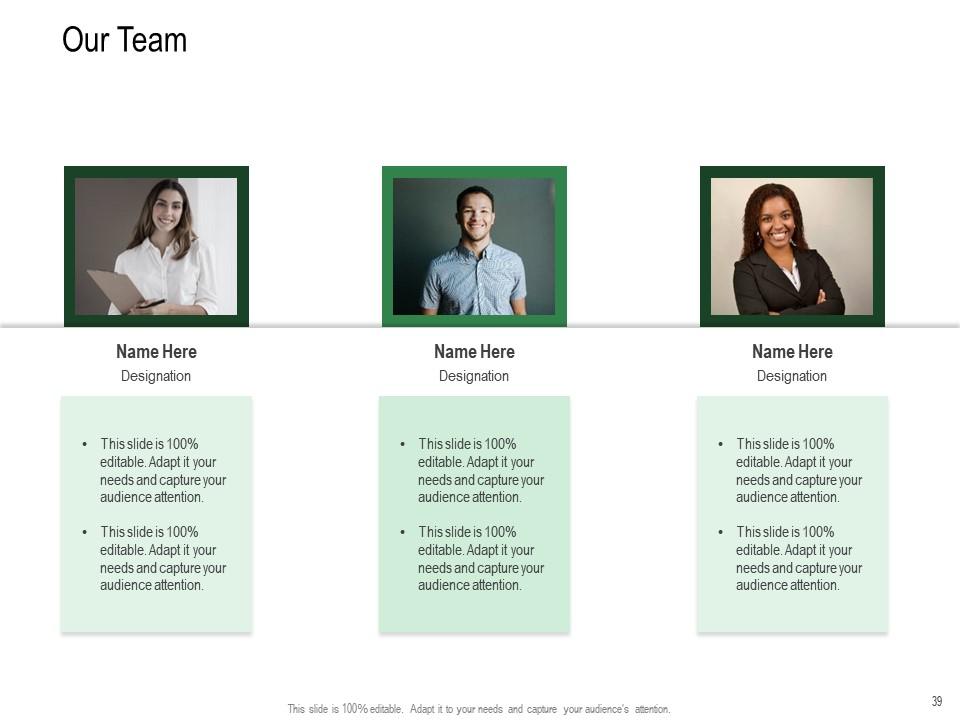
Slide 39: This slide shows details of team members like name, designation, etc.
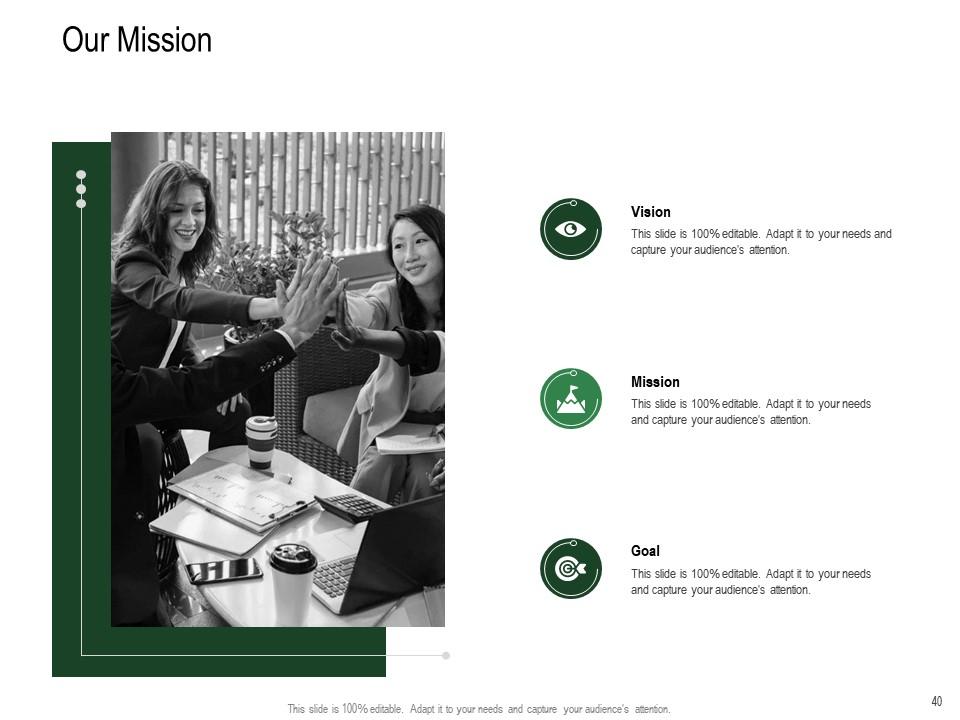
Slide 40: This slide presents your company's vision, mission and goals.
Slide 41: This slide shows about your company, target audience and its client's values.
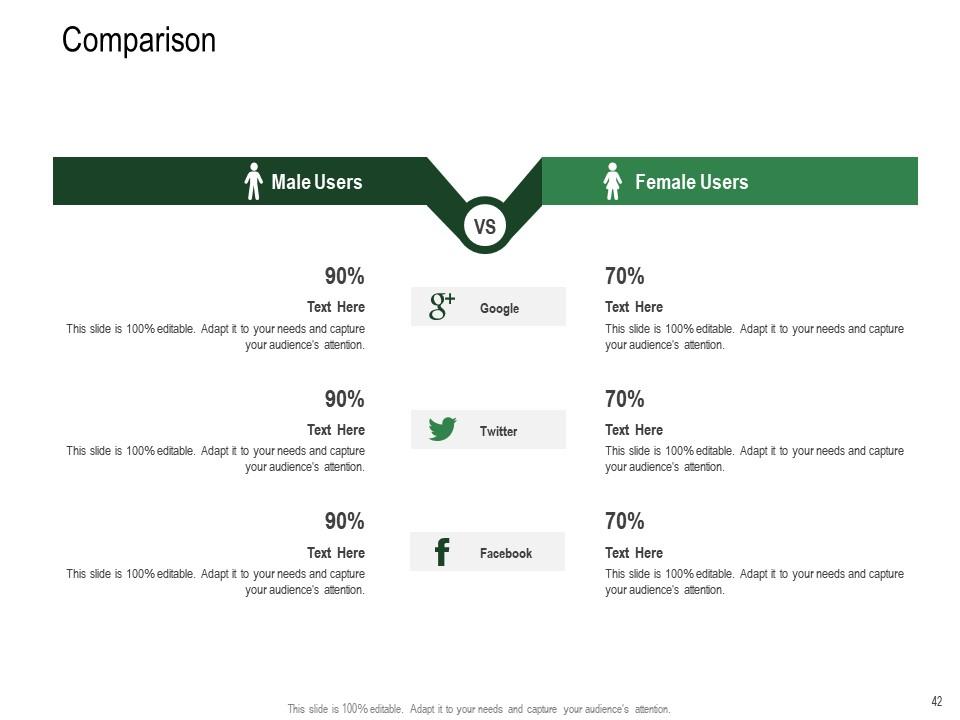
Slide 42: This slide highlights comparison of products based on selects.
Slide 43: This slide shows Organization Chart.
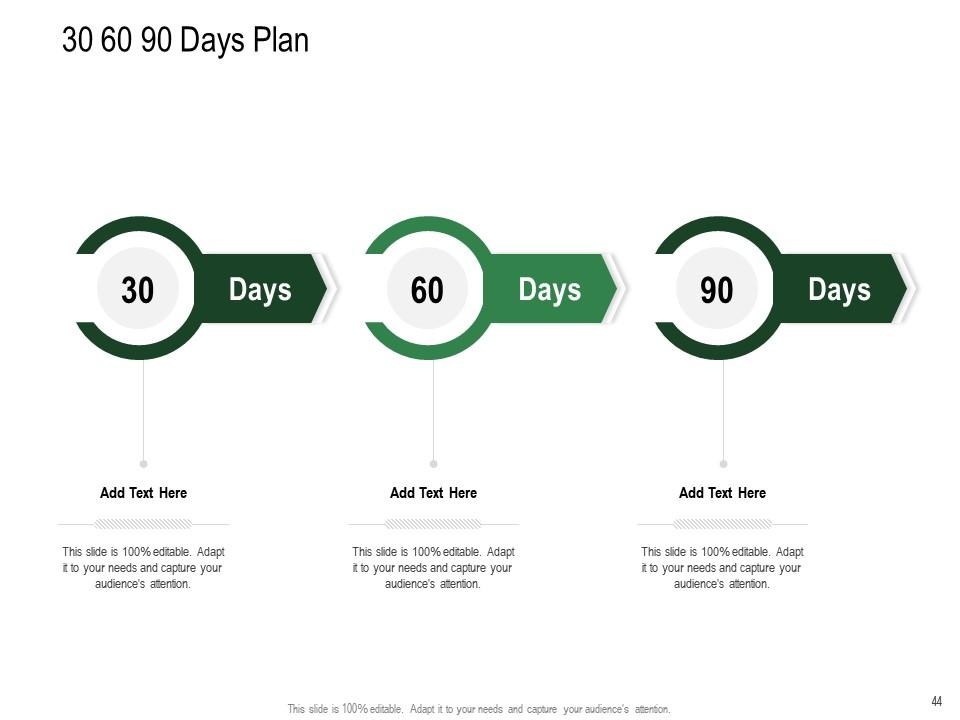
Slide 44: This slide depicts 30-60-90 days plan for projects.
Slide 45: This slide displays goals.
Slide 46: This slide exhibits yearly timeline.
Slide 47: This is thank you slide & contains contact details of company like office address, phone no., etc.
Revenue decline of carbonated drink company powerpoint presentation slides with all 47 slides:
Use our Revenue Decline Of Carbonated Drink Company Powerpoint Presentation Slides to effectively help you save your valuable time. They are readymade to fit into any presentation structure.
-
Great product with effective design. Helped a lot in our corporate presentations. Easy to edit and stunning visuals.
-
Unique design & color.
-
Out of the box and creative design.
-
Amazing product with appealing content and design.
-
Much better than the original! Thanks for the quick turnaround.
-
Great product with highly impressive and engaging designs.
-
Enough space for editing and adding your own content.
-
Content of slide is easy to understand and edit.
-
Thanks for all your great templates they have saved me lots of time and accelerate my presentations. Great product, keep them up!


