Measurement Shapes Like Tachometer, Thermometer, Scales Digrams Slides Graphics
-
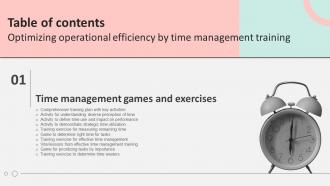
 Table Of Contents For Optimizing Operational Efficiency By Time Management Training DTE SS
Increase audience engagement and knowledge by dispensing information using Table Of Contents For Optimizing Operational Efficiency By Time Management Training DTE SS. This template helps you present information on one stages. You can also present information on Comprehensive Training Plan, Measuring Remaining Time, Time Management Training using this PPT design. This layout is completely editable so personaize it now to meet your audiences expectations.


