

Social Media Analytics With Tools And Techniques Powerpoint Presentation Slides




Try Before you Buy Download Free Sample Product
 Impress Your
 Audience
 100%
100% Editable
 Save Hours
 of Time


This Social Media Analytics with Tools and Techniques PPT includes an introduction, platforms, and key tips for using. It also comprises types of social media analytics such as descriptive, diagnostic, predictive and prescriptive, etc. This Strategic Decision-Making with Social Media Analytics PowerPoint presentation represents unstructured data in social media, the importance of unstructured data, and social metrics. In addition, Maximizing the Impact of Social Media Analytics demonstrates market analysis which includes the global social media analytics market, future trends, and different types of analysis such as performance, audience, competitor analysis, etc. Furthermore, the Cracking the Code of Social Media Analytics deck discusses the tools of social media analytics such as Hootsuite, Google Analytics, RivalIQ, Brandwatch, etc. Moreover, the social media analytics PPT contains sections about tracking the performance of social media through analytics. Lastly, this PowerPoint Presentation contains dashboards of social media analytics and the roadmap deployment of social media analytics. Download our 100 percent editable and customizable template, which is also compatible with Google Slides.
People who downloaded this PowerPoint presentation also viewed the following :
Content of this Powerpoint Presentation
Slide 1: This slide introduces Social Media Analytics with Tools and Techniques. State your company name and begin.
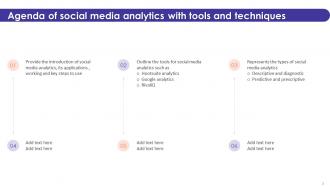
Slide 2: This is an Agenda slide. State your agendas here.
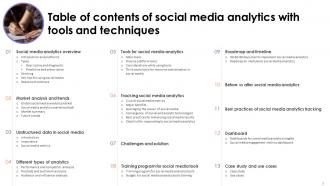
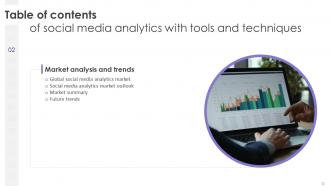
Slide 3: This slide shows Table of Content for the presentation.
Slide 4: This slide shows title for topics that are to be covered next in the template.
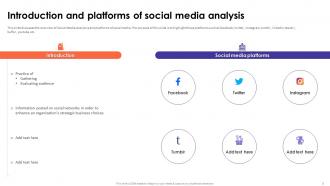
Slide 5: This slide discusses the overview of Social Media Analytics and platforms of social media and highlights those platforms such as facebook, twitter etc.
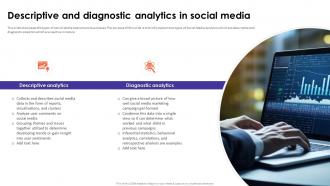
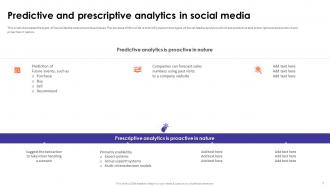
Slide 6: This slide showcases the types of Social Media Analytics on businessesand briefly explain two types of Social Media Analytics.
Slide 7: This slide also presents the types of Social Media Analytics on businessesand briefly explain two types of Social Media Analytics.
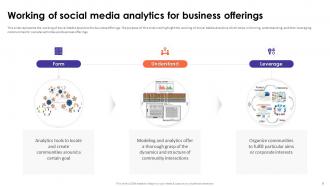
Slide 8: This slide represents the working of Social Media Analytics for business offeringsand highlight the working of Social Media Analytics.
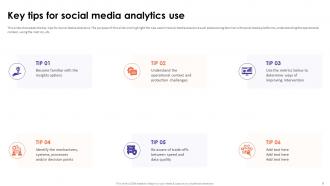
Slide 9: This slide showcases the key tips for Social Media Analyticsand highlight the tips used in Social Media Analytics.
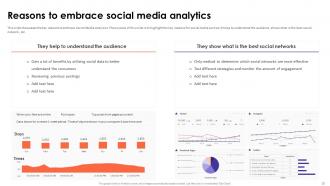
Slide 10: This slide displays the key reasons to embrace Social Media Analytics and highlights the key reasons for social media such as it helps to understand the audience etc.
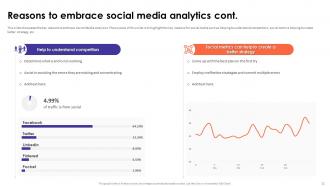
Slide 11: This slide showcases the key reasons to embrace Social Media Analyticsand highlight the key reasons for social media.
Slide 12: This slide shows title for topics that are to be covered next in the template.
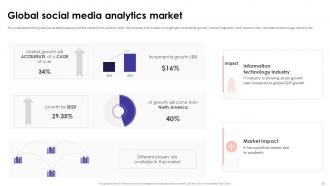
Slide 13: This slide depicts the global Social Media Analytics of the market from 2020 to 2024and highlight incremental growth, market fragments etc.
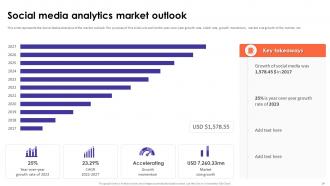
Slide 14: This slide represents the Social Media Analytics of the market outlookand outline the year-over-year growth rate, CAGR rate, growth momentum etc.
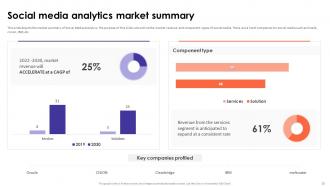
Slide 15: This slide depicts the market summary of Social Media Analyticsand outline the market revenue and component types of social media.
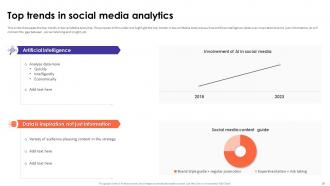
Slide 16: This slide showcases the top trends in Social Media Analytics and highlights the top trends in Social Media Analytics such as artificial intelligence etc.
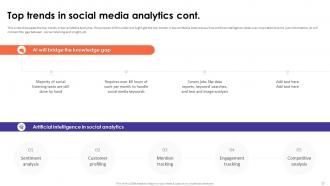
Slide 17: This slide displays the top trends in Social Media Analyticsand highlight the top trends in Social Media Analytics.
Slide 18: This slide shows title for topics that are to be covered next in the template.
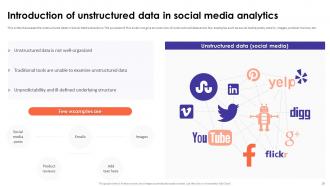
Slide 19: This slide showcases the unstructured data in Social Media Analyticsand give an overview of unstructured data and a few examples.
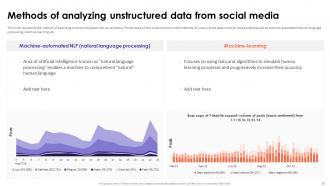
Slide 20: This slide represents the method of analysing unstructured data from social media and outlines the methods of unstructured data in social media analysis.
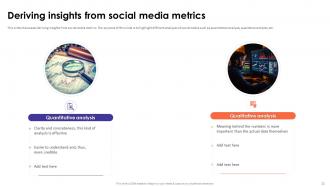
Slide 21: This slide showcases deriving insights from social media metricsand highlight different analyses of social media.
Slide 22: This slide shows title for topics that are to be covered next in the template.
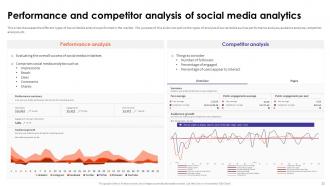
Slide 23: This slide showcases the different types of Social Media Analytics performed in the marketand outline the types of analysis of social media.
Slide 24: This slide also displays the different types of Social Media Analytics performed in the marketand outline the types of analysis of social media.
Slide 25: This slide showcases the different types of Social Media Analytics performed in the market and outlines the types of analysis of social media such as performance analysis etc.
Slide 26: This slide shows title for topics that are to be covered next in the template.
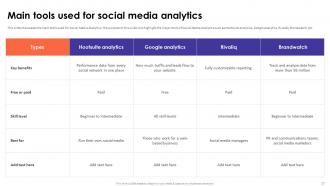
Slide 27: This slide showcases the main tools used for Social Media Analytics and highlights the major tools of Social Media Analytics such as Hootsuite analytics, Google Analytics etc.
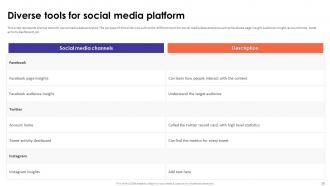
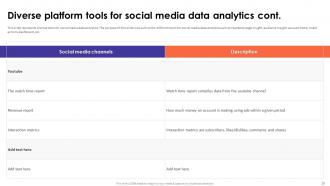
Slide 28: This slide represents diverse tools for social media data analyticsand outline the different tools for social media data analytics.
Slide 29: This slide presents diverse tools for social media data analytics and outlines the different tools for social media data analytics such as Facebook page insight etc.
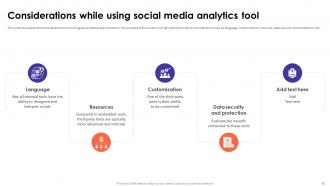
Slide 30: This slide showcases the Considerations while using Social Media Analytics tools and highlights the points of consideration such as language, customization, recourse etc.
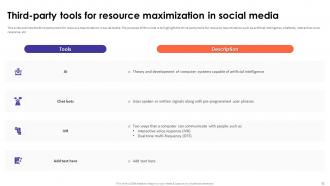
Slide 31: This slide outlines the third-party tools for resource maximization in social media and highlights the third-party tools for resource maximization.
Slide 32: This slide shows title for topics that are to be covered next in the template.
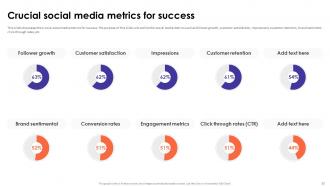
Slide 33: This slide showcases the crucial social media metrics for success and outlines the social media metrics such as follower growth, customer satisfaction, impressions etc.
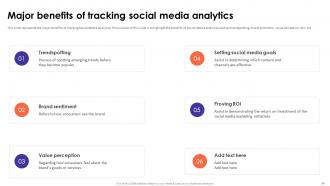
Slide 34: This slide represents the major benefits of tracking Social Media Analytics and highlights the benefits of Social Media Analytics such as trendspotting, brand sentiment etc.
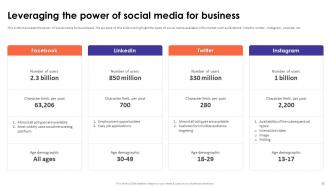
Slide 35: This slide showcases the power of social media for businesses and highlight the types of social media available in the market such as facebook, linkedin, twitter etc.
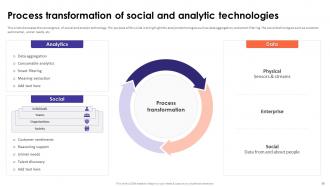
Slide 36: This slide displays the convergence of social and analytic technology and highlight the analytic technologies such as data aggregation, and smart filtering.
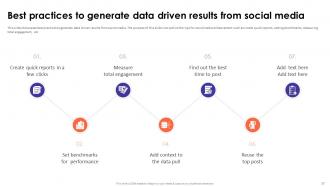
Slide 37: This slide showcases best practices to generate data driven results from social media and outlines the tips for social media enhancement such as create quick reports etc.
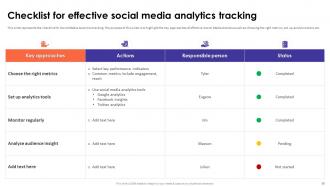
Slide 38: This slide represents the checklist for Social Media Analytics tracking and highlights the key approaches of effective Social Media Analytics.
Slide 39: This slide shows title for topics that are to be covered next in the template.
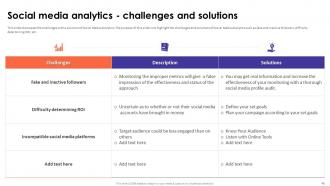
Slide 40: This slide showcases the challenges with a solution of Social Media Analytics and highlight the challenges and solutions of Social Media Analytics.
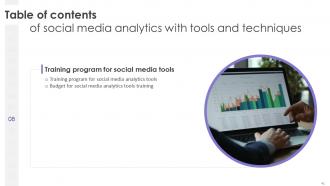
Slide 41: This slide shows title for topics that are to be covered next in the template.
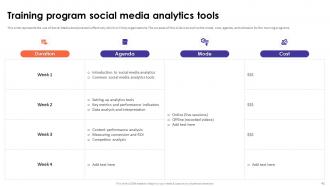
Slide 42: This slide represents the use of Social Media Analytics tools effectively which will help organizations and outline the mode, cost, agenda etc.
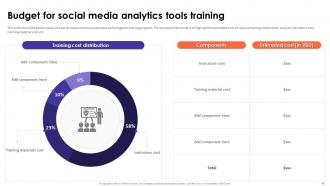
Slide 43: This slide displays the cost breakup of a social media analytics awareness and mitigation training program and highlights the estimated cost of various training components.
Slide 44: This slide shows title for topics that are to be covered next in the template.
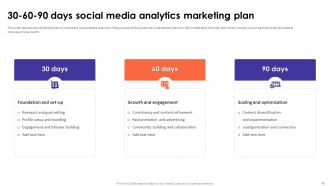
Slide 45: This slide represents a 30-60-90 plan to implement Social Media Analytics and illustrate the plans for the first 90 days from the start of the project including steps to be followed.
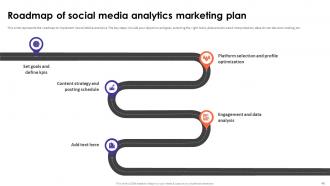
Slide 46: This slide presents the roadmap to implement Social Media Analytics. The key steps include your objective and goal, selecting the right tools etc.
Slide 47: This slide shows title for topics that are to be covered next in the template.
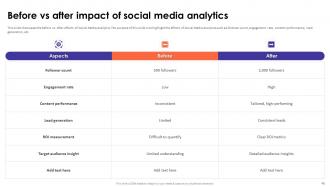
Slide 48: This slide showcases the before vs. after-effects of Social Media Analytics and highlight the effects of Social Media Analytics such as follower count, engagement rate etc.
Slide 49: This slide shows title for topics that are to be covered next in the template.
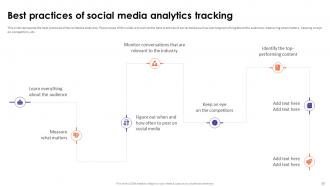
Slide 50: This slide represents the best practices of Social Media Analytics and outline the best practices of social media such as learning everything about the audience etc.
Slide 51: This slide shows title for topics that are to be covered next in the template.
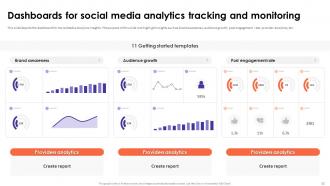
Slide 52: This slide depicts the dashboard for Social Media Analytics insights and highlight insights such as brand awareness, audience growth, post-engagement rate etc.
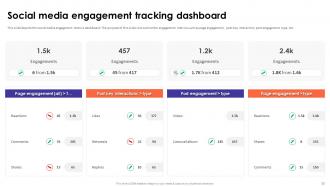
Slide 53: This slide presents the social media engagement metrics dashboard and outline the engagement metrics such as page engagement, post-key interaction, post-engagement type, etc.
Slide 54: This slide shows title for topics that are to be covered next in the template.
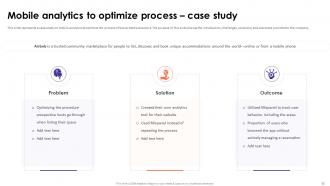
Slide 55: This slide represents a case study on mobile analytics to optimize the process of Social Media Analytics. The purpose of this slide discuss the introduction, challenges etc.
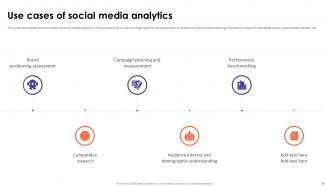
Slide 56: This slide showcases some use cases of social media analytics and highlight the use cases of social media such as brand positioning, competitive research etc.
Slide 57: This slide shows all the icons included in the presentation.
Slide 58: This slide is titled as Additional Slides for moving forward.
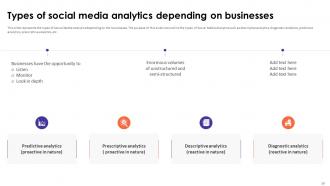
Slide 59: This slide represents the types of Social Media Analytics depending on the businesses and outlines the types of Social Media Analytics.
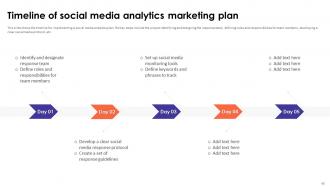
Slide 60: This slide shows the timeline for implementing a social media analytics plan. The key steps include the project identifying and designing the response team etc.
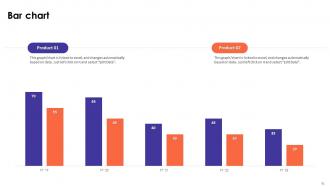
Slide 61: This slide presents Bar Graph with two products comparison.
Slide 62: This is a Timeline slide. Show data related to time intervals here.
Slide 63: This slide depicts Venn diagram with text boxes.
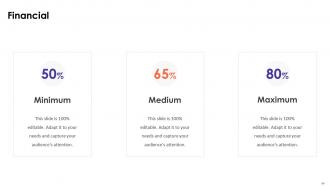
Slide 64: This is a financial slide. Show your finance related stuff here.
Slide 65: This slide contains Puzzle with related icons and text.
Slide 66: This is Our Goal slide. State your firm's goals here.
Slide 67: This is an Idea Generation slide to state a new idea or highlight information, specifications etc.
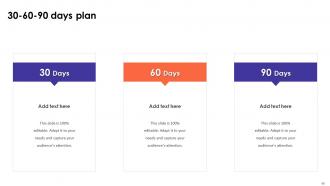
Slide 68: This slide provides 30 60 90 Days Plan with text boxes.
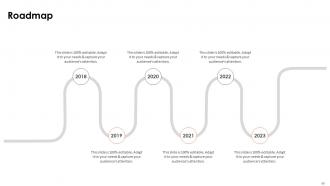
Slide 69: This slide presents Roadmap with additional textboxes. It can be used to present different series of events.
Slide 70: This slide shows Post It Notes for reminders and deadlines. Post your important notes here.
Slide 71: This is a Thank You slide with address, contact numbers and email address.
Social Media Analytics With Tools And Techniques Powerpoint Presentation Slides with all 79 slides:
Use our Social Media Analytics With Tools And Techniques Powerpoint Presentation Slides to effectively help you save your valuable time. They are readymade to fit into any presentation structure.










FAQs for Social Media Analytics With Tools And Techniques
Focus on engagement rate, reach, impressions, and click-through rates first - they actually show you what's working. Follower growth and brand mentions are solid too, especially mentions because people get brutally honest there lol. Just don't obsess over total follower count, that's mostly fluff. Pick maybe 3-4 metrics that match what you're trying to accomplish, then set up some kind of dashboard so you're not staring at spreadsheets for hours. Way easier to spot trends that way.
Okay so you've gotta measure both the fluffy stuff and actual money. Use UTM codes on every social link - seriously, this is clutch for tracking which posts actually make you cash. Set up conversion tracking to see sales, leads, whatever matters to your business. Engagement and reach are fine to watch, but honestly? Likes without purchases are pretty useless. Calculate your cost per acquisition and stack it against other channels you're using. If you can't draw a line from your social budget to real results, you're basically paying for popularity points. Oh and compare everything - see which platforms actually work for you versus which ones just eat your time.
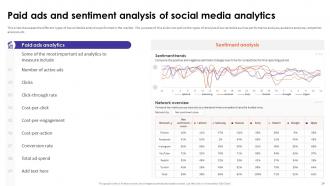
So sentiment analysis shows you how people actually *feel* about your brand, not just what they're posting. It sorts social mentions into positive, negative, or neutral automatically - saves you from scrolling through endless comments (seriously, your eyes will thank you). You can catch PR disasters early and see what's really driving customer emotions beyond basic engagement stats. Honestly, it's way better than guessing if people like your campaigns. The data helps you tweak messaging and respond to problems before they explode. Plus leadership loves seeing actual ROI. I'd start with tracking sentiment around your biggest campaigns first.
Honestly, each platform gives you completely different data depending on how people actually use it. Instagram's all visual stuff - image performance, story views, hashtag reach. LinkedIn gets way more into professional demographics like job titles and industries (which makes sense). Twitter/X is huge on real-time conversations and what's trending. Facebook probably has the most detailed demographic breakdowns since people overshare their whole lives there lol. TikTok's where you get those video completion rates and can actually track viral potential. My advice? Don't expect the same metrics everywhere. Just focus on what each platform does best for analytics.
Hootsuite Insights, Sprout Social, or Buffer Analyze are solid if you want all-in-one platforms. Sprout's interface is ridiculously clean - I'm kinda obsessed with it tbh. Need deeper stuff? Brandwatch and Mention are great for social listening. On a tight budget? Don't sleep on the native analytics like Facebook Insights and Twitter's built-in tools - they're actually pretty good. Oh, and Google Analytics tracks social referral traffic too. My advice? Figure out where your audience hangs out first, then grab tools for those specific platforms. You'll go crazy trying to monitor everything.
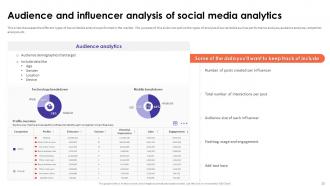
So demographic insights show you exactly who's engaging - ages, locations, interests, all that stuff. Way better than just blasting ads everywhere and crossing your fingers. Check your analytics regularly and you'll spot patterns, like maybe 25-34 year old women in cities are your main audience. Then you can build campaigns specifically for them instead of wasting money on random targeting. I honestly think most people set their audience once and never look at it again, which is such a missed opportunity. Keep tweaking those parameters based on what the data's telling you.
Look at what's actually crushing it for you - like if your videos are getting 3x more engagement than photos, lean into that hard. Check when your audience is online (sometimes the data shows weird peak times that'll surprise you). Your top hashtags and topics? Make more content around those. I'd also stalk your competitors a bit - see what formats work for them, then put your own spin on it. Sentiment analysis helps dial in your brand voice too, which sounds fancy but it's pretty straightforward. Don't change everything at once though. Pick one thing, test it for two weeks, then move on.
Honestly, you're probably overthinking this - most platforms already give you free analytics. Facebook Insights, Instagram Analytics, Twitter Analytics, they're all there waiting for you to actually check them. Pick like 3-4 metrics that actually matter to your biz: engagement rate, reach, click-throughs. Don't get caught up counting followers though, that number's pretty meaningless if nobody's engaging. Google Analytics is clutch too since it shows how your social posts drive website traffic. Just spend 30 mins each week looking at what's working and tweak from there.
So first off, consent is huge here - people didn't sign up to be research subjects when they posted that stuff. Anonymize everything and don't ID anyone without permission. Your data's gonna be biased too since social media skews young and urban (not exactly a cross-section of America, you know?). Watch for bots and fake accounts messing with your results. Honestly, just think about how you'd feel if someone was mining your posts the same way. That's your gut check right there.
Honestly, just watch what's actually blowing up in your space right now. Check your best posts and see what hashtags are trending - that's where your audience is hanging out. Why waste time on dead topics, you know? I always tell people to jump on patterns early before everyone else catches on. Like if you notice certain formats getting crazy engagement, pump out more of that stuff ASAP. Also track when people are most active so you can time things right. It's basically about riding the wave instead of chasing it after it's gone.
Dude, social media analytics is a game changer for figuring out what your customers actually want. You can finally see which posts get people engaged and when they're scrolling most. The patterns that show up are honestly pretty wild sometimes - like you'll discover your audience loves behind-the-scenes stuff on Tuesdays or whatever. No more throwing content at the wall hoping it sticks. You'll know what works before you even post it. Check your engagement rates on your last 20 posts first. Look for what's getting shares and comments - that's your goldmine right there.
Dude, visualization tools are a game changer for social media data. No more staring at boring spreadsheets trying to make sense of random numbers. Charts and graphs show you patterns right away - trending hashtags, engagement spikes, when your audience is actually online. I remember our monthly reports used to be such a pain until we got dashboards set up. Now it's super easy to see what content hits and which platforms actually convert. Oh, and start with basic line charts for engagement trends first - you'll be shocked how much it clears things up for your strategy.
Honestly, the biggest pain is just the sheer amount of data - social platforms pump out millions of posts every second, so your system better be ready for that fire hose. Most of what you'll capture is complete garbage that has nothing to do with your brand, which makes filtering a nightmare. API limits are gonna slow you down hard (Twitter's basically unusable now). Real-time sentiment analysis? Good luck with that - it completely whiffs on sarcasm and internet slang. My advice: nail down your filtering criteria first and build solid infrastructure. Don't even think about fancy analysis until that's rock solid.
Think of brand monitoring as your digital radar - it catches problems before they explode everywhere. I check alerts for our company name daily (honestly, it's become a weird habit). Social media moves crazy fast, so you'll spot negative stuff way before traditional news picks it up. When sentiment starts tanking, you can actually do damage control instead of just watching the fire spread. The cool part? Positive conversations show you what's working, so double down on that messaging. Just set up Google Alerts or whatever for your brand terms and make it part of your morning routine.
Honestly, TikTok analytics are where everyone's putting their energy right now - that algorithm is still such a black box. Real-time social listening is getting huge for crisis management, and AI sentiment analysis is way less clunky than it used to be. Cross-platform attribution tracking is finally becoming doable too. Micro-influencer metrics are the new obsession instead of just counting followers. Authentic engagement rates actually matter now. The predictive analytics for viral content sounds cool in theory, but let's be real - it's still pretty much throwing darts at a board. I'd mess around with these tools sooner rather than later though, so you're not totally lost when everyone else catches on.
-
Informative and engaging! I really like the design and quality of the slides.
-
“Slides are formally built and the color theme is also very exciting. This went perfectly with my needs and saved a good amount of time.”