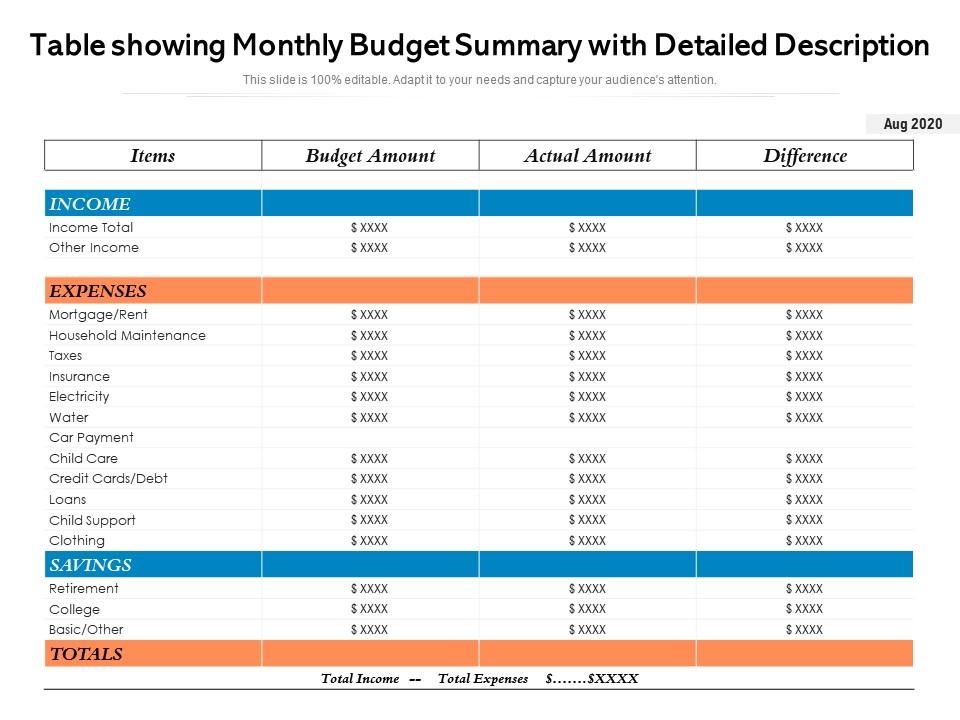
Table showing monthly budget summary with detailed description

Rating:
80%
Table showing monthly budget summary with detailed description
Slide 1 of 2

or

Favourites Favourites

Try Before you Buy Download Free Sample Product

Audience Impress Your
Audience
Editable 100%
Editable
Time Save Hours
of Time
The Biggest Sale is ending soon in
0
0
:
0
0
:
0
0
Rating:
80%
Presenting this set of slides with name Table Showing Monthly Budget Summary With Detailed Description. The topics discussed in these slides are Income, Expenses, Savings. This is a completely editable PowerPoint presentation and is available for immediate download. Download now and impress your audience.

People who downloaded this PowerPoint presentation also viewed the following :

FAQs for Table showing monthly budget summary

Key components include income sources, fixed expenses, variable expenses, debt payments, and savings contributions. These elements enable organizations to track financial performance, identify spending patterns, and optimize resource allocation, with many businesses finding that comprehensive monthly summaries streamline financial planning and enhance operational efficiency.

Visuals enhance monthly budget understanding by transforming complex numerical data into digestible charts, graphs, and infographics that highlight spending patterns, variance analysis, and trend comparisons. Through pie charts showing expense categories, bar graphs displaying month-over-month changes, and dashboard summaries, finance teams streamline reporting processes while enabling stakeholders to quickly identify cost optimization opportunities and make strategic budgeting decisions.

**INPUT**: What templates work best for summarizing a monthly budget effectively? **OUTPUT**: Effective monthly budget summary templates include variance analysis dashboards, category-wise spending breakdowns, visual progress trackers, cash flow summaries, and executive overview formats. These templates streamline financial reporting by highlighting budget vs. actual performance, identifying spending trends, and presenting key metrics clearly, with many organizations finding that visual dashboards enable faster decision-making and enhanced financial transparency. [Word count: 58 words]

**INPUT**: How should unexpected expenses be categorized in a budget summary? **OUTPUT**: Unexpected expenses should be categorized based on their nature and purpose, typically under emergency fund withdrawals, miscellaneous expenses, or specific category overages like medical emergencies or home repairs. This approach enables organizations and individuals to track spending patterns, identify areas requiring larger contingency reserves, and refine future budget allocations, ultimately delivering better financial control and more accurate forecasting capabilities. [Word count: 58]

Common monthly budget summary pitfalls include overlooking irregular expenses, failing to categorize transactions accurately, ignoring seasonal variations, neglecting to reconcile actual versus planned spending, and creating overly complex tracking systems. These oversights often lead to cash flow surprises and poor financial decisions, with many organizations finding that streamlined categorization and regular variance analysis ultimately deliver better spending visibility and strategic resource allocation.

Trends in spending can be highlighted through variance analysis comparing actual versus planned expenses, visual representations like charts showing month-over-month changes, and categorical breakdowns identifying areas of consistent increase or decrease. These analytical approaches enable organizations to spot patterns in operational costs, seasonal fluctuations, and budget deviations, ultimately delivering better financial forecasting and strategic resource allocation for improved fiscal management.

Goal-setting provides strategic direction for monthly budget summaries by establishing measurable financial targets, prioritizing spending categories, and creating accountability frameworks for expense management. Through clear objectives like debt reduction or savings goals, organizations and individuals can evaluate performance against benchmarks, identify areas requiring adjustment, and ultimately maintain financial discipline while building long-term wealth.

Technology streamlines budget tracking through automated expense categorization, real-time spending alerts, cloud-based data synchronization, and comprehensive reporting dashboards. These digital tools enable businesses and individuals to monitor cash flow patterns, identify cost-saving opportunities, and generate detailed monthly summaries automatically, ultimately delivering enhanced financial visibility and more strategic resource allocation decisions.

Personal budget summaries should prioritize income versus expenses, savings rate, debt-to-income ratio, and emergency fund progress, while business summaries focus on cash flow, profit margins, operational efficiency ratios, and growth metrics. These different approaches reflect distinct financial objectives, with personal budgets emphasizing financial stability and wealth building, while business summaries track performance indicators that drive competitive advantage, scalability, and strategic decision-making for sustainable growth.

Monthly budget summaries can be presented through executive dashboards with key metrics for leadership, detailed variance reports for department managers, visual infographics for board members, and simplified overviews for team leads. These tailored presentations enhance stakeholder engagement by delivering relevant financial insights at appropriate detail levels, while streamlining communication across organizational hierarchies, ultimately enabling faster decision-making and improved budget accountability.

Effective budget revision methods include reallocating funds between categories, adjusting expense forecasts based on actual spending patterns, identifying cost-cutting opportunities, and incorporating seasonal variations or unexpected changes. These adjustments enable organizations to maintain financial control, optimize resource allocation, and respond to market conditions, with many companies finding that quarterly revisions enhance operational efficiency and strategic planning accuracy.

Monthly budget summaries should be reviewed weekly for tracking progress and adjusted monthly or quarterly based on actual performance, changing business conditions, and strategic priorities. Organizations typically find that regular weekly monitoring enables faster course corrections, while quarterly adjustments accommodate seasonal variations and market shifts, ultimately delivering better financial control and more accurate forecasting.

Budget summaries provide valuable forecasting insights by analyzing spending patterns, variance trends, and resource allocation efficiency, though they represent historical data rather than predictive models. When combined with market analysis and strategic planning, these summaries enable organizations to identify financial trajectories, anticipate cash flow needs, and make informed projections, ultimately delivering stronger fiscal planning and competitive advantage.

Best practices for presenting a budget summary include clear visual formatting, variance analysis highlighting key deviations, executive summary sections, categorical breakdowns, and actionable insights for decision-making. These approaches streamline financial communication by emphasizing critical metrics, comparing actual versus projected figures, and providing strategic recommendations, with many organizations finding that structured presentations enhance stakeholder understanding and accelerate budget approval processes.

Narratives and commentary enhance budget summaries by providing context for variances, explaining underlying trends, and connecting financial data to strategic decisions. Through descriptive analysis, organizations can communicate the "why" behind numbers, highlight seasonal impacts or market changes, and outline corrective actions, ultimately delivering clearer insights for stakeholders and enabling more informed financial planning.

Ratings and Reviews

80% of 100
Review Form
Write a review
Most Relevant Reviews
  1. 80%

    by Clement Patel

    Easily Understandable slides.
  2. 80%

    by Demarcus Robertson

    Colors used are bright and distinctive.
  3. 80%

    by Douglass Riley

    Topic best represented with attractive design.

3 Item(s)

per page: