


Types Of Clustering In Machine Learning Training Ppt




Try Before you Buy Download Free Sample Product
 Impress Your
 Audience
 100%
100% Editable
 Save Hours
 of Time


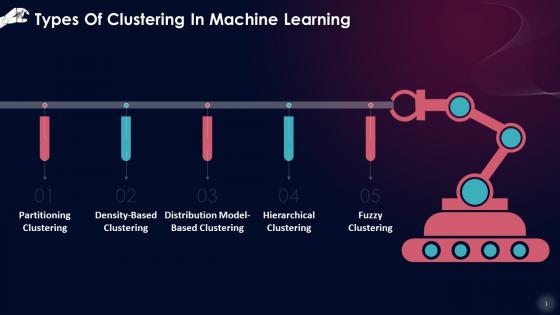
These slides provide information about types of clustering techniques. These are Partitioning Clustering, Density-Based Clustering, Distribution Model-Based Clustering, Hierarchical Clustering, and Fuzzy Clustering.
People who downloaded this PowerPoint presentation also viewed the following :
Content of this Powerpoint Presentation
Slide 1
This slide lists that there are a variety of Clustering techniques available. The following are the most common clustering approaches used in Machine Learning: Partitioning Clustering, Density-Based Clustering, Distribution Model-Based Clustering, Hierarchical Clustering and Fuzzy Clustering.
Slide 2
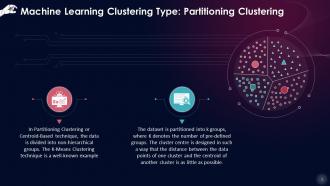
This slide illustrates that the data is divided into non-hierarchical groups in Partitioning Clustering or Centroid-Based technique. The K-Means Clustering technique is a well-known example. The dataset is partitioned into K groups, where K denotes the number of pre-defined groups. The cluster center is designed in such a way that the distance between the data points of one cluster and the centroid of another cluster is as little as possible.
Slide 3
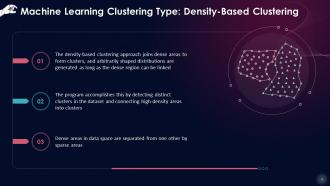
This slide states that the density-based clustering approach joins dense areas to form clusters, and arbitrarily shaped distributions are generated as long as the dense region can be linked. The program accomplishes this by detecting distinct clusters in the dataset and connecting high-density areas into clusters.
Instructor Notes: If the dataset has high density and multiple dimensions, these algorithms may struggle to cluster the data points.
Slide 4
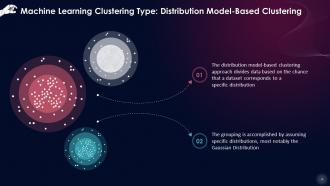
This slide explains that the distribution model-based clustering approach divides data based on the chance that a dataset corresponds to a specific distribution. The grouping is accomplished by assuming specific distributions, most notably the Gaussian Distribution.
Instructor Notes: The Expectation-Maximization Clustering method, which employs Gaussian Mixture Models, is an example of this kind (GMM) of clustering.
Slide 5
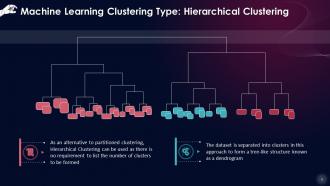
This slide showcases that as an alternative to partitioned clustering, Hierarchical Clustering can be used as there is no requirement to list the number of clusters to be formed. The dataset is separated into clusters to form a tree-like structure known as a dendrogram.
Slide 6
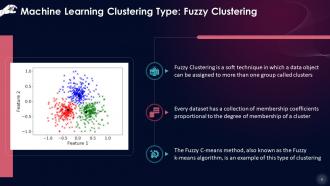
This slide states that Fuzzy Clustering is a soft technique in which a data object can be assigned to more than one group called clusters. Every dataset has a collection of membership coefficients proportional to the degree of membership of a cluster.
Types Of Clustering In Machine Learning Training Ppt with all 22 slides:
Use our Types Of Clustering In Machine Learning Training Ppt to effectively help you save your valuable time. They are readymade to fit into any presentation structure.








FAQs for Types Of Clustering In Machine
So there are basically four types you'll run into. K-means and other partitioning methods are super straightforward - you pick how many clusters you want upfront and it splits everything up. Hierarchical clustering builds these tree structures by either merging stuff together or breaking it apart. Then there's density-based like DBSCAN, which is honestly pretty cool because it finds clusters in crowded areas and handles wonky shapes way better than k-means (k-means is obsessed with making everything circular). Distribution-based assumes your data follows patterns like Gaussian curves. Go with partitioning if you want something quick and simple. Hierarchical's great when you're not sure how many clusters you need. Density-based is clutch for messy real-world data.
So clustering algorithms need some way to figure out which data points are actually similar, you know? That's where distance metrics come in. Euclidean distance is probably your best bet to start with - it's just straight-line distance like you'd measure with a ruler. Works great for most numerical stuff. Manhattan distance does the city-block thing instead. Then there's cosine similarity which is clutch for text analysis or high-dimensional data. Oh, and Hamming distance if you're dealing with categorical stuff. Honestly though, just go with Euclidean first and see how it performs before getting fancy.
So hierarchical clustering is perfect for stuff like gene analysis or customer segmentation where you actually want to see how groups relate to each other. You get this cool tree diagram that shows clusters forming at every level - way more insightful than just getting final groups. No guessing how many clusters you need either, which honestly beats the k-means guessing game. Only problem? It's slow as hell on big datasets. I'd start with smaller data where you care more about understanding patterns than speed. Works great when you're exploring and need that visual breakdown.
Your algorithm choice totally changes what you'll find. K-means forces everything into circles even when your data looks nothing like that. DBSCAN's great for weird shapes but misses subtle stuff. Hierarchical clustering shows nested patterns the others ignore completely. Honestly, the differences can be pretty dramatic - I've seen datasets where results were night and day. Don't just pick one and stop there. Run maybe 2-3 different methods and see what overlaps. Those consistent patterns? That's where the real insights live.
Dude, you NEED to scale your features first - learned this the hard way. Distance-based clustering gets totally wrecked when one feature has way bigger numbers than others. Like if you're clustering people by age (20-80) and salary (20k-200k), the salary differences will completely dominate everything. Your clusters end up just reflecting whoever makes more money instead of actual meaningful groups. I always standardize everything now - just saves so much headache later. Trust me, your results will actually make sense once you do this. It's such a simple fix but makes a huge difference.
Yeah totally! You just gotta convert it to something structured first. With text, I'd do TF-IDF or word embeddings to make vectors, then run k-means or hierarchical clustering on those. Images work similarly - pull features with CNNs or something like HOG descriptors. DBSCAN's honestly my go-to since it handles weird cluster shapes better than k-means. Most people screw up the feature extraction part though. Oh, and don't overthink it initially - start basic with TF-IDF before getting fancy with embeddings.
Oh man, the cluster count thing will drive you crazy - k-means especially. I always mess up feature scaling too, then wonder why everything looks wonky. High-dimensional data is another headache since distances get weird. Outliers will totally mess with your clusters. K-means only works well with circular-ish clusters, but real data? Yeah, it's never that clean. Different algorithms handle different shapes better. Always plot your results first - saved me so many times. Try a few different methods and check silhouette scores to see if you're actually getting decent clusters.
So silhouette scores basically tell you if your clustering makes sense or not. For each data point, it compares how close it is to its own cluster vs the next closest one. Goes from -1 to 1 - anything negative means your clusters are trash, honestly. I shoot for 0.5 or higher if I want decent results. The cool part is you can use it to test different cluster numbers. Like, should I use 3 clusters or 5? Just run both and see which gives better average scores. Super handy for comparing algorithms too.
Yeah, so clustering gets really messy in high dimensions because all your data points start looking the same distance apart. Like, your algorithm literally can't tell what should be grouped together anymore - k-means just falls apart. Try PCA first, it's dead simple and usually fixes things right away. You could also just pick better features instead of using everything. Oh, and some algorithms like spectral clustering actually don't hate high dimensions as much. t-SNE works too but honestly PCA's probably your quickest win here.
So DBSCAN is clutch because you don't have to guess cluster numbers beforehand - it figures that out on its own. Plus it actually spots outliers instead of cramming every data point somewhere it doesn't belong. GMMs are solid for messy, overlapping clusters since they handle non-circular shapes way better than k-means. They also give you probability scores, which is super helpful for knowing how confident your assignments are. Honestly, if your data's complex or noisy (and let's be real, it usually is), these'll save you so much frustration compared to basic methods.
So clustering is pretty cool for customer segmentation - you can group people by their shopping habits or demographics to nail your marketing campaigns. Healthcare though? That's where it gets wild. Doctors use it to spot disease patterns by clustering patient symptoms, or they'll analyze medical scans to catch stuff radiologists might miss. My friend works in genetics and she's always talking about how they cluster genetic profiles to figure out which treatments work best. Oh, and it speeds up diagnoses too since you're basically teaching computers to recognize patterns. Just figure out what groups would actually matter for your project first, then the algorithm handles the rest.
Just throw clustering right into your preprocessing - works really well actually. I usually segment the data first, then train separate models for each cluster. Customer stuff is perfect for this since people behave so differently. Way better accuracy when your models aren't trying to handle everything at once. Anomaly detection is another solid use case. Oh, and you can use the cluster labels as extra features too, which is kinda neat. K-means is probably your best starting point - it's simple and you'll see pretty quick if it's helping your downstream performance or not.
Honestly, bias amplification is the big one to worry about. Your algorithm might group people in ways that just reinforce discrimination around race or gender stuff. Privacy's another headache - even "anonymous" clusters can get reverse-engineered to identify specific people, which is sketchy. Oh and consent too, since most people don't know their data's being analyzed like this. I'd definitely audit your clusters for fairness issues. Make sure you're actually anonymizing properly, not just thinking you are. Be upfront about what you're doing with the data.
Dude, visualizations are seriously clutch for clustering. Just plot your data points in 2D using your best features - you'll instantly see if the clusters actually make sense or if it's total garbage. Scatter plots show separation between groups, heatmaps reveal which variables matter most. 3D plots look cool but honestly they're usually more confusing than helpful. The real win? Spotting weird outliers and figuring out if you picked the right number of clusters. Plus your boss will actually understand what you found instead of glazing over at a bunch of metrics. Start simple though - two dimensions first.
Dude, clustering is getting wild with all the AI stuff happening. Deep learning can now auto-detect how many clusters you actually need, which is pretty sick. Plus neural networks handle messy mixed data way better than the old school methods ever could. The crazy part? We've got distributed algorithms now that can process absolutely massive datasets across tons of machines. Graph neural networks are making relationship clustering way more sophisticated too - honestly didn't think we'd get here this fast. You should definitely peek at some recent deep clustering papers if you're curious where it's all going.
-
The slides come with appealing color schemes and relevant content that helped me deliver a stunning presentation without any hassle!
-
The best collection of PPT templates!! Totally worth the money.