Visual Analytics Branch Of Visualization Research Data Visualization Ppt Powerpoint Presentation Ideas
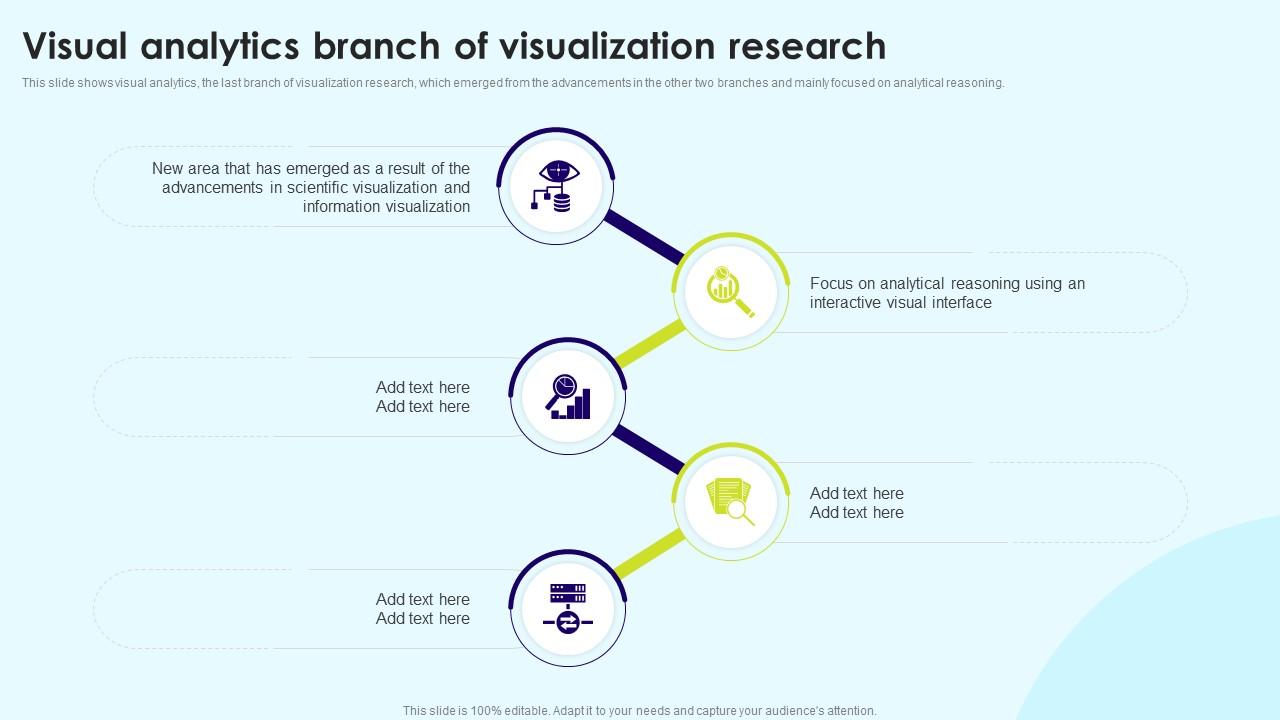
This slide shows visual analytics, the last branch of visualization research, which emerged from the advancements in the other two branches and mainly focused on analytical reasoning.
This slide shows visual analytics, the last branch of visualization research, which emerged from the advancements in the ot..
- Google Slides is a new FREE Presentation software from Google.
- All our content is 100% compatible with Google Slides.
- Just download our designs, and upload them to Google Slides and they will work automatically.
- Amaze your audience with SlideTeam and Google Slides.
-
Want Changes to This PPT Slide? Check out our Presentation Design Services
- WideScreen Aspect ratio is becoming a very popular format. When you download this product, the downloaded ZIP will contain this product in both standard and widescreen format.
-

- Some older products that we have may only be in standard format, but they can easily be converted to widescreen.
- To do this, please open the SlideTeam product in Powerpoint, and go to
- Design ( On the top bar) -> Page Setup -> and select "On-screen Show (16:9)” in the drop down for "Slides Sized for".
- The slide or theme will change to widescreen, and all graphics will adjust automatically. You can similarly convert our content to any other desired screen aspect ratio.
Compatible With Google Slides

Get This In WideScreen
You must be logged in to download this presentation.
PowerPoint presentation slides
This slide shows visual analytics, the last branch of visualization research, which emerged from the advancements in the other two branches and mainly focused on analytical reasoning. Increase audience engagement and knowledge by dispensing information using Visual Analytics Branch Of Visualization Research Data Visualization Ppt Powerpoint Presentation Ideas. This template helps you present information on five stages. You can also present information on Scientific Visualization, Information Visualization, Interactive Visual Interface using this PPT design. This layout is completely editable so personaize it now to meet your audiences expectations.
People who downloaded this PowerPoint presentation also viewed the following :
Visual Analytics Branch Of Visualization Research Data Visualization Ppt Powerpoint Presentation Ideas with all 6 slides:
Use our Visual Analytics Branch Of Visualization Research Data Visualization Ppt Powerpoint Presentation Ideas to effectively help you save your valuable time. They are readymade to fit into any presentation structure.
-
They had the topic I was looking for in a readymade presentation…helped me meet my deadline.
-
Top Quality presentations that are easily editable.


