


Visualization Research Branches Powerpoint Presentation Slides


Try Before you Buy Download Free Sample Product
 Impress Your
 Audience
Editable
of Time


Visualization research branches create tools to aid in the exploratory analysis process and expand our knowledge of how visuals assist in data interpretation. Grab our efficiently designed Visualization Research Branches template that gives a brief idea about the current situation in the organization and its existing issues to understand the need for visualization research branches. In this Visualization Research Branches PowerPoint Presentation, we have covered the importance of visualization research. In addition, this insightful PPT contains an introduction to visualization research branches, such as scientific, information visualization, and visual analytics. Furthermore, this Visualization research branch template includes an overview of different analyses for data visualization, use cases, and the tools and software for visualization. Lastly, this deck comprises a 30-60-90 days plan, roadmap, sales performance dashboard, and impact of visualization research branches implementation in the organization. Customize this 100 percent editable template now.
People who downloaded this PowerPoint presentation also viewed the following :
Content of this Powerpoint Presentation
Slide 1: This slide displays title i.e. 'Visualization Research Branches' and your Company Name.
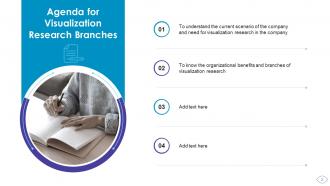
Slide 2: This slide presents agenda.
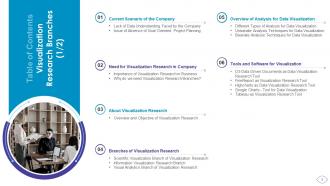
Slide 3: This slide exhibits table of contents.
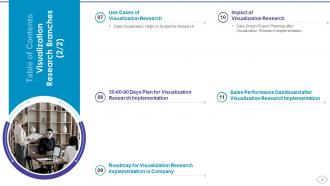
Slide 4: This slide also shows table of contents.
Slide 5: This slide depicts title for two topics that are to be covered next in the template.
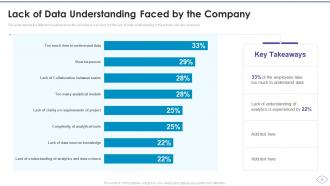
Slide 6: This slide depicts the different issues faced by the company in a project, but the lack of data understanding is the primary concern among all.
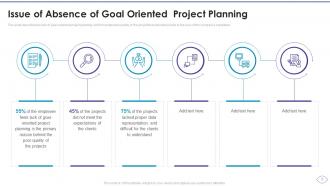
Slide 7: This slide describes the lack of goal-oriented project planning, which hampers the quality of the project.
Slide 8: This slide depicts title for two topics that are to be covered next in the template.
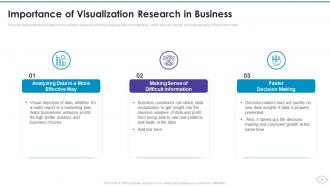
Slide 9: This slide represents the importance of visualization research, including analyzing data more effectively, faster decision making, etc.
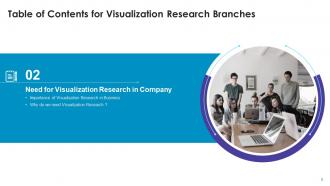
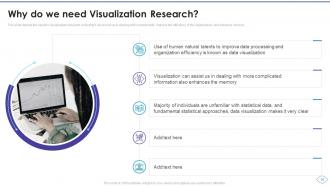
Slide 10: This slide depicts the need for visualization research, including it can assist us in dealing with complex data, improve the efficiency of the organization, etc.
Slide 11: This slide depicts title for the topic that is to be covered next in the template.
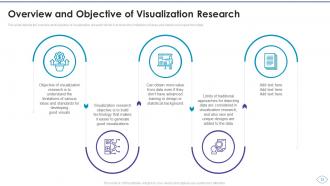
Slide 12: This slide depicts the overview and objective of visualization research which is to know the limitations of ideas and obtain more value from data.
Slide 13: This slide depicts title for three topics that are to be covered next in the template.
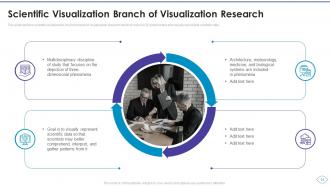
Slide 14: This slide explains scientific visualization, the first branch of visualization research which focuses on 3D phenomena and visually represents scientific data.
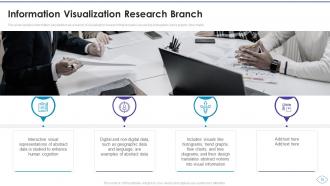
Slide 15: This slide explains information visualization as a branch of visualization research that includes visuals like histograms, trend graphs, flow charts.
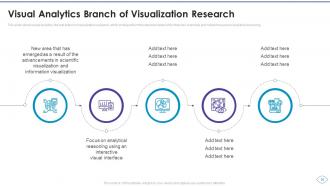
Slide 16: This slide shows visual analytics, the last branch of visualization research, which emerged from the advancements in the other two branches.
Slide 17: This slide depicts title for three topics that are to be covered next in the template.
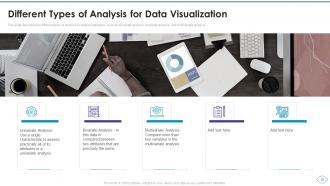
Slide 18: This slide describes the different types of analysis for data visualization, such as univariate analysis, bivariate analysis, and multivariate analysis.
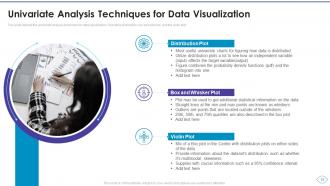
Slide 19: This slide depicts the univariate analysis technique for data visualization, including distribution, box and whisker, and the violin plot.
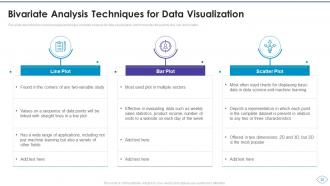
Slide 20: This slide describes the second analysis technique, bivariate analysis for data visualization, which includes three plots line, bar, and scatter.
Slide 21: This slide depicts title for five topics that are to be covered next in the template.
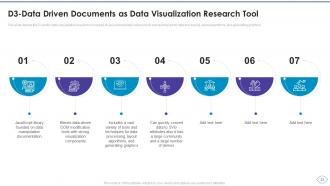
Slide 22: This slide depicts the D3 as the data visualization research tool based on java and includes various tools and techniques for data processing, etc.
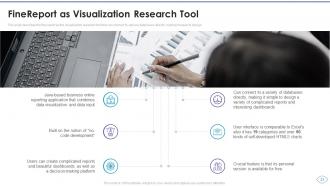
Slide 23: This slide describes the fine report as the visualization research tool that can connect to various databases directly, making it easier to design.
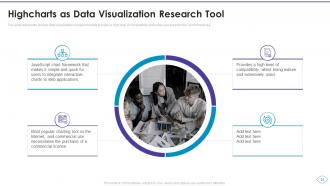
Slide 24: This slide represents another data visualization research tool that provides a high level of compatibility and is also a popular tool for commercial use.
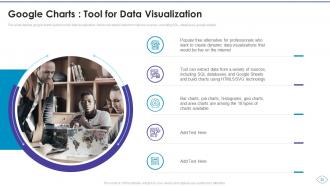
Slide 25: This slide depicts google charts as the tool for data visualization, which can extract data from various sources, including SQL, databases, google sheets.
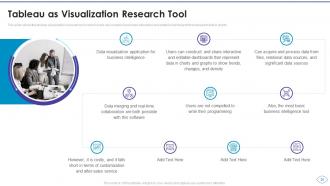
Slide 26: This slide shows the tableau visualization research tool in which users can construct and share interactive and editable dashboards that represent data in charts.
Slide 27: This slide depicts title for the topic that is to be covered next in the template.
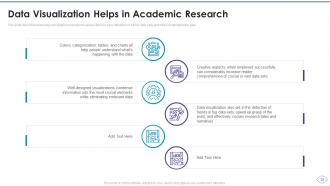
Slide 28: This slide describes that using visualization in academic areas caters to easy detection of trendy data sets and helps understand the data.
Slide 29: This slide depicts title for the topic that is to be covered next in the template.
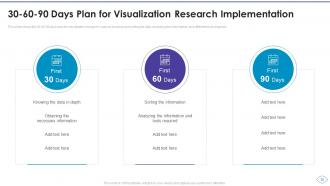
Slide 30: This slide shows the 30-60-90 days plan for visualization research, such as knowing and sorting the data, analyzing the information, etc.
Slide 31: This slide depicts title for the topic that is to be covered next in the template.
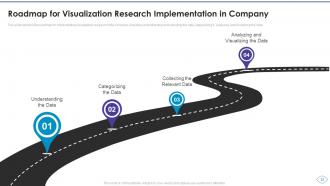
Slide 32: This slide explains the roadmap for implementing visualization research in the company, including understanding and collecting the data, etc.
Slide 33: This slide depicts title for the topic that is to be covered next in the template.
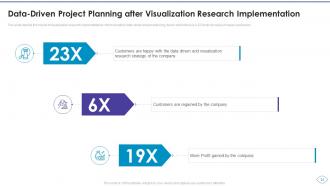
Slide 34: This slide depicts the impact of visualization research implementation, which results in data-driven project planning, etc.
Slide 35: This slide depicts title for the topic that is to be covered next in the template.
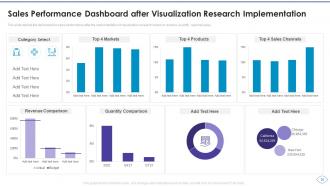
Slide 36: This slide depicts the dashboard for sales performance after the implementation of visualization research based on revenue, quantity, regional sales.
Slide 37: This is the icons slide.
Slide 38: This slide presents title for additional slides.
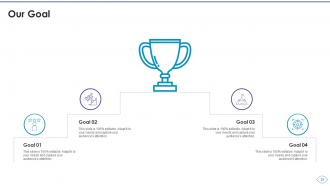
Slide 39: This slide displays goals of the company.
Slide 40: This slide depicts posts for past experiences of clients.
Slide 41: This slide highlights magnifying glass.
Slide 42: This slide displays Venn.
Slide 43: This slide exhibits yearly timeline.
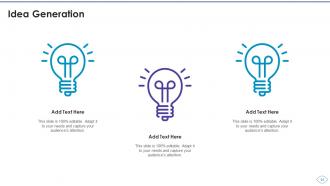
Slide 44: This slide exhibits ideas generated.
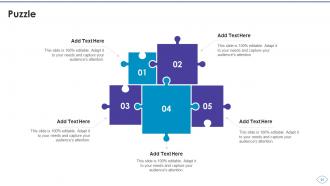
Slide 45: This slide displays puzzle.
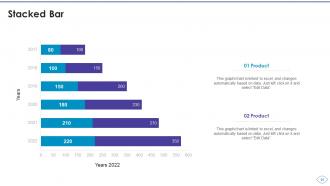
Slide 46: This slide exhibits yearly stacked bar charts for different products. The charts are linked to Excel.
Slide 47: This is thank you slide & contains contact details of company like office address, phone no., etc.
Visualization Research Branches Powerpoint Presentation Slides with all 52 slides:
Use our Visualization Research Branches Powerpoint Presentation Slides to effectively help you save your valuable time. They are readymade to fit into any presentation structure.


FAQs for Visualization Research Branches
Visualization research is the process of representing complex data through various visuals and techniques. It is essential as it helps in analyzing data more effectively, making faster decisions, and improving organizational efficiency.
There are three branches of visualization research: scientific visualization, information visualization, and visual analytics. Scientific visualization focuses on 3D phenomena and represents scientific data visually, while information visualization includes visuals like histograms, trend graphs, and flow charts. Visual analytics is a more advanced branch that emerged from the advancements in the other two branches.
The three types of analysis techniques for data visualization are univariate analysis, bivariate analysis, and multivariate analysis.
Some popular data visualization research tools are D3, Fine Report, Tableau, and Google Charts. These tools have different features and capabilities and can be used for various types of data visualization.
Visualization research can help organizations analyze and interpret data more effectively, making faster decisions and improving efficiency. It can also help in identifying patterns and trends, improving communication, and identifying areas that need improvement.
-
Their professional templates are very impressive, even my manager was curious about the source. I am very grateful.
-
Kudos to SlideTeam for achieving the high success rate in delivering the top-notch slides.