3 linear venn diagram for business partnership and process sample of ppt
Formulate an agenda for the future with our 3 Linear Venn Diagram For Business Partnership And Process Sample Of Ppt. Initiate improvements for generations to come.
Formulate an agenda for the future with our 3 Linear Venn Diagram For Business Partnership And Process Sample Of Ppt. Init..
- Google Slides is a new FREE Presentation software from Google.
- All our content is 100% compatible with Google Slides.
- Just download our designs, and upload them to Google Slides and they will work automatically.
- Amaze your audience with SlideTeam and Google Slides.
-
Want Changes to This PPT Slide? Check out our Presentation Design Services
- WideScreen Aspect ratio is becoming a very popular format. When you download this product, the downloaded ZIP will contain this product in both standard and widescreen format.
-

- Some older products that we have may only be in standard format, but they can easily be converted to widescreen.
- To do this, please open the SlideTeam product in Powerpoint, and go to
- Design ( On the top bar) -> Page Setup -> and select "On-screen Show (16:9)” in the drop down for "Slides Sized for".
- The slide or theme will change to widescreen, and all graphics will adjust automatically. You can similarly convert our content to any other desired screen aspect ratio.
Compatible With Google Slides

Get This In WideScreen
You must be logged in to download this presentation.
PowerPoint presentation slides
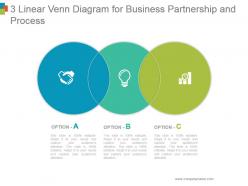
Presenting 3 linear venn diagram for business partnership and process sample of ppt. This is a 3 linear venn diagram for business partnership and process sample of ppt. This is a three stage process. The stages in this process are business, marketing, strategy, success, management.
People who downloaded this PowerPoint presentation also viewed the following :
Content of this Powerpoint Presentation
Description:
The image is a PowerPoint slide that features a linear Venn diagram designed to illustrate business partnerships and processes. It contains three overlapping circles, each labeled as Option A, Option B, and Option C, which suggests different aspects or entities that can interact in a business context.
Each circle includes an icon:
Option A has a handshake icon, which typically represents agreements or partnerships.
Option B includes a light bulb icon, commonly used to denote ideas, innovation, or enlightenment.
Option C shows an icon of a person with a prize or certificate, possibly representing achievement, recognition, or human resources.
The areas where the circles overlap could represent the synergy or the combined benefits of these aspects when they work together or the areas of commonality between them.
The slide indicates that it is "100% editable," signaling to the presenter that they can customize the text to fit their specific needs. This kind of diagram is useful in business presentations to discuss strategic alliances, collaborative innovations, or integrated processes that encompass different departments or companies.
At the bottom, there's a placeholder for the company name, allowing for customization and branding. This slide is a strategic communication tool, ideal for visually representing complex business relationships and processes.
Use Cases:
Venn diagrams are excellent tools for presentations that require the depiction of intersections and relationships between different concepts or entities.
1. Technology:
Use: Highlighting product integration
Presenter: Product Managers
Audience: Development Teams, Stakeholders
2. Education:
Use: Demonstrating subject overlap
Presenter: Educators
Audience: Students, Academic Staff
3. Healthcare:
Use: Showing patient care collaboration
Presenter: Healthcare Administrators
Audience: Medical Professionals, Department Heads
4. Marketing:
Use: Cross-channel strategy planning
Presenter: Marketing Directors
Audience: Marketing Teams, Sales Departments
5. Environmental Services:
Use: Interdisciplinary project impact
Presenter: Environmental Scientists
Audience: Policy Makers, Activists
6. Human Resources:
Use: Merging personnel skill sets
Presenter: HR Consultants
Audience: Managers, Team Leaders
7. Finance:
Use: Explaining financial products synergy
Presenter: Financial Advisors
Audience: Clients, Investment Teams
3 linear venn diagram for business partnership and process sample of ppt with all 5 slides:
Our 3 Linear Venn Diagram For Business Partnership And Process Sample Of Ppt give greater depth to your anecdotes. The educational effect will get enhanced.
-
Great designs, really helpful.
-
Excellent design and quick turnaround.


