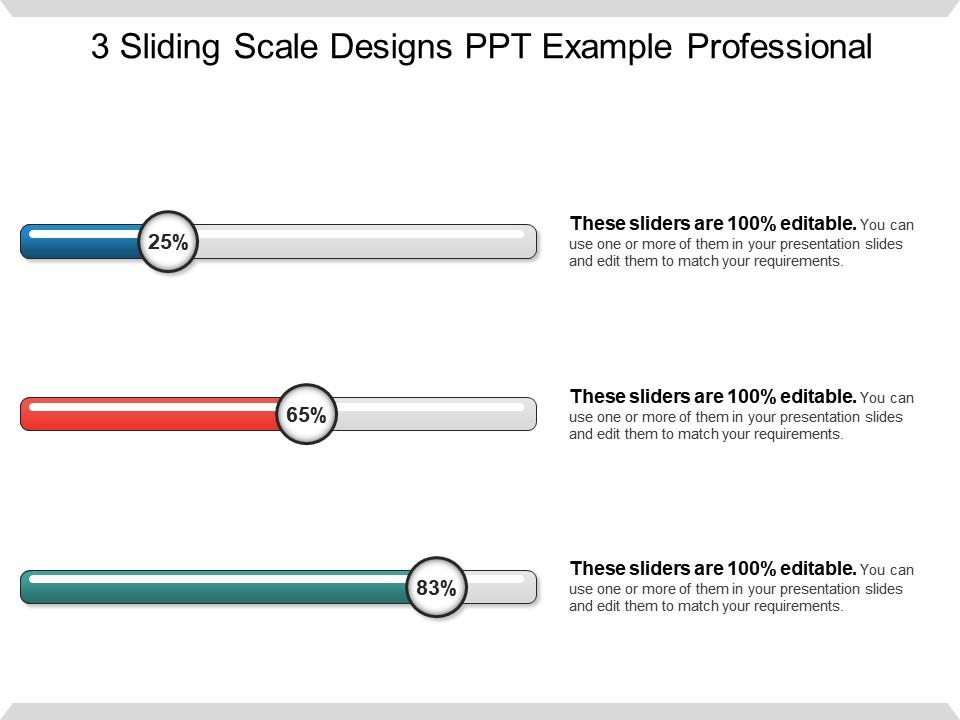
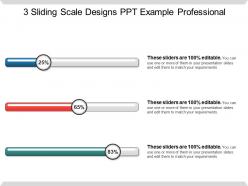
3 sliding scale designs ppt examples professional
Try Before you Buy Download Free Sample Product
Audience
Editable
of Time
Ensure your efforts don't get dissipated with our 3 Sliding Scale Designs Ppt Examples Professional. They enhance functional efficiency.
People who downloaded this PowerPoint presentation also viewed the following :
3 sliding scale designs ppt examples professional with all 5 slides:
Enable folks to function fearlessly with our 3 Sliding Scale Designs Ppt Examples Professional. It encourages greater freedom.
FAQs for 3 sliding scale designs
Sliding scale designs are flexible pricing or service models that adjust based on specific variables like income, usage, or demand, allowing organizations to accommodate diverse customer segments while maintaining accessibility. These adaptive frameworks enable healthcare providers, educational institutions, and software companies to deliver equitable services through income-based fees, tiered subscriptions, and dynamic pricing, ultimately expanding market reach while ensuring sustainable revenue streams.
Sliding scale designs enhance user interaction by providing intuitive visual feedback, enabling precise value selection, and reducing cognitive load through familiar metaphors. These interactive elements streamline decision-making processes in e-commerce pricing, financial applications, and customization tools, while delivering improved engagement rates and user satisfaction across mobile and desktop platforms.
Key principles include visual hierarchy, consistent spacing, clear progression indicators, readable typography, and intuitive navigation elements. These design elements streamline audience comprehension by establishing logical flow, maintaining visual cohesion, and enabling seamless transitions between content levels, with many presenters finding that strategic scaling enhances audience engagement while delivering more impactful business communications.
Sliding scales prove more effective than fixed-point designs when dealing with continuous data ranges, dynamic pricing models, performance metrics, and user customization scenarios. These designs excel in financial dashboards, survey feedback systems, and e-commerce platforms where businesses need flexible input mechanisms, ultimately delivering enhanced user engagement and more nuanced data collection for strategic decision-making.
Common pitfalls include overcrowding slides with excessive data points, using inconsistent scale intervals that mislead audiences, and failing to clearly label measurement units or timeframes. Many presenters also struggle with choosing inappropriate color schemes that reduce readability, while successful organizations find that maintaining consistent visual hierarchy and ensuring mobile-friendly scaling ultimately delivers clearer communication and stronger audience engagement.
Sliding scale designs enhance data visualization by enabling dynamic range adjustments, real-time filtering, interactive exploration, and granular control over datasets. Through intuitive slider interfaces, analysts can seamlessly adjust parameters, zoom into specific timeframes, and isolate key metrics, while stakeholders can explore complex data independently, ultimately delivering more engaging presentations and faster decision-making processes.
Sliding scale designs can be highly effective in educational materials by enabling adaptive content delivery, progressive skill building, and personalized learning pathways that adjust to individual student comprehension levels. Educational institutions increasingly use these frameworks in online courses, assessment tools, and curriculum design, allowing instructors to seamlessly scale content difficulty while maintaining engagement, ultimately delivering more effective learning outcomes and improved student retention rates.
User feedback plays a crucial role in optimizing sliding scale designs by revealing usability patterns, preference variations, and interaction challenges across different demographic groups. Through A/B testing, surveys, and behavioral analytics, organizations can refine slider sensitivity, visual indicators, and range parameters, with many e-commerce and SaaS companies finding that user-driven iterations significantly enhance conversion rates and overall user satisfaction.
Color schemes and aesthetics significantly impact sliding scale effectiveness by enhancing visual hierarchy, improving user comprehension, and guiding decision-making through strategic contrast and flow. Well-designed scales using complementary colors, clear typography, and intuitive visual cues enable faster user interactions, reduce cognitive load, and ultimately deliver better engagement rates, with many organizations finding that thoughtful aesthetic choices increase completion rates by streamlining the user experience.
JavaScript libraries like D3.js, Chart.js, and Slider.js, CSS frameworks including Bootstrap and Foundation, and design tools such as Figma, Adobe XD, and Sketch excel at creating interactive sliding scale designs. These technologies streamline development by offering customizable components, responsive frameworks, and intuitive interfaces, with many organizations finding that combining visual design tools with robust JavaScript libraries delivers seamless user experiences and enhanced engagement.
Cultural differences significantly influence sliding scale design effectiveness through varying color interpretations, reading patterns, visual hierarchy preferences, and cultural symbols. Western audiences typically prefer left-to-right progressions while Asian markets often favor vertical orientations, with many international organizations finding that localized sliding scale elements enhance user engagement and comprehension across diverse markets, ultimately delivering better customer experiences.
Sliding scales in persuasive presentations create psychological anchoring effects, reduce decision paralysis, and enhance perceived control over choices. These design elements leverage cognitive biases by establishing reference points, making extreme options seem more reasonable, and allowing audiences to self-select comfort levels, ultimately increasing engagement and conversion rates across pricing, feature, and commitment decisions.
Designers ensure accessibility in sliding scale designs through high contrast ratios, keyboard navigation support, screen reader compatibility, and clear visual indicators for different states. These approaches enable users with visual impairments, motor disabilities, and cognitive differences to interact effectively, with many organizations finding that inclusive design ultimately delivers broader user engagement and regulatory compliance.
Key metrics for evaluating sliding scale design success include user engagement rates, task completion times, error frequencies, accessibility compliance scores, and user satisfaction ratings. These measurements enable organizations to assess usability effectiveness, identify interaction bottlenecks, and optimize user experiences, with many businesses finding that comprehensive metric analysis ultimately delivers improved conversion rates and enhanced customer retention across their digital platforms.
Motion graphics enhance sliding scale designs by incorporating animated transitions, progressive visual feedback, and dynamic data visualization that responds to user interactions. These animated elements guide users through complex information hierarchies while providing immediate visual confirmation of their selections, with many organizations finding that animated scales increase user completion rates and reduce decision fatigue across digital platforms.
-
Very well designed and informative templates.
-
Great designs, really helpful.