App business analysis vs business intelligence diagram powerpoint layout
Our App Business Analysis Vs Business Intelligence Diagram Powerpoint Layout come at an attractive cost. They help chip away at expenses.
Our App Business Analysis Vs Business Intelligence Diagram Powerpoint Layout come at an attractive cost. They help chip awa..
- Google Slides is a new FREE Presentation software from Google.
- All our content is 100% compatible with Google Slides.
- Just download our designs, and upload them to Google Slides and they will work automatically.
- Amaze your audience with SlideTeam and Google Slides.
-
Want Changes to This PPT Slide? Check out our Presentation Design Services
- WideScreen Aspect ratio is becoming a very popular format. When you download this product, the downloaded ZIP will contain this product in both standard and widescreen format.
-

- Some older products that we have may only be in standard format, but they can easily be converted to widescreen.
- To do this, please open the SlideTeam product in Powerpoint, and go to
- Design ( On the top bar) -> Page Setup -> and select "On-screen Show (16:9)” in the drop down for "Slides Sized for".
- The slide or theme will change to widescreen, and all graphics will adjust automatically. You can similarly convert our content to any other desired screen aspect ratio.
Compatible With Google Slides

Get This In WideScreen
You must be logged in to download this presentation.
PowerPoint presentation slides
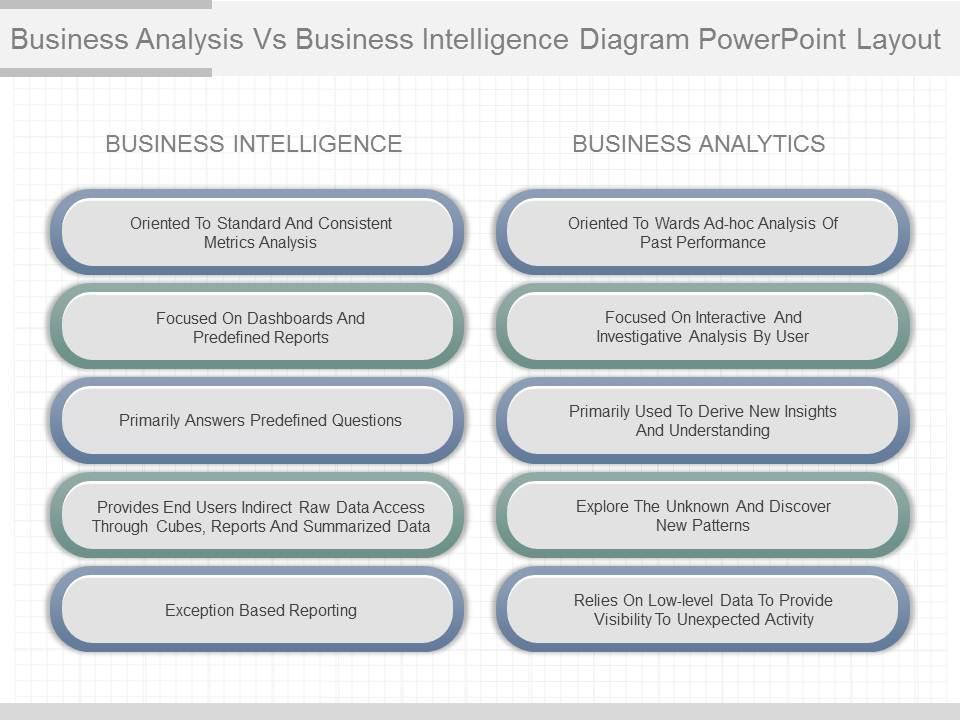
Presenting app business analysis vs business intelligence diagram powerpoint layout. This is a business analysis vs business intelligence diagram powerpoint layout. This is a ten stage process. The stages in this process are oriented to standard and consistent metrics analysis, focused on dashboards and predefined reports, primarily answers predefined questions, provides end users indirect raw data access through cubes, reports and summarized data, exception based reporting, oriented to wards ad-hoc analysis of past performance, focused on interactive and investigative analysis by user , primarily used to derive new insights and understanding.
People who downloaded this PowerPoint presentation also viewed the following :
App business analysis vs business intelligence diagram powerpoint layout with all 7 slides:
Hand down your best with our App Business Analysis Vs Business Intelligence Diagram Powerpoint Layout. Give them a great example to follow.
-
Best way of representation of the topic.
-
Best way of representation of the topic.


