Asset Allocation Investment Equity Asset Allocation Dashboard Analytics
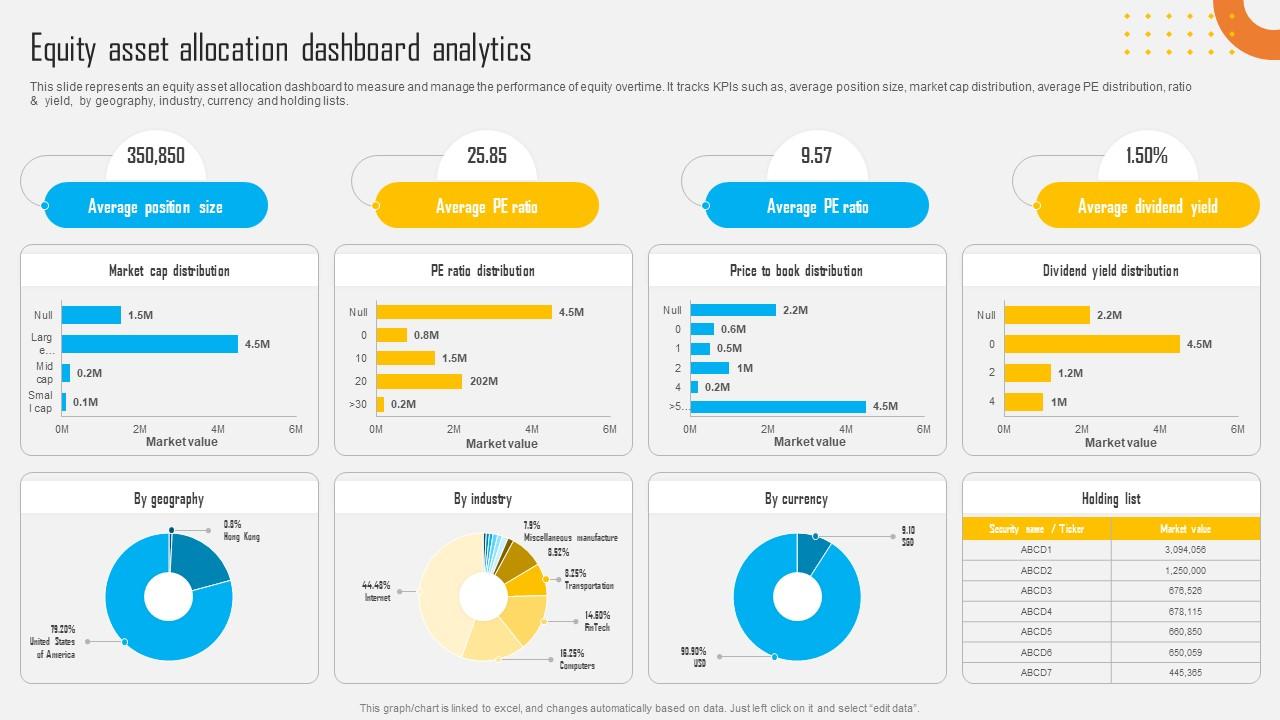
This slide represents an equity asset allocation dashboard to measure and manage the performance of equity overtime.It tracks KPIs such as, average position size, market cap distribution, average PE distribution, ratio and yield, by geography, industry, currency and holding lists.
This slide represents an equity asset allocation dashboard to measure and manage the performance of equity overtime.It trac..
- Google Slides is a new FREE Presentation software from Google.
- All our content is 100% compatible with Google Slides.
- Just download our designs, and upload them to Google Slides and they will work automatically.
- Amaze your audience with SlideTeam and Google Slides.
-
Want Changes to This PPT Slide? Check out our Presentation Design Services
- WideScreen Aspect ratio is becoming a very popular format. When you download this product, the downloaded ZIP will contain this product in both standard and widescreen format.
-

- Some older products that we have may only be in standard format, but they can easily be converted to widescreen.
- To do this, please open the SlideTeam product in Powerpoint, and go to
- Design ( On the top bar) -> Page Setup -> and select "On-screen Show (16:9)” in the drop down for "Slides Sized for".
- The slide or theme will change to widescreen, and all graphics will adjust automatically. You can similarly convert our content to any other desired screen aspect ratio.
Compatible With Google Slides

Get This In WideScreen
You must be logged in to download this presentation.
PowerPoint presentation slides
This slide represents an equity asset allocation dashboard to measure and manage the performance of equity overtime. It tracks KPIs such as, average position size, market cap distribution, average PE distribution, ratio and yield, by geography, industry, currency and holding lists. Deliver an outstanding presentation on the topic using this Asset Allocation Investment Equity Asset Allocation Dashboard Analytics Dispense information and present a thorough explanation of Quick Reallocations, High Transaction Costs, Modest Transaction Costs using the slides given. This template can be altered and personalized to fit your needs. It is also available for immediate download. So grab it now.
People who downloaded this PowerPoint presentation also viewed the following :
Asset Allocation Investment Equity Asset Allocation Dashboard Analytics with all 11 slides:
Use our Asset Allocation Investment Equity Asset Allocation Dashboard Analytics to effectively help you save your valuable time. They are readymade to fit into any presentation structure.
-
Like always a great experience with you guys. Always there on the drop of hat to help.
-
I have been using SlideTeam for the past six months. Very happy and satisfied!


