Automating Sales Processes To Increase Revenues Powerpoint Presentation Slides
Sales Automation streamlines sales process to focus more on prospects and customers. The purpose of this deck is to eliminate repetitive tasks for better productivity in order to improve revenues. This automated sales processes PPT covers the challenges faced by sales manager, decline in sales volume and comparative assessment of sales performance. It also showcases importance of sales automation, sales team organizational structure and processes. Not only this, the sales process automation PowerPoint deck also focuses on importance of sales automation and pipeline management. Further, it represents key areas of digital sales which includes marketing automation, lead tracking and order management. Talk about the ways of implementing sales process automation and choosing the best CRM software to improve sales. Incorporate the given PowerPoint presentation training delivery schedule of employees. Moreover, this PowerPoint captures impact of automation on sales performance and dashboards to monitor sales effectiveness. Build a powerful template like this for yourself and book a free demo with our research team now.
Sales Automation streamlines sales process to focus more on prospects and customers. The purpose of this deck is to elimina..
- Google Slides is a new FREE Presentation software from Google.
- All our content is 100% compatible with Google Slides.
- Just download our designs, and upload them to Google Slides and they will work automatically.
- Amaze your audience with SlideTeam and Google Slides.
-
Want Changes to This PPT Slide? Check out our Presentation Design Services
- WideScreen Aspect ratio is becoming a very popular format. When you download this product, the downloaded ZIP will contain this product in both standard and widescreen format.
-

- Some older products that we have may only be in standard format, but they can easily be converted to widescreen.
- To do this, please open the SlideTeam product in Powerpoint, and go to
- Design ( On the top bar) -> Page Setup -> and select "On-screen Show (16:9)” in the drop down for "Slides Sized for".
- The slide or theme will change to widescreen, and all graphics will adjust automatically. You can similarly convert our content to any other desired screen aspect ratio.
Compatible With Google Slides

Get This In WideScreen
You must be logged in to download this presentation.
PowerPoint presentation slides
Deliver this complete deck to your team members and other collaborators. Encompassed with stylized slides presenting various concepts, this Automating Sales Processes To Increase Revenues Powerpoint Presentation Slides is the best tool you can utilize. Personalize its content and graphics to make it unique and thought-provoking. All the sixty four slides are editable and modifiable, so feel free to adjust them to your business setting. The font, color, and other components also come in an editable format making this PPT design the best choice for your next presentation. So, download now.
People who downloaded this PowerPoint presentation also viewed the following :
Content of this Powerpoint Presentation
Slide 1: This is the cover slide of Automating Sales Processes to Increase Revenues
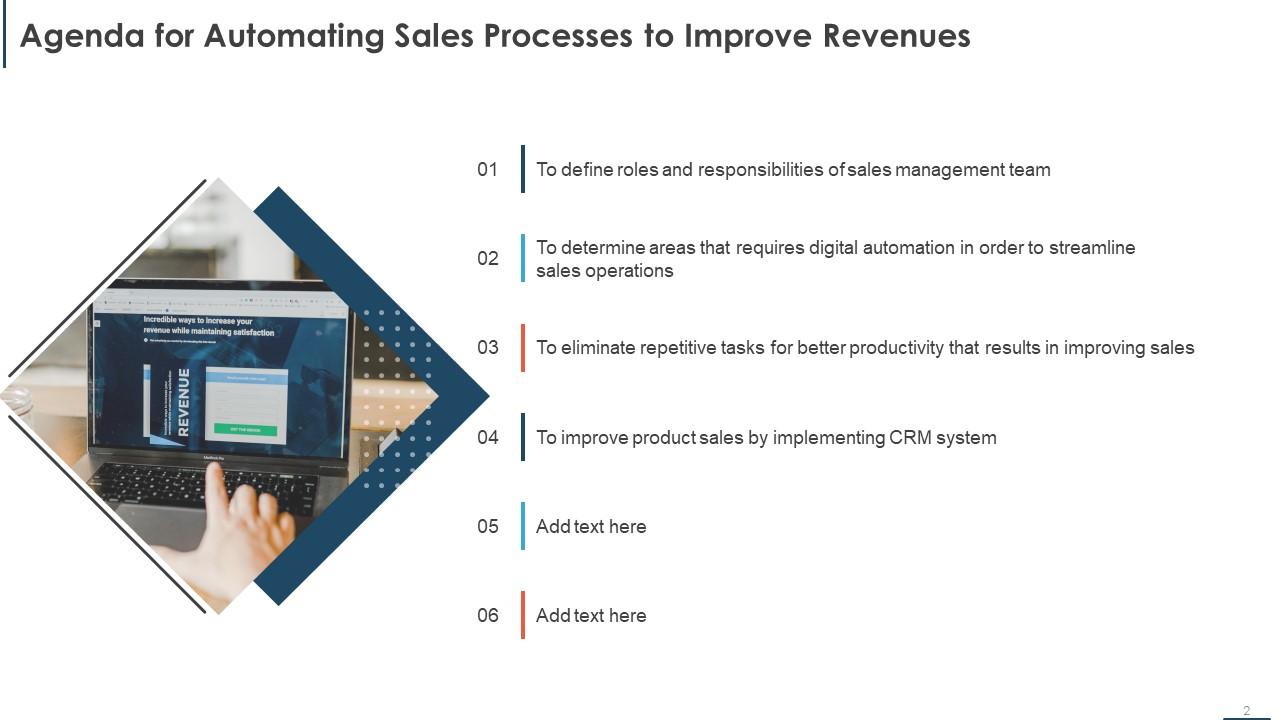
Slide 2: This slide presents Agenda for Automating Sales Processes to Improve Revenues
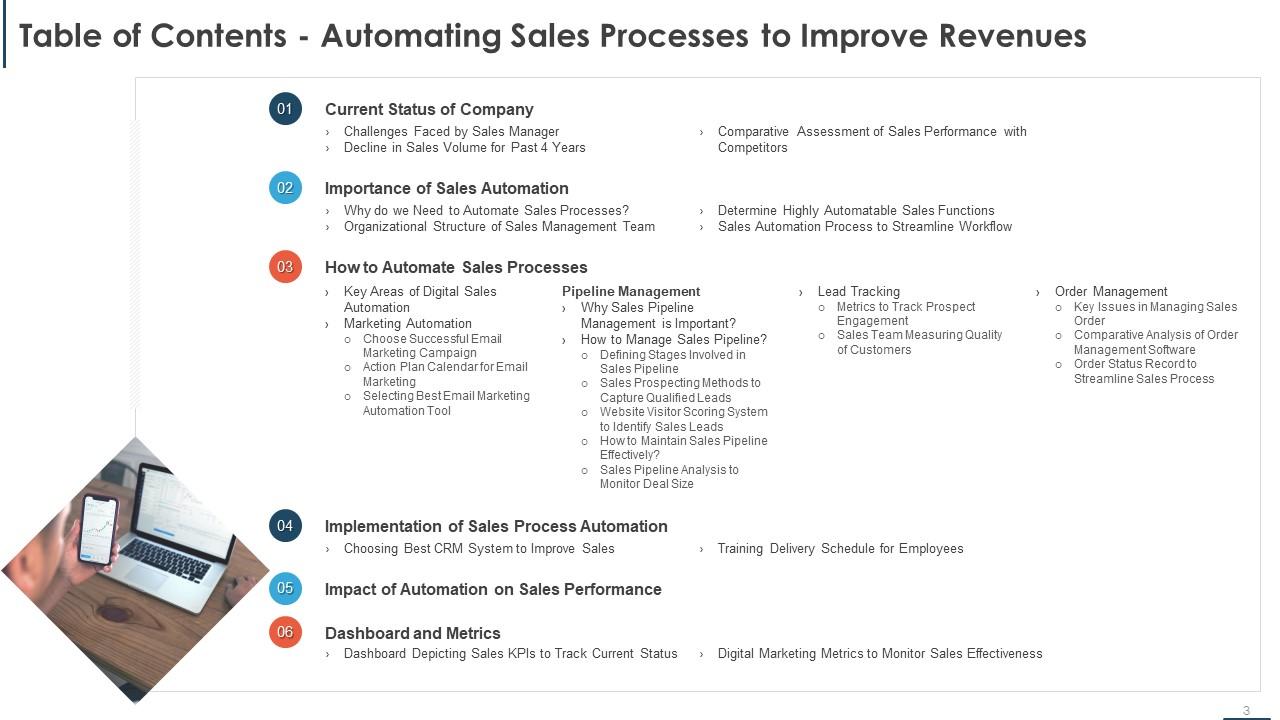
Slide 3: This is a Table of Contents slide - Automating Sales Processes to Improve Revenues
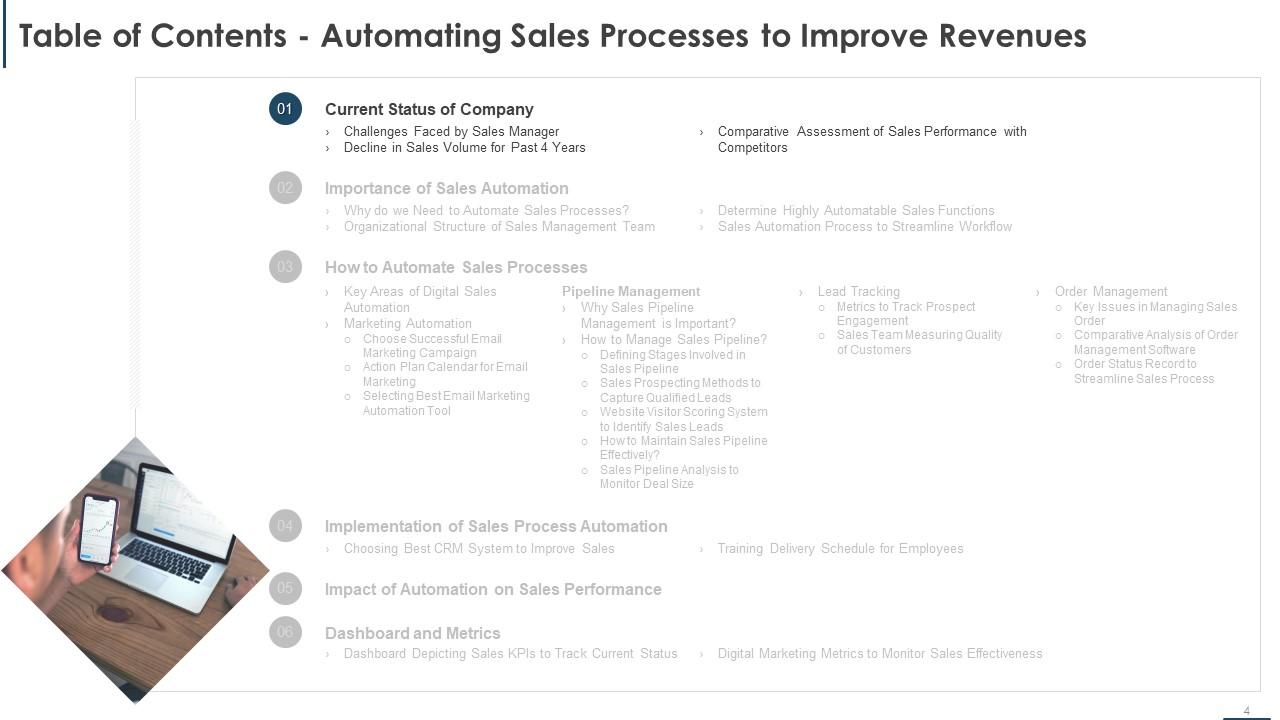
Slide 4: This is a Table of Contents - Automating Sales Processes to Improve Revenues
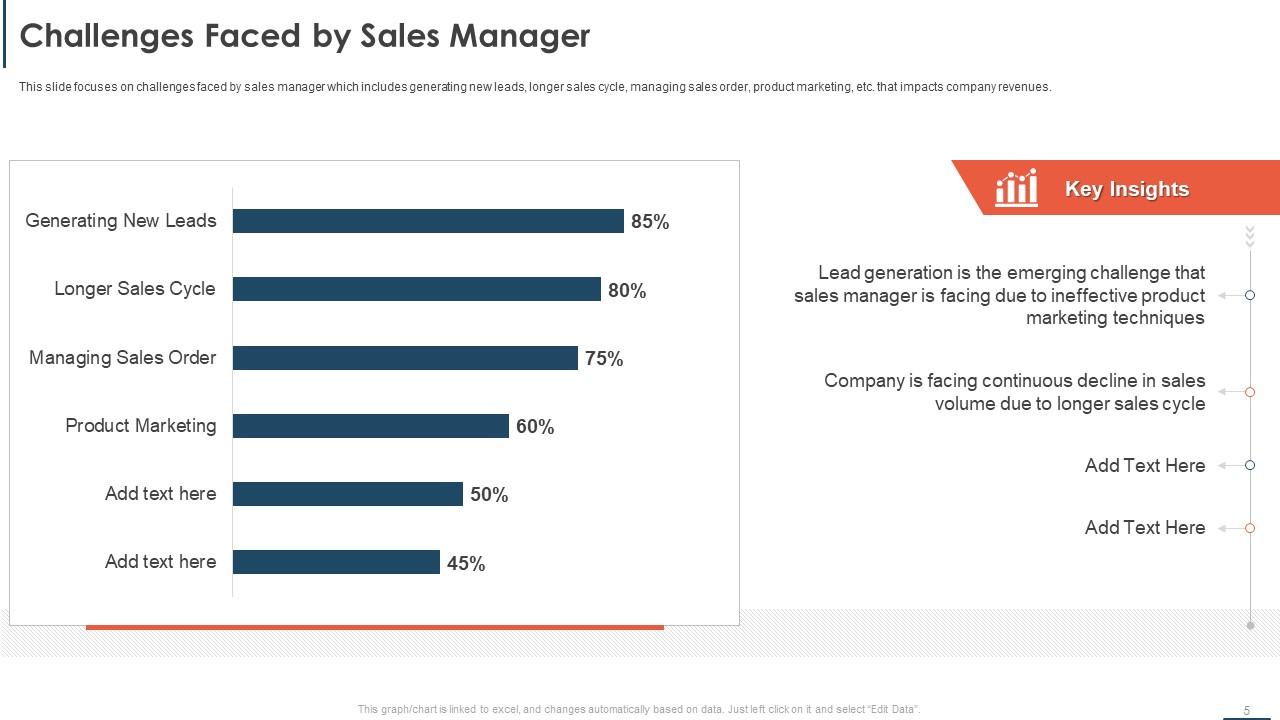
Slide 5: This slide focuses on challenges faced by sales manager which includes generating new leads, longer sales cycle, managing sales order, product marketing, etc. that impacts company revenues.
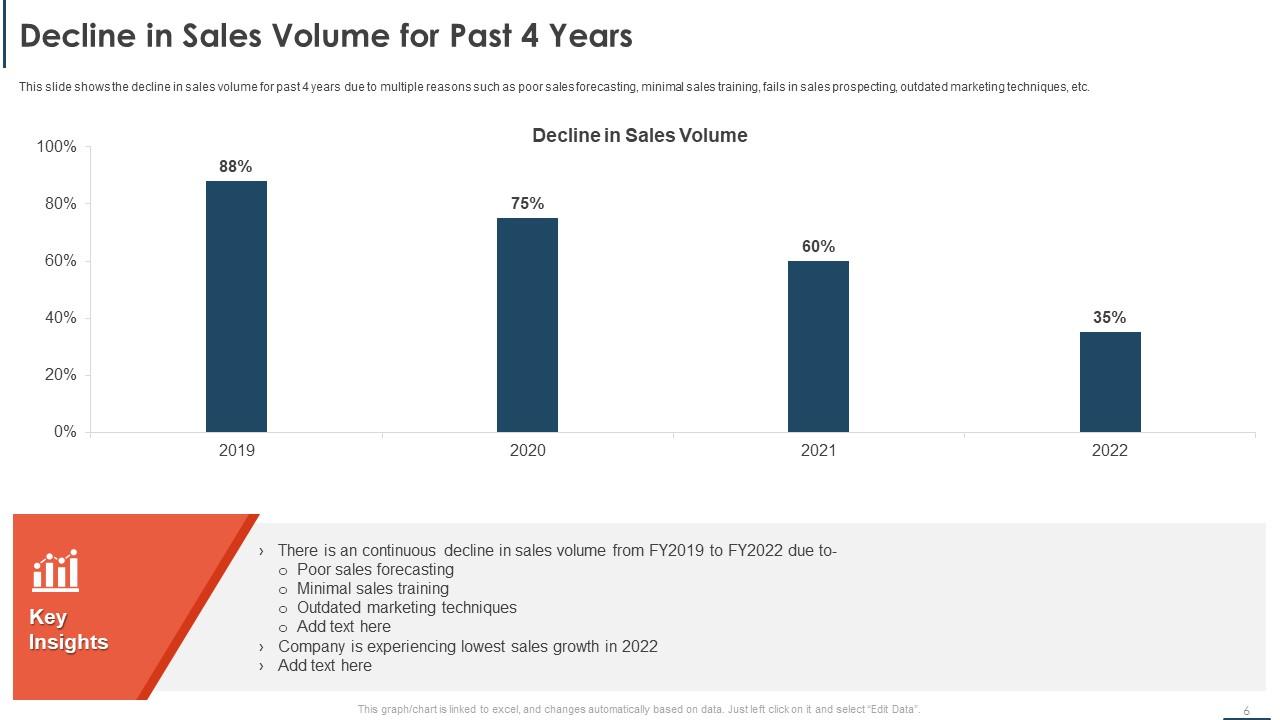
Slide 6: This slide shows the decline in sales volume for past 4 years due to multiple reasons such as poor sales forecasting, minimal sales training, fails in sales prospecting, outdated marketing techniques, etc.
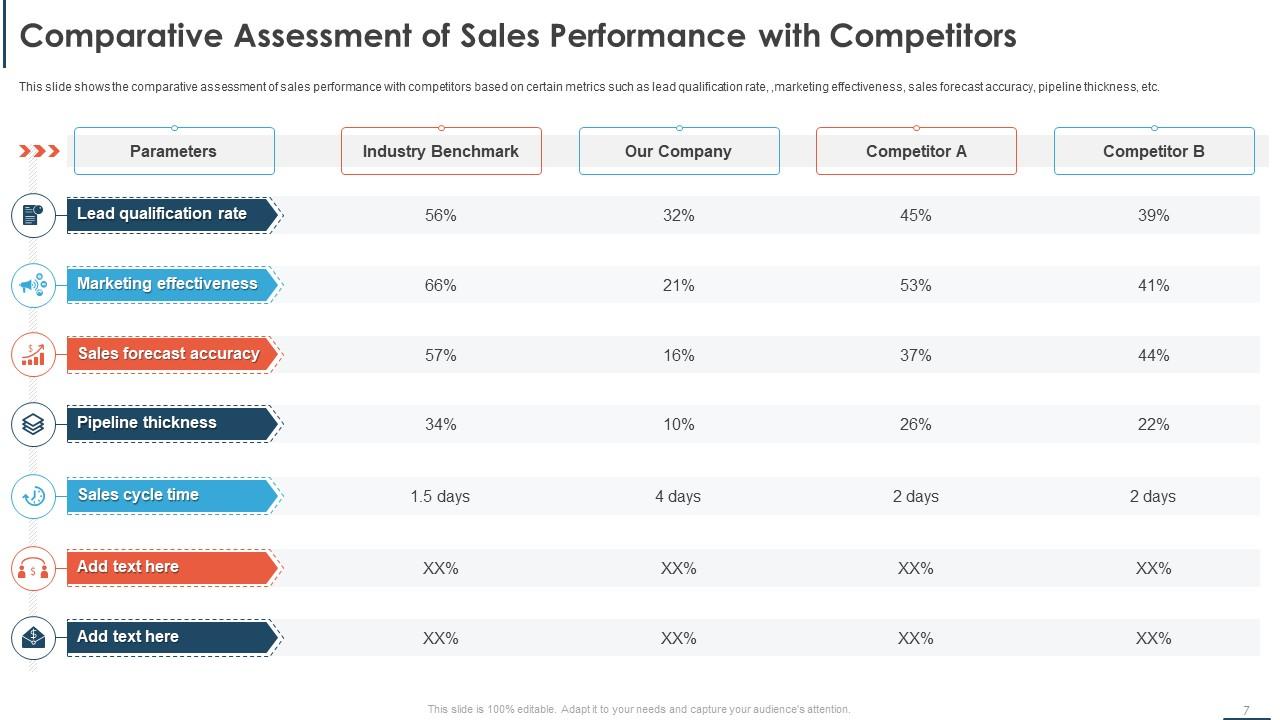
Slide 7: This slide shows the comparative assessment of sales performance with competitors based on certain metrics such as lead qualification rate, ,marketing effectiveness, sales forecast accuracy, pipeline thickness, etc.
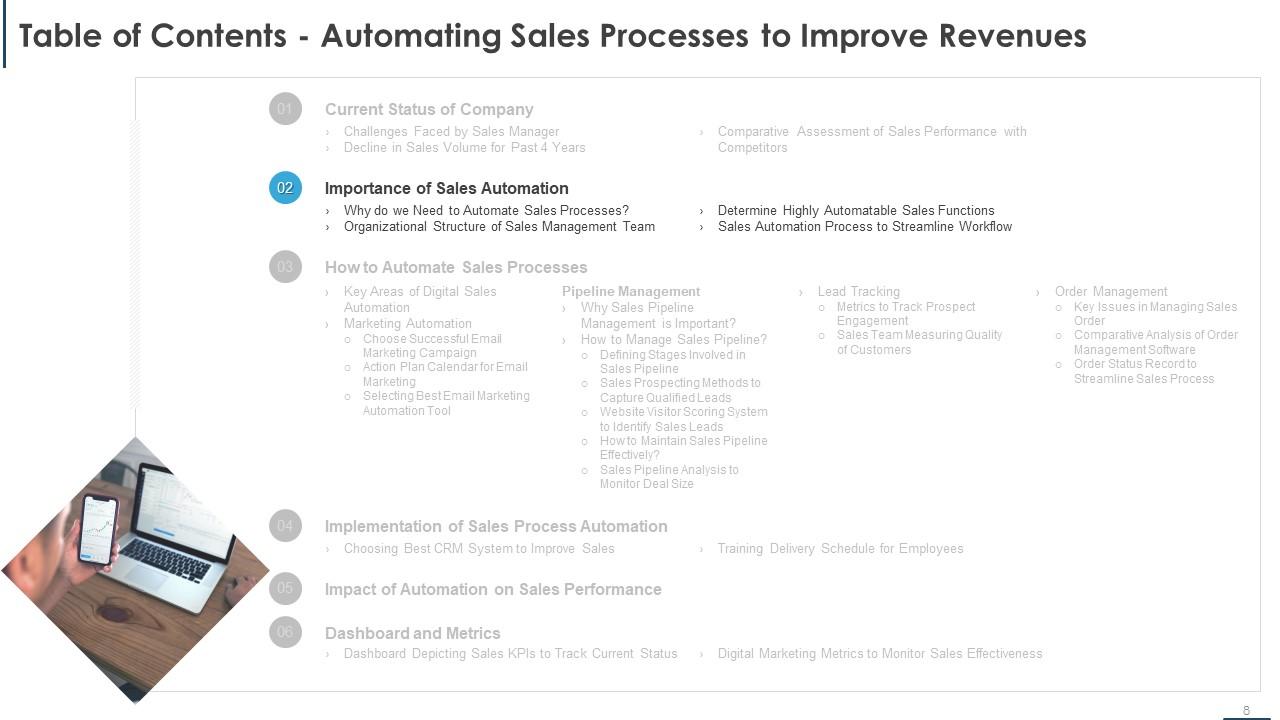
Slide 8: This is a Table of Contents slide - Automating Sales Processes to Improve Revenues
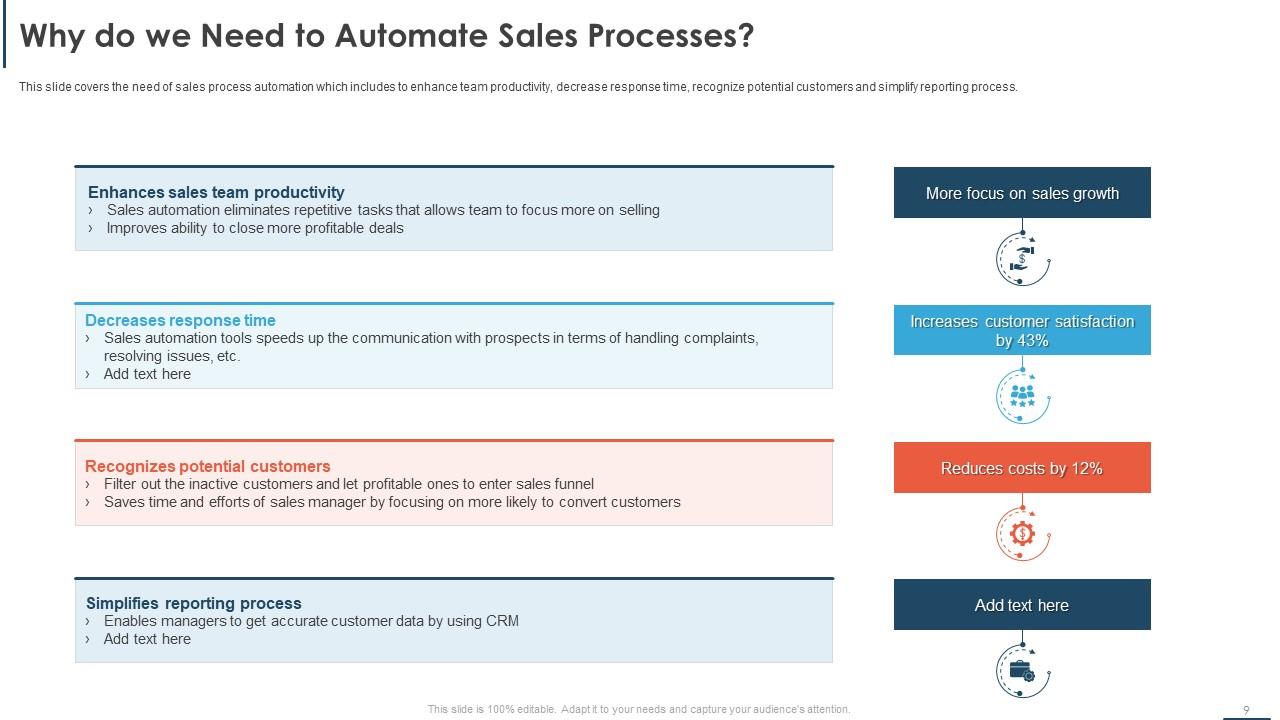
Slide 9: This slide covers the need of sales process automation which includes to enhance team productivity, decrease response time, recognize potential customers and simplify reporting process.
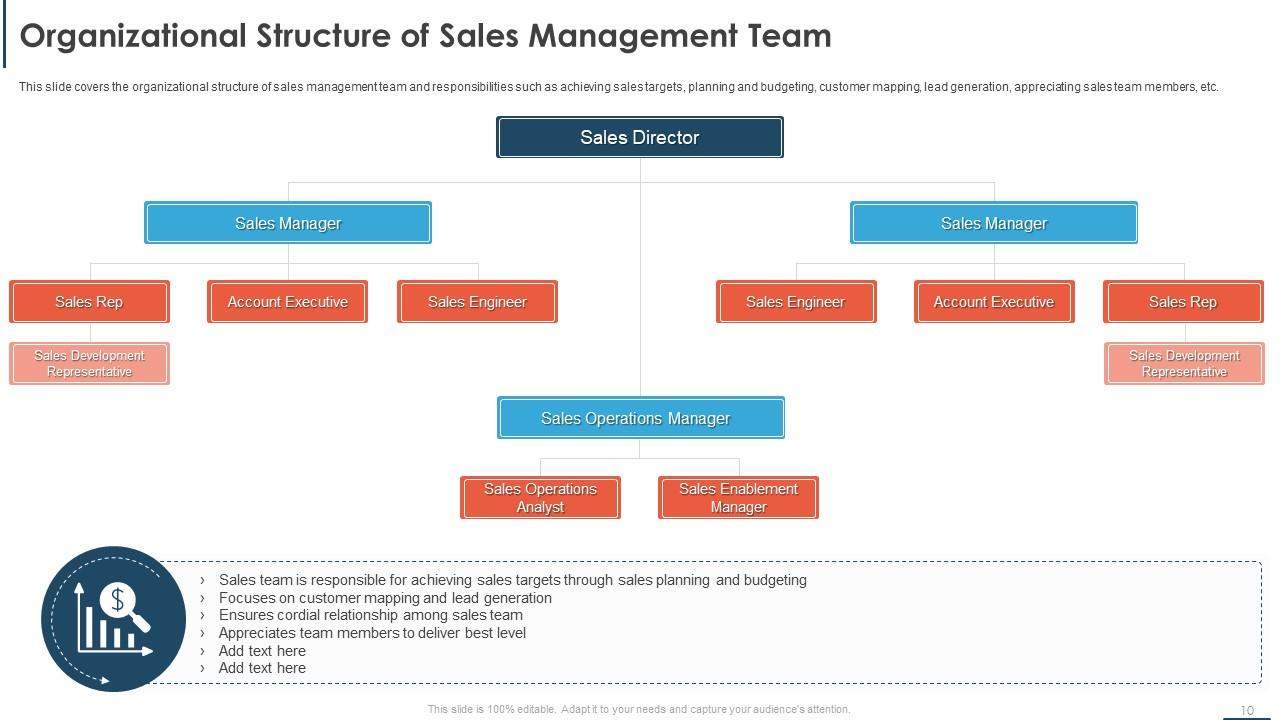
Slide 10: This slide covers the organizational structure of sales management team and responsibilities such as achieving sales targets, planning and budgeting, customer mapping, lead generation, appreciating sales team members, etc.
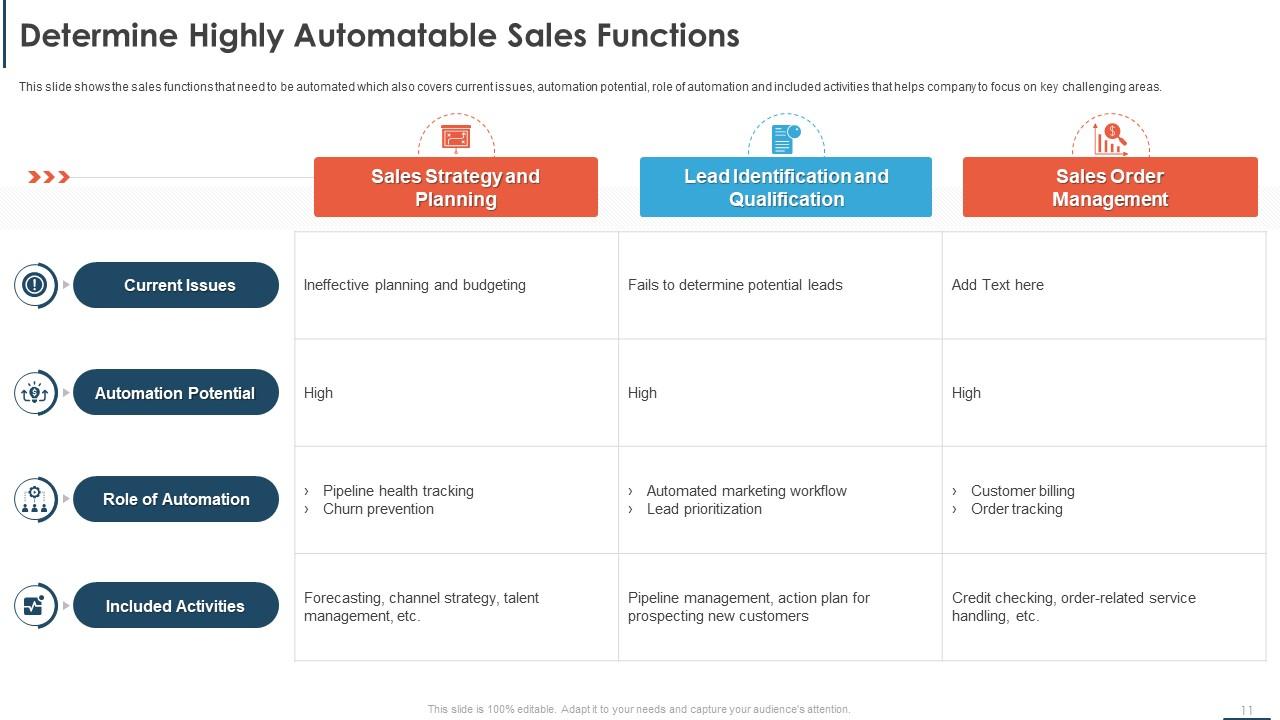
Slide 11: This slide shows the sales functions that need to be automated which also covers current issues, automation potential, role of automation and included activities that helps company to focus on key challenging areas.
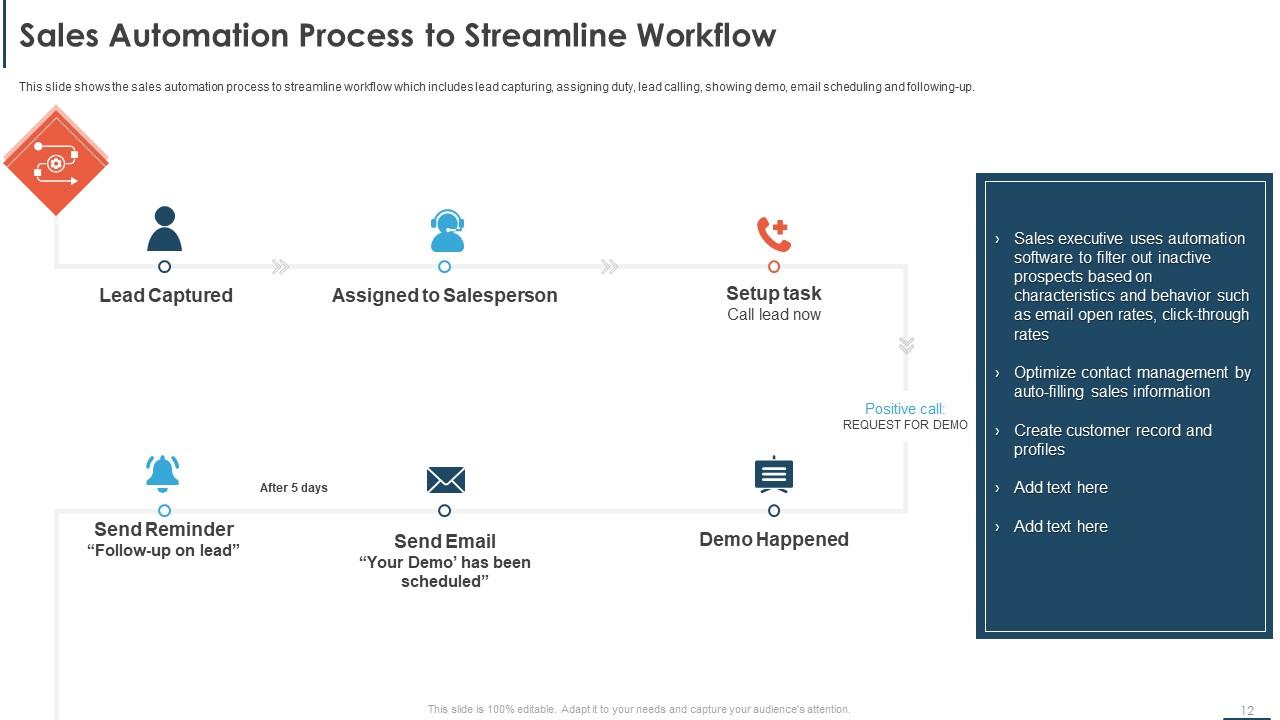
Slide 12: This slide shows the sales automation process to streamline workflow which includes lead capturing, assigning duty, lead calling, showing demo, email scheduling and following-up.
Slide 13: This is a Table of Contents slide - Automating Sales Processes to Improve Revenues
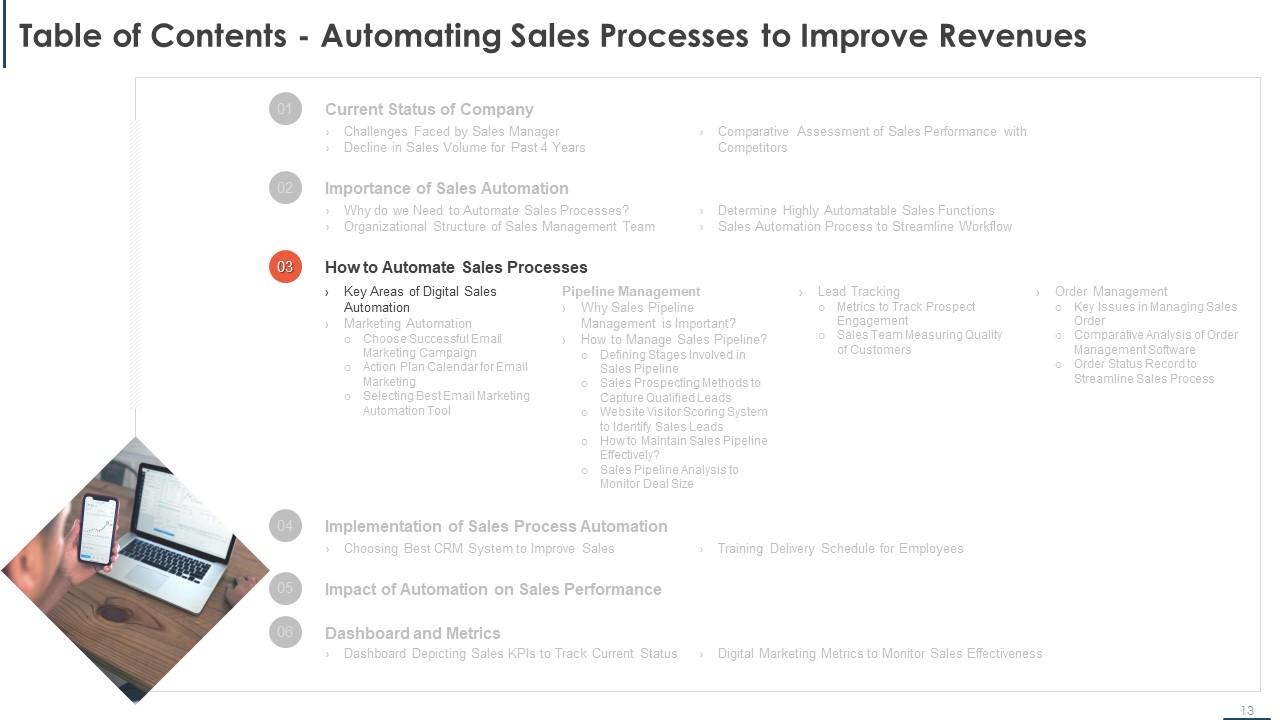
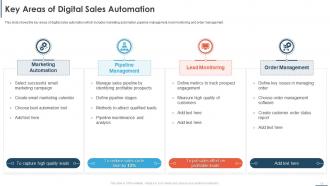
Slide 14: This slide shows the key areas of digital sales automation which includes marketing automation, pipeline management, lead monitoring and order management.
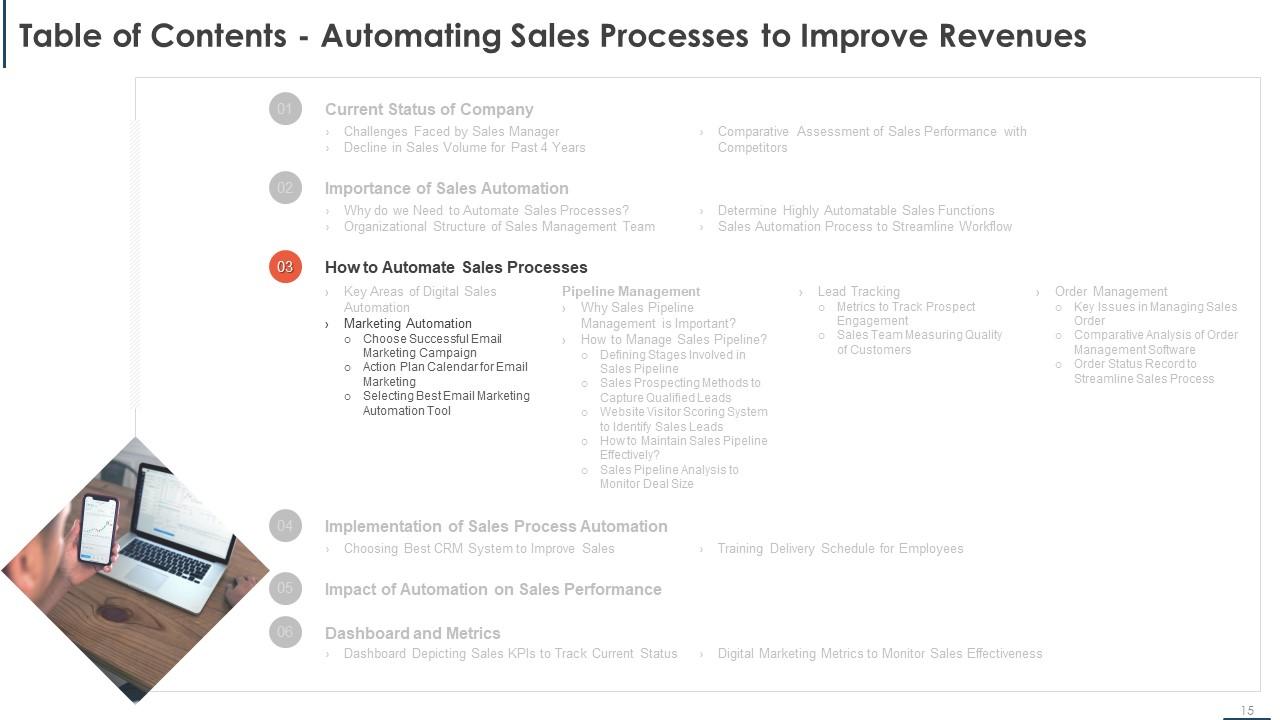
Slide 15: This is a Table of Contents slide- Automating Sales Processes to Improve Revenues
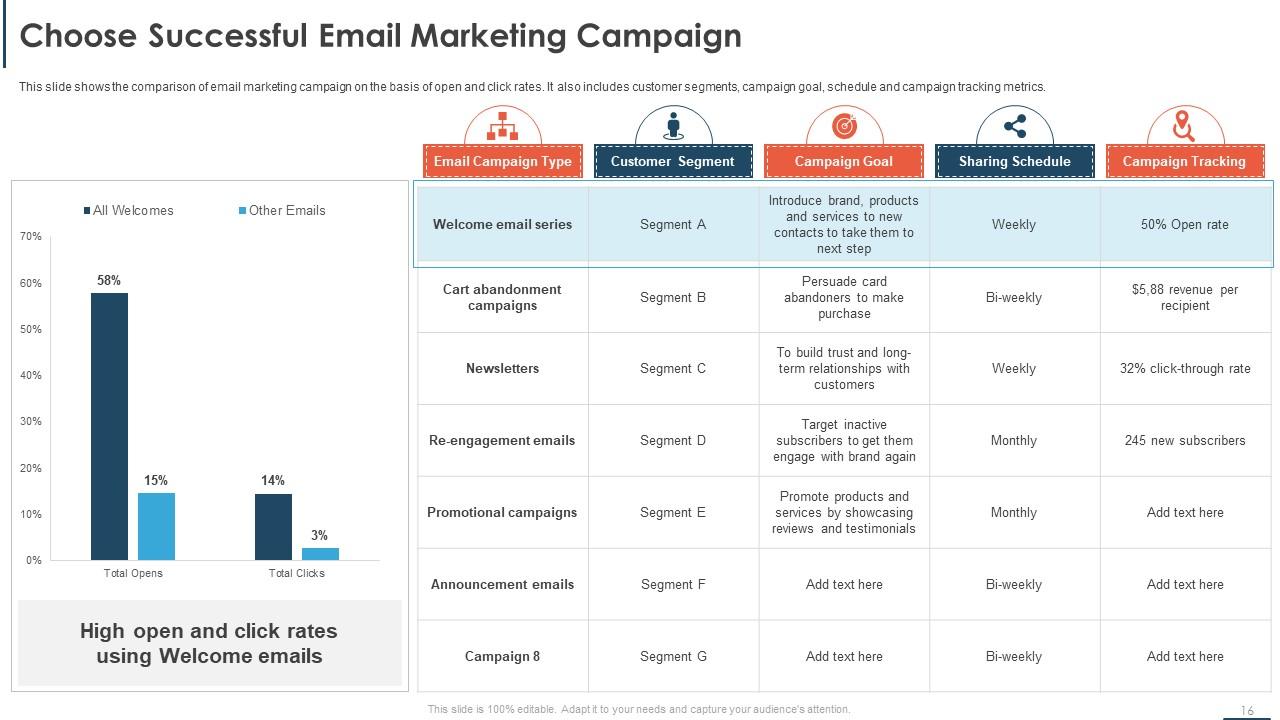
Slide 16: This slide shows the comparison of email marketing campaign on the basis of open and click rates. It also includes customer segments, campaign goal, schedule and campaign tracking metrics.
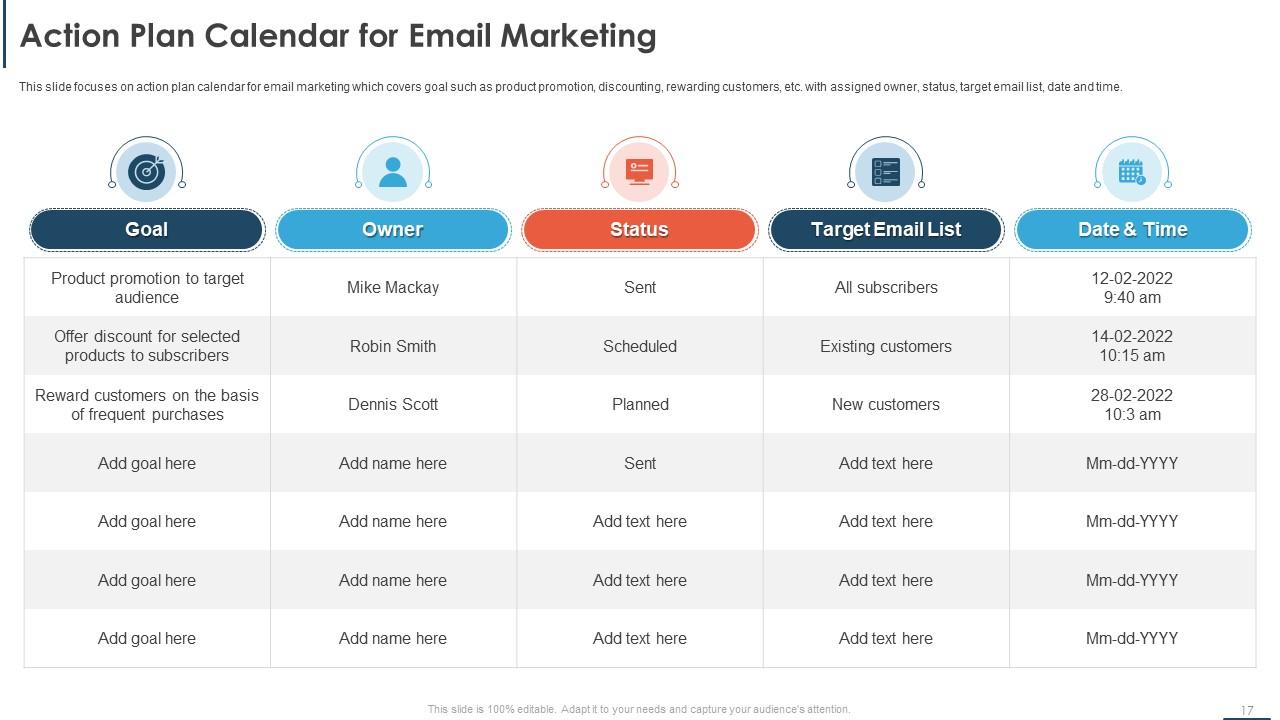
Slide 17: This slide focuses on action plan calendar for email marketing which covers goal such as product promotion, discounting, rewarding customers, etc. with assigned owner, status, target email list, date and time.
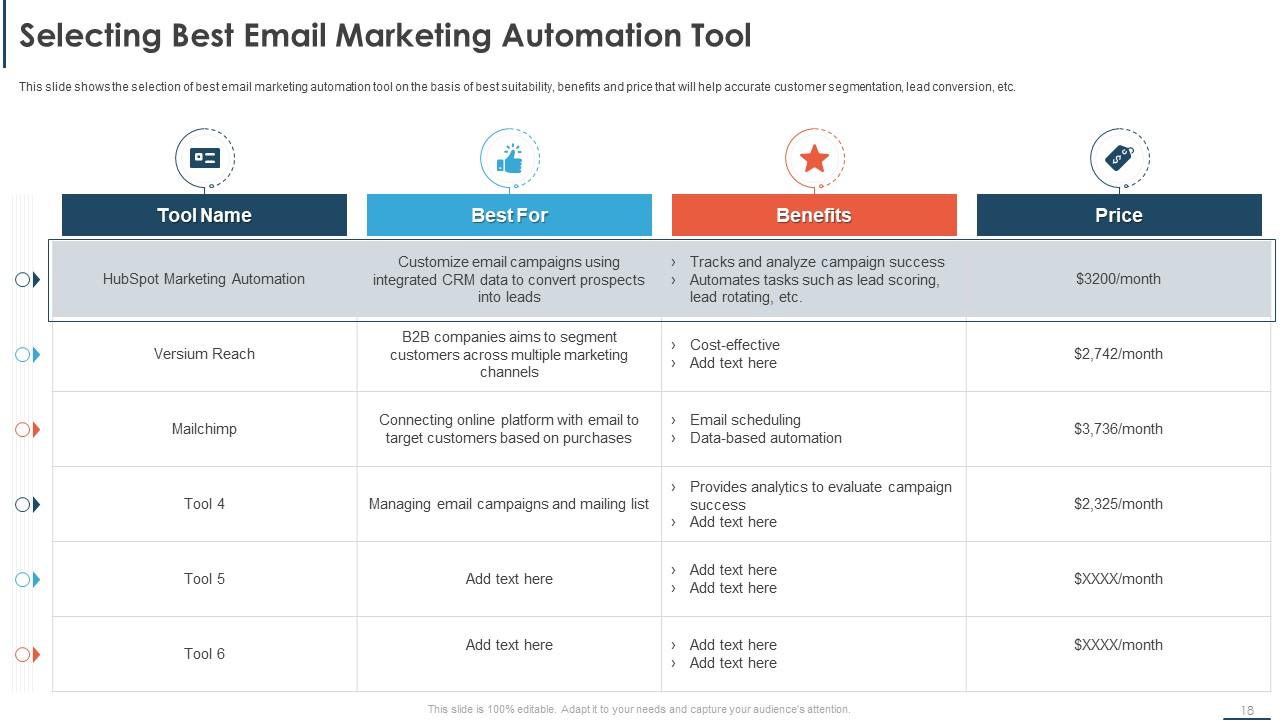
Slide 18: This slide shows the selection of best email marketing automation tool on the basis of best suitability, benefits and price that will help accurate customer segmentation, lead conversion, etc.
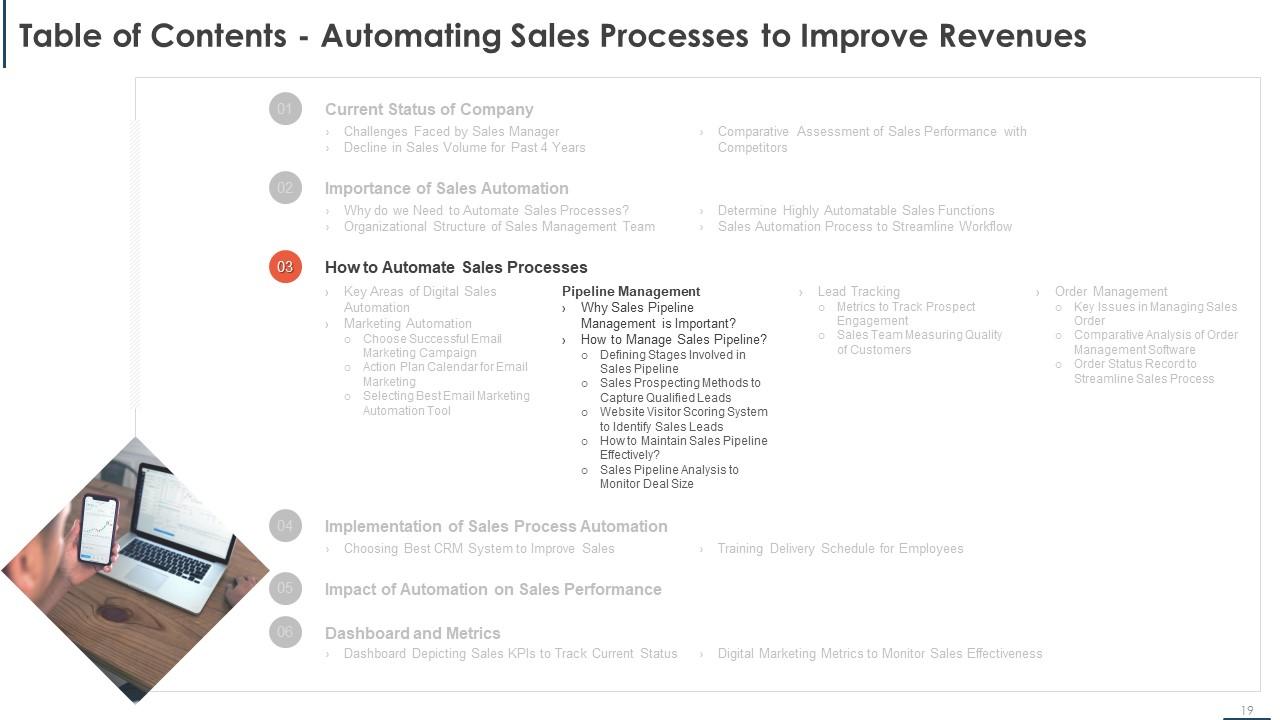
Slide 19: This is a Table of Contents slide- Automating Sales Processes to Improve Revenues
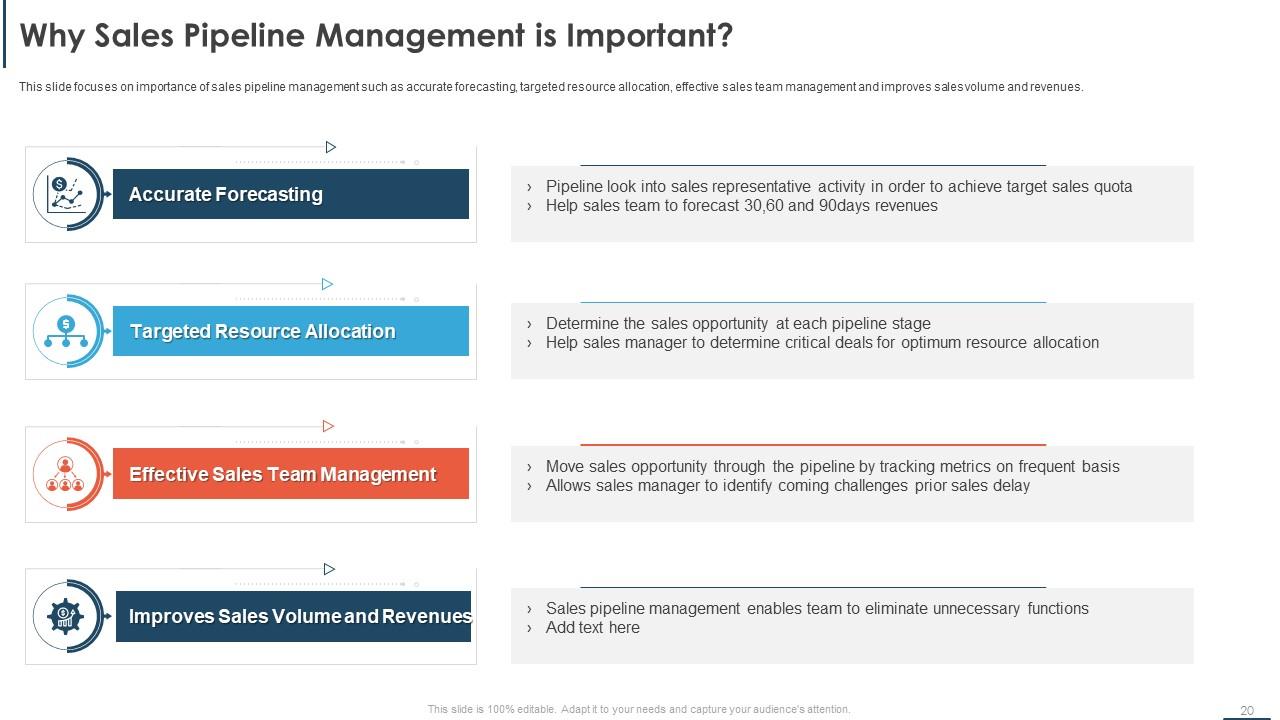
Slide 20: This slide focuses on importance of sales pipeline management such as accurate forecasting, targeted resource allocation, effective sales team management and improves sales volume and revenues.
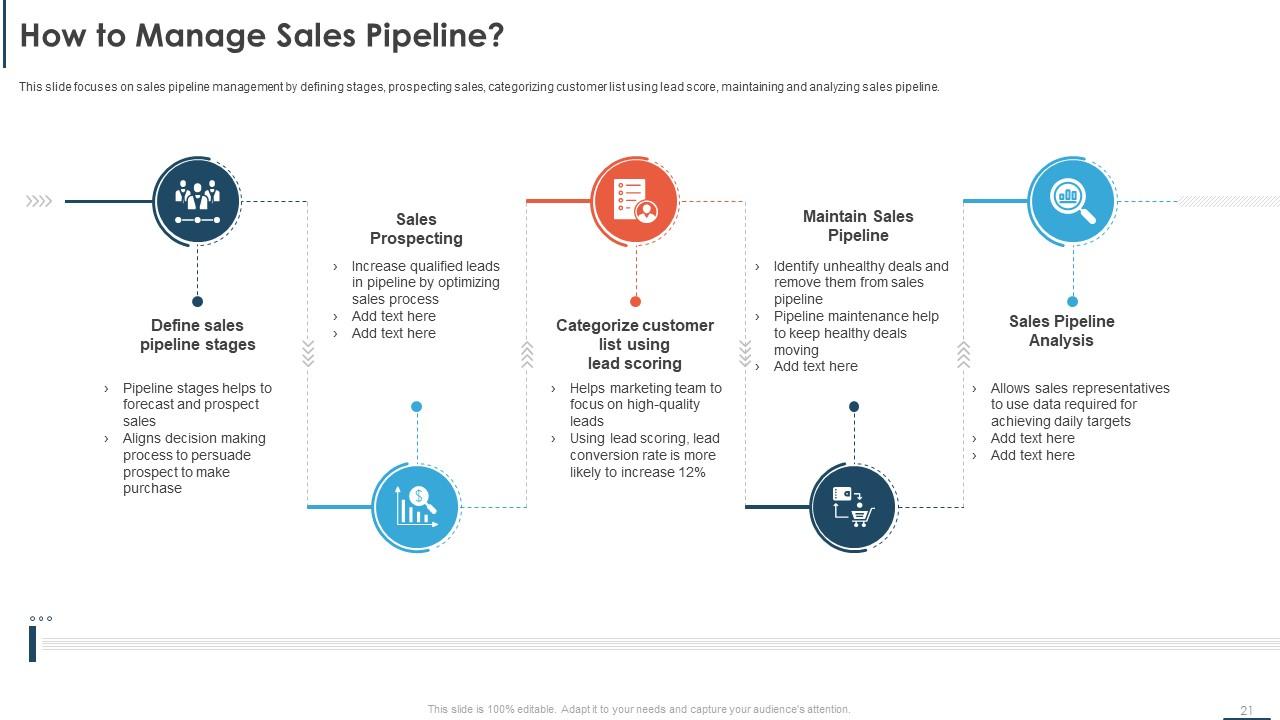
Slide 21: This slide focuses on sales pipeline management by defining stages, prospecting sales, categorizing customer list using lead score, maintaining and analyzing sales pipeline.
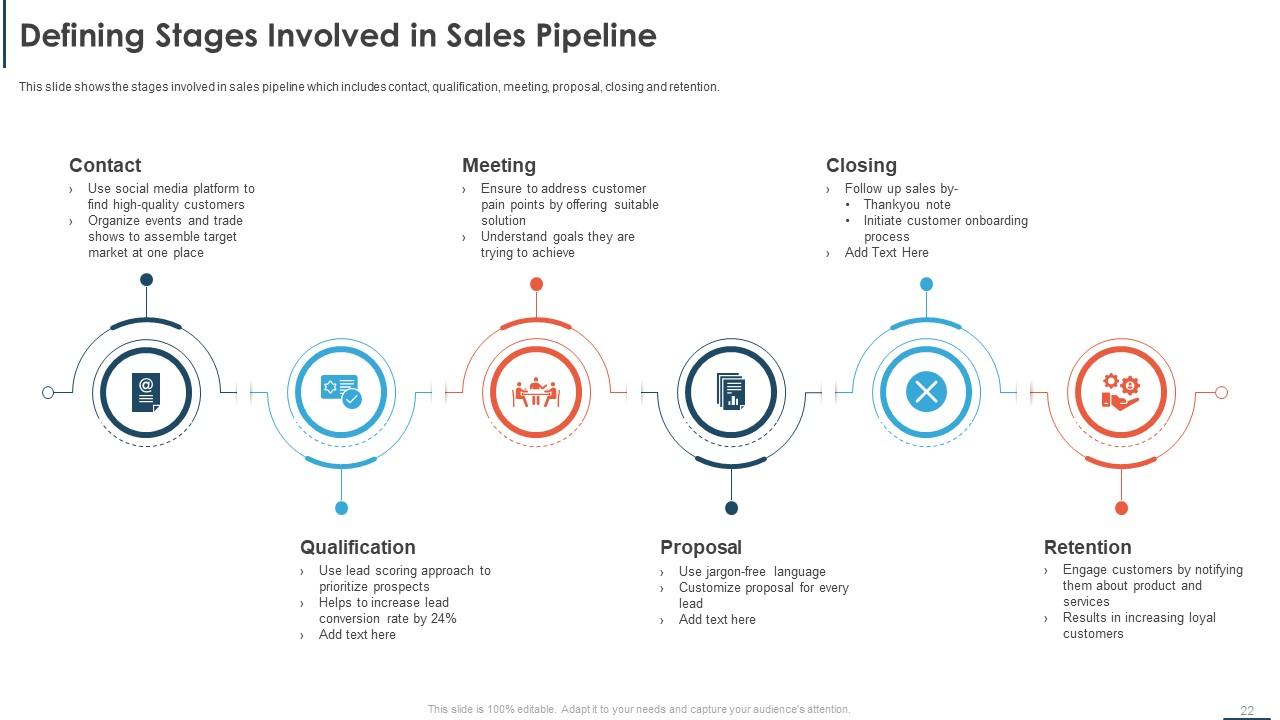
Slide 22: This slide shows the stages involved in sales pipeline which includes contact, qualification, meeting, proposal, closing and retention.
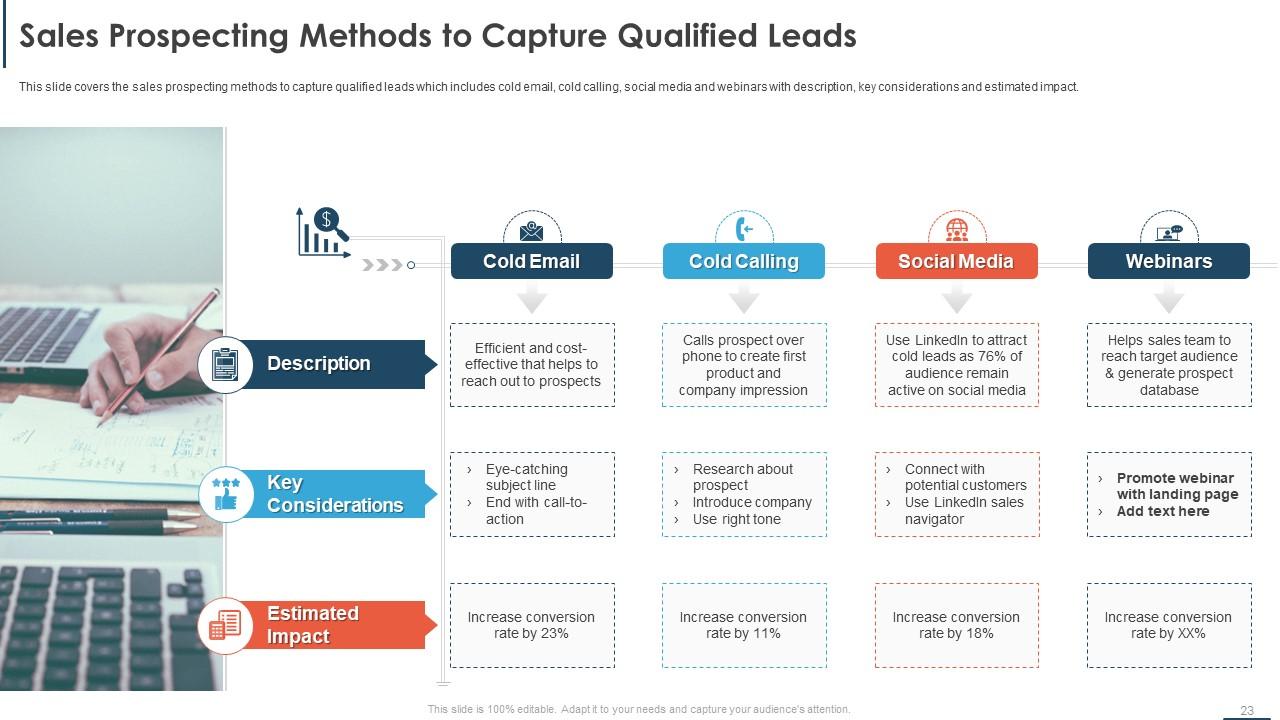
Slide 23: This slide covers the sales prospecting methods to capture qualified leads which includes cold email, cold calling, social media and webinars with description, key considerations and estimated impact.
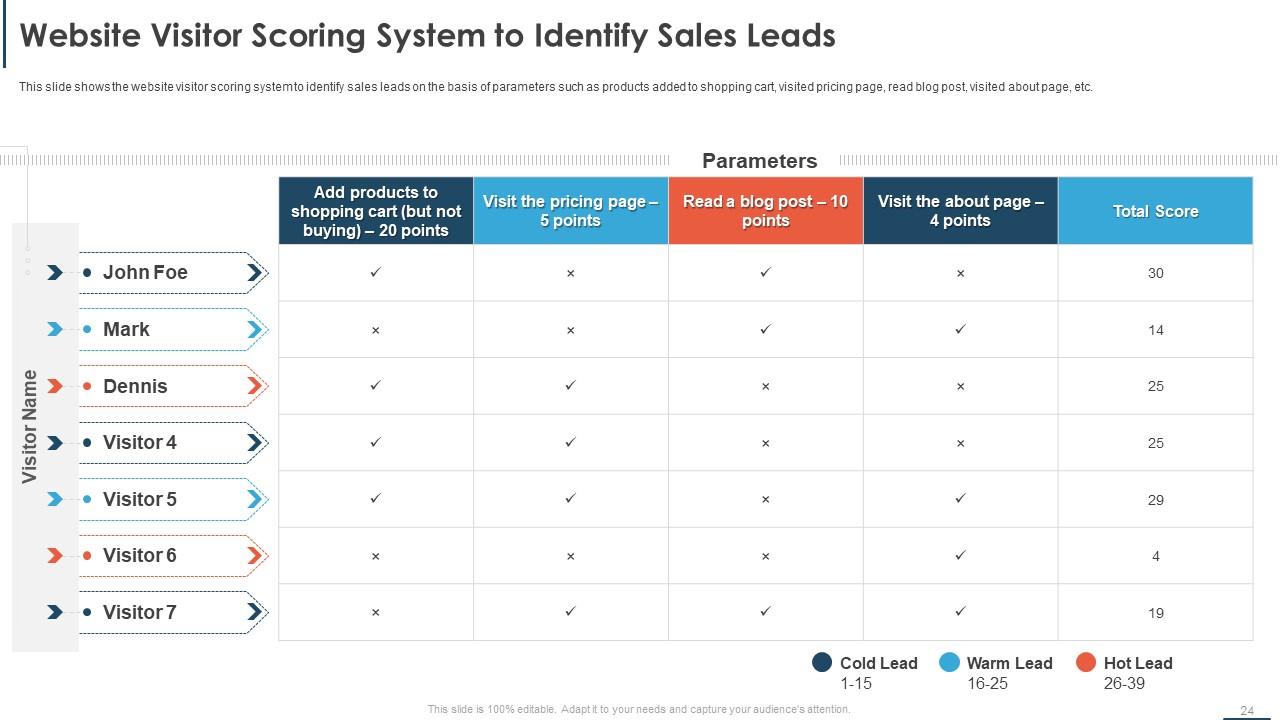
Slide 24: This slide shows the website visitor scoring system to identify sales leads on the basis of parameters such as products added to shopping cart, visited pricing page, read blog post, visited about page, etc.
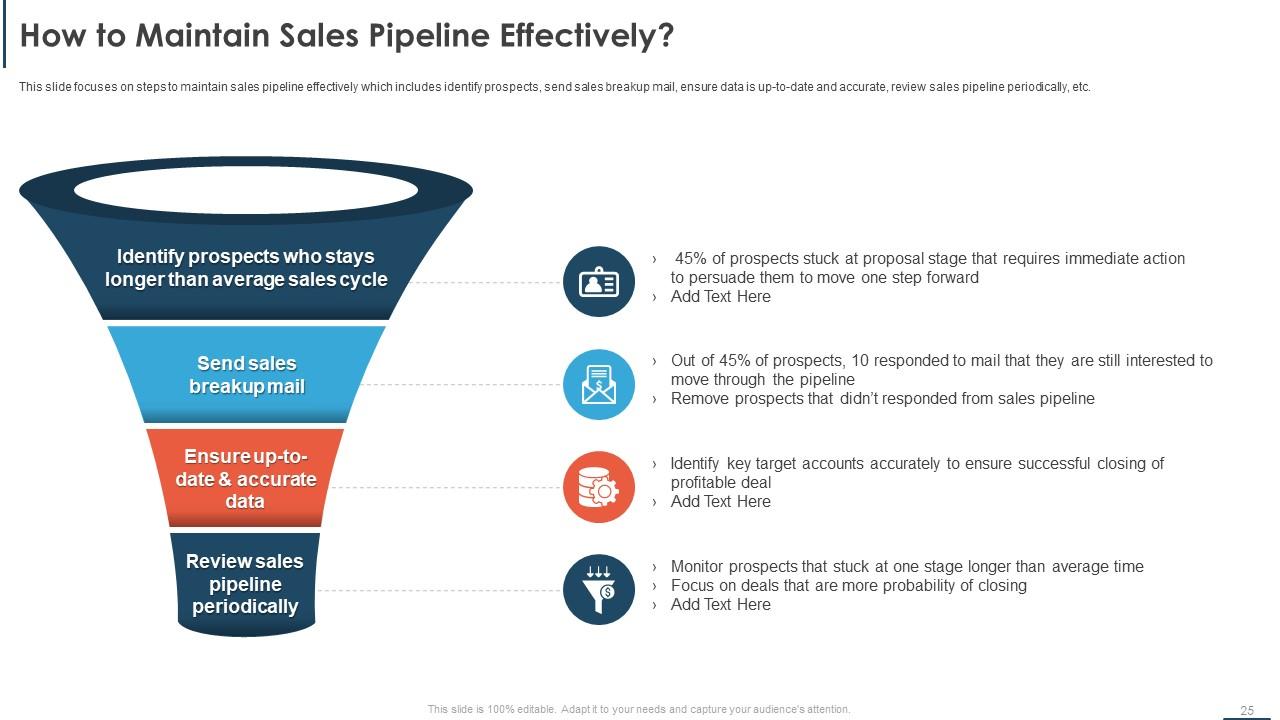
Slide 25: This slide focuses on steps to maintain sales pipeline effectively which includes identify prospects, send sales breakup mail, ensure data is up-to-date and accurate, review sales pipeline periodically, etc.
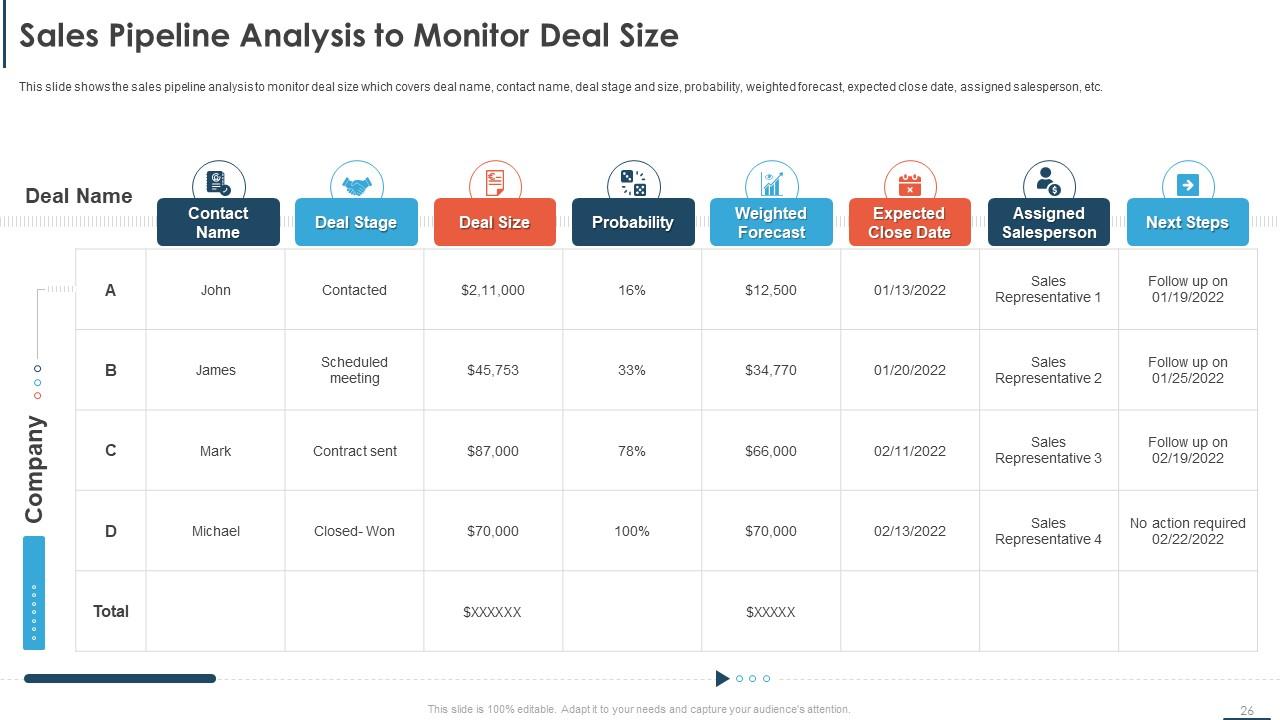
Slide 26: This slide shows the sales pipeline analysis to monitor deal size which covers deal name, contact name, deal stage and size, probability, weighted forecast, expected close date, assigned salesperson, etc.
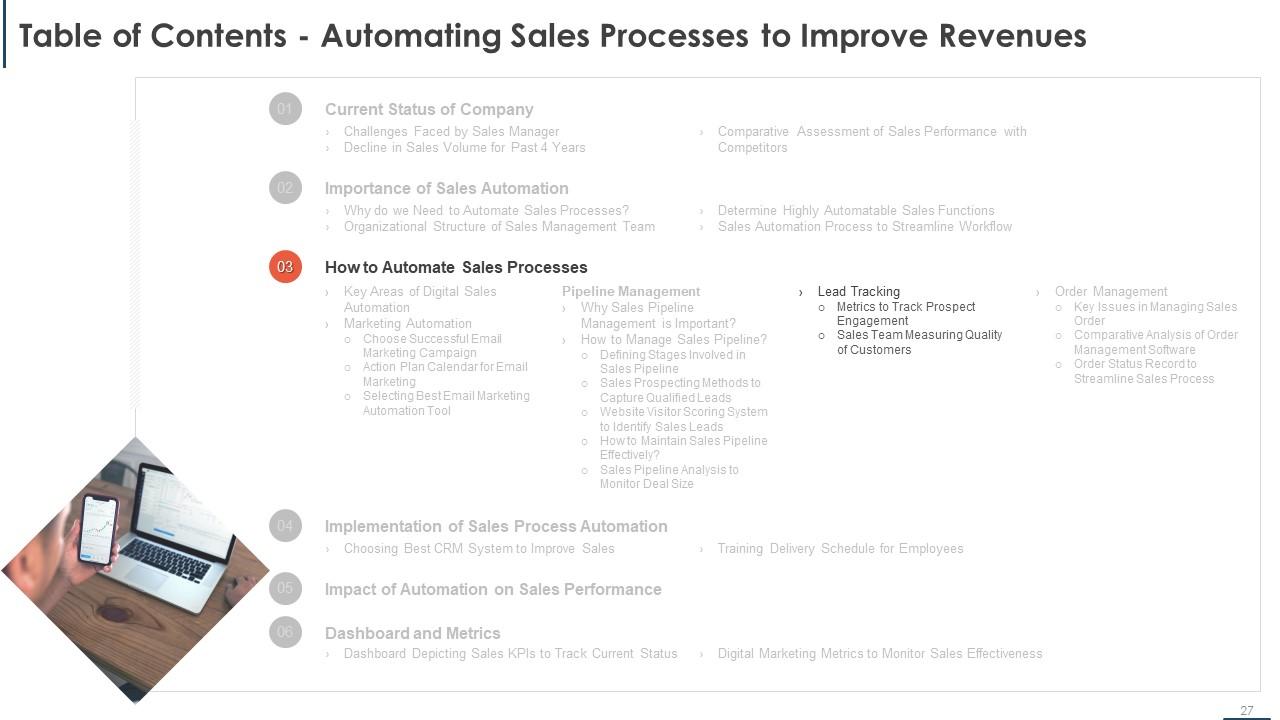
Slide 27: This is a Table of Contents slide - Automating Sales Processes to Improve Revenues
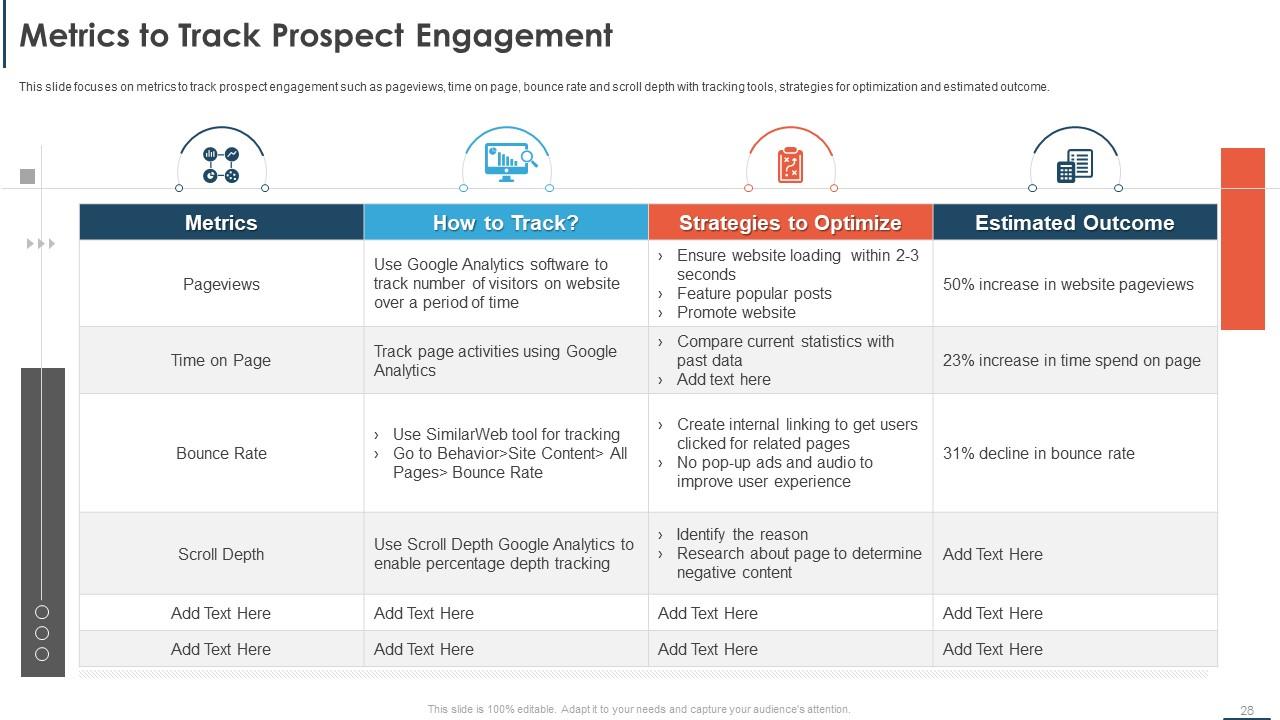
Slide 28: This slide focuses on metrics to track prospect engagement such as pageviews, time on page, bounce rate and scroll depth with tracking tools, strategies for optimization and estimated outcome.
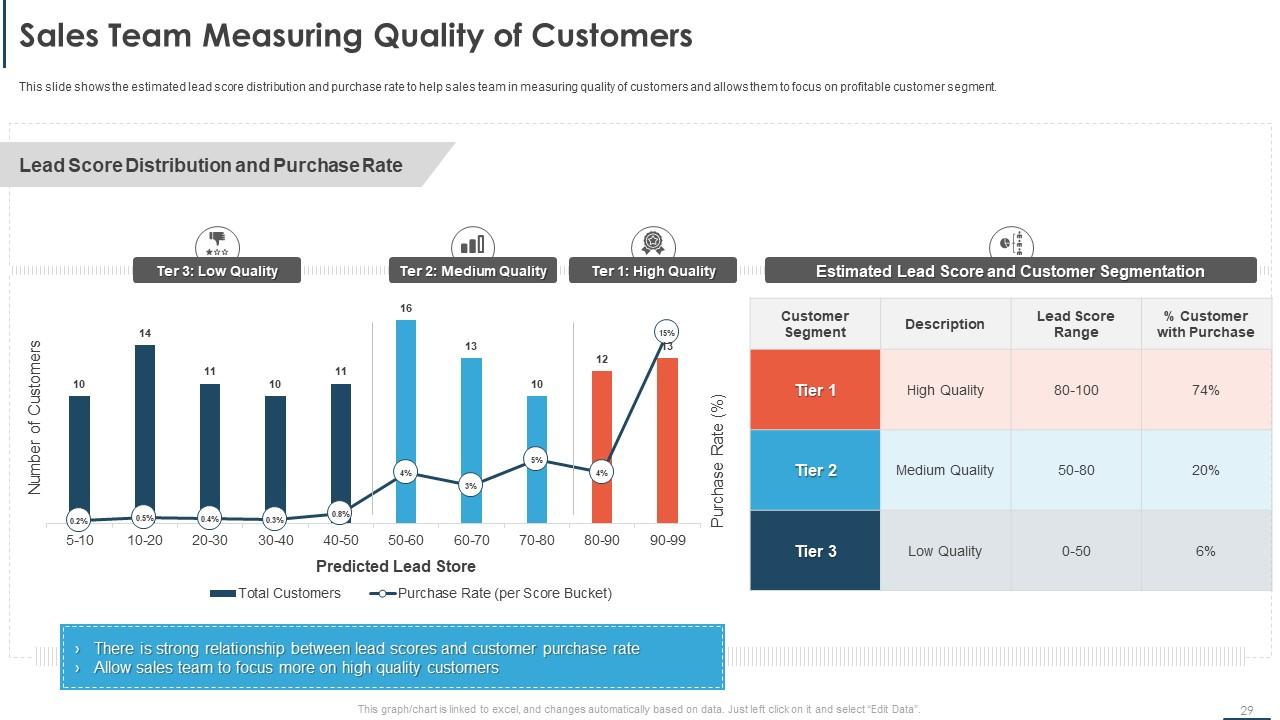
Slide 29: This slide shows the estimated lead score distribution and purchase rate to help sales team in measuring quality of customers and allows them to focus on profitable customer segment.
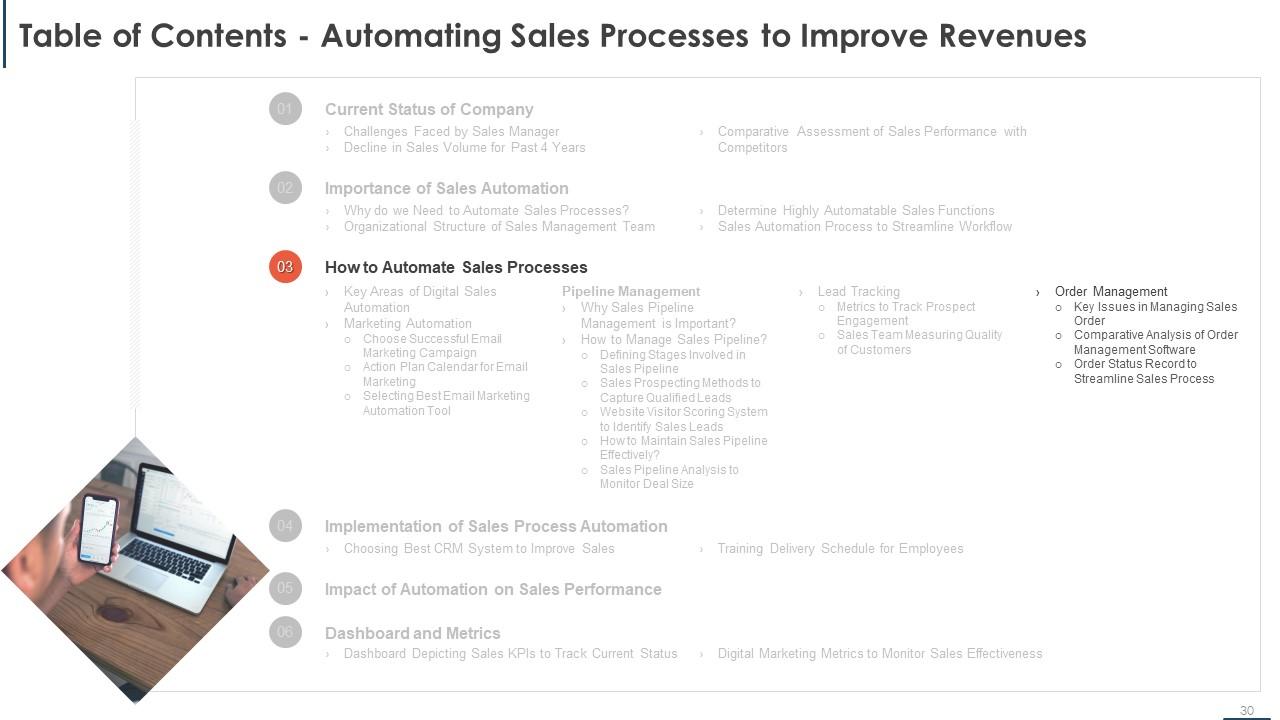
Slide 30: This is a Table of Contents slide- Automating Sales Processes to Improve Revenues
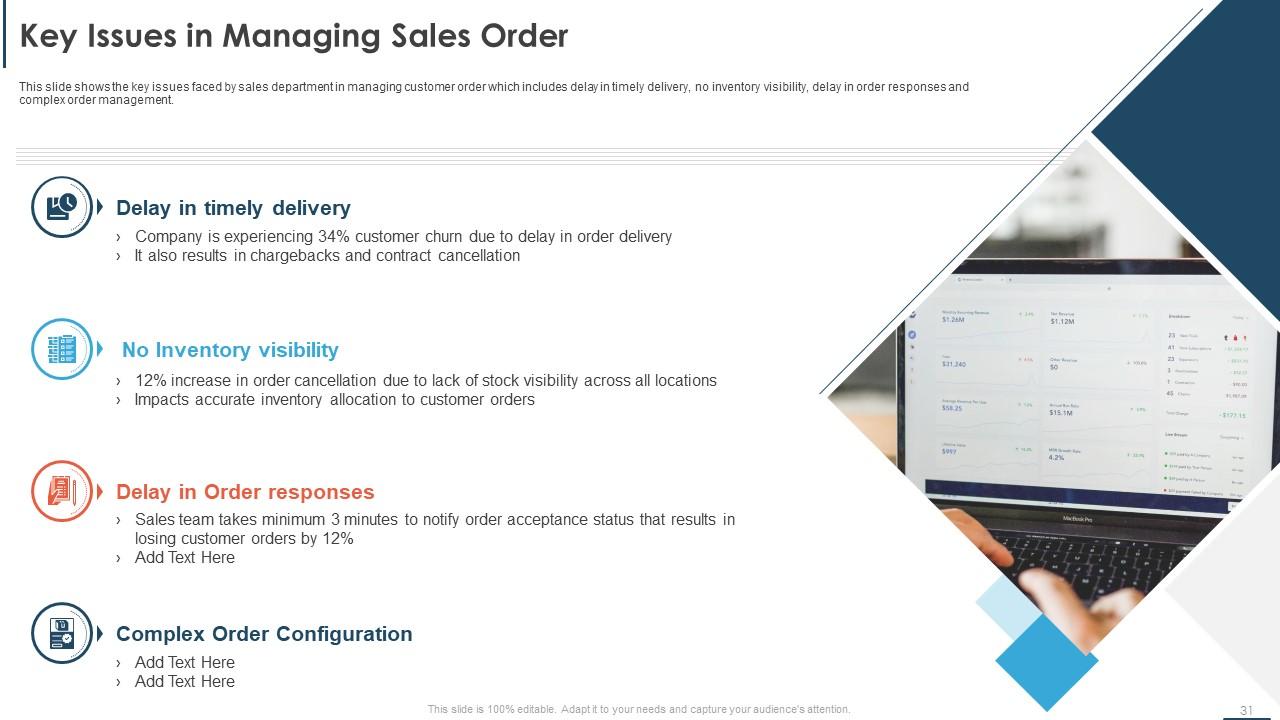
Slide 31: This slide shows the key issues faced by sales department in managing customer order which includes delay in timely delivery, no inventory visibility, delay in order responses and complex order management.
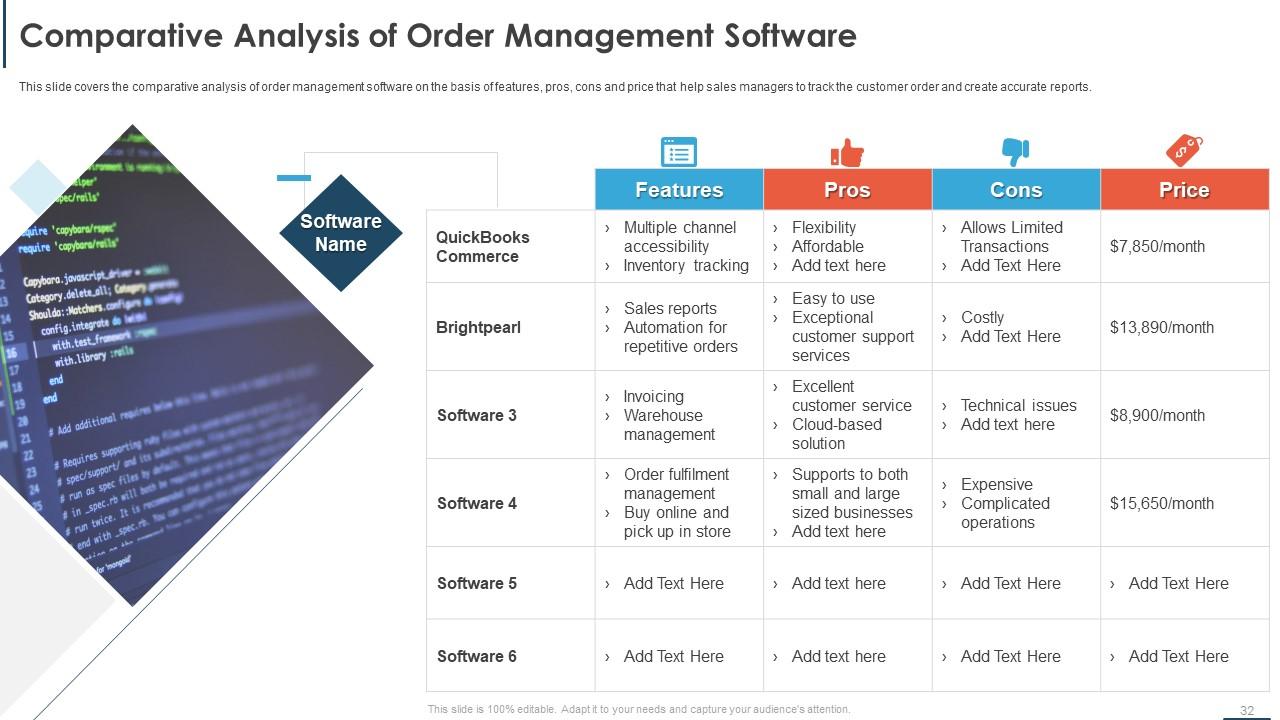
Slide 32: This slide covers the comparative analysis of order management software on the basis of features, pros, cons and price that help sales managers to track the customer order and create accurate reports.
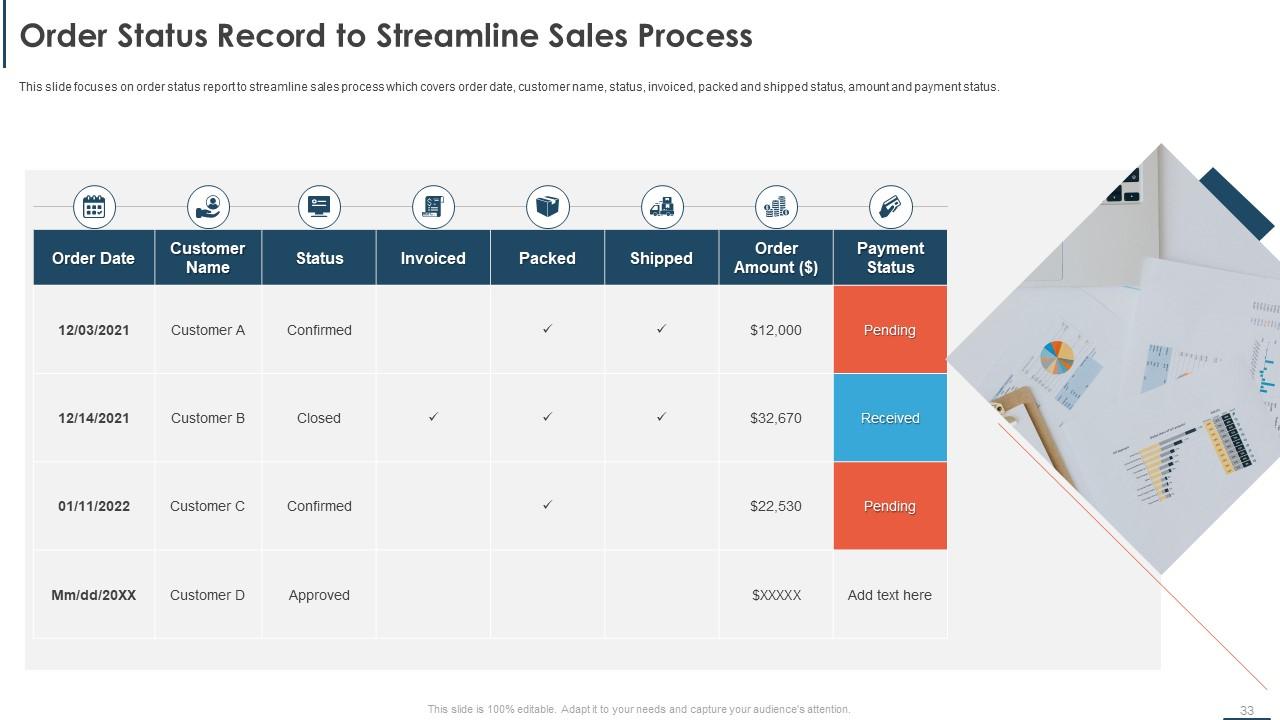
Slide 33: This slide focuses on order status report to streamline sales process which covers order date, customer name, status, invoiced, packed and shipped status, amount and payment status.
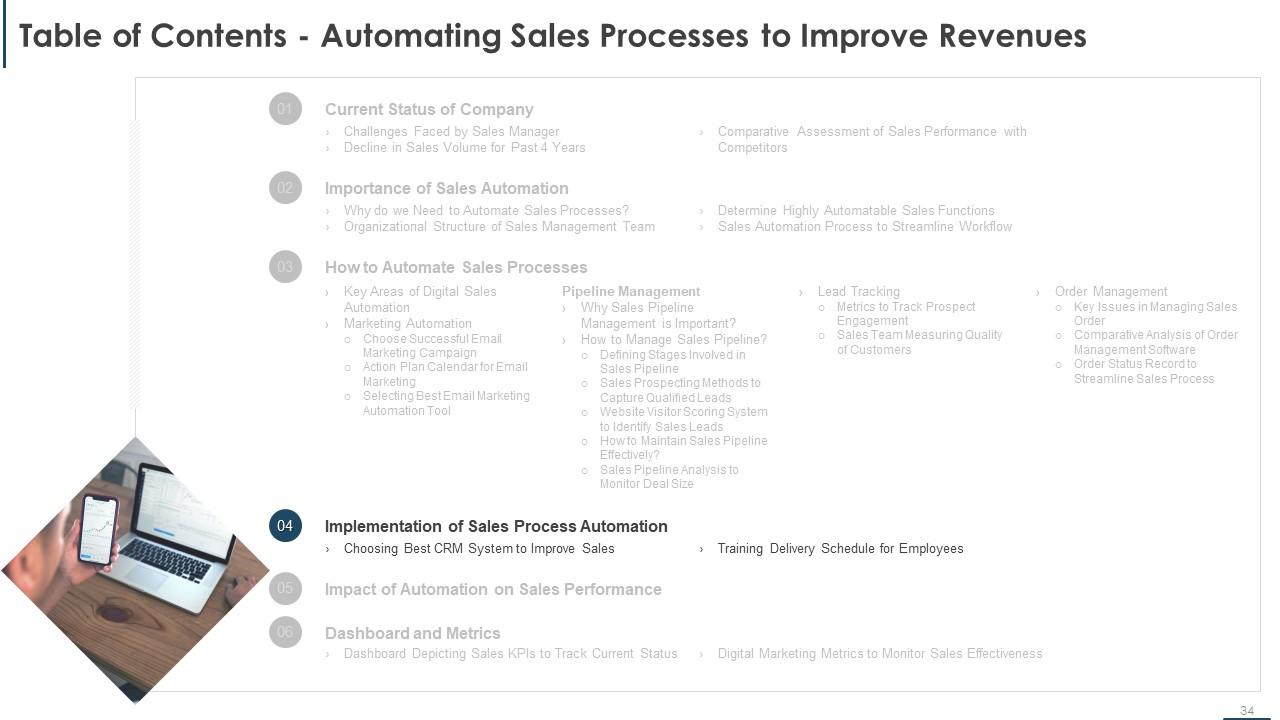
Slide 34: This is a Table of Contents slide - Automating Sales Processes to Improve Revenues
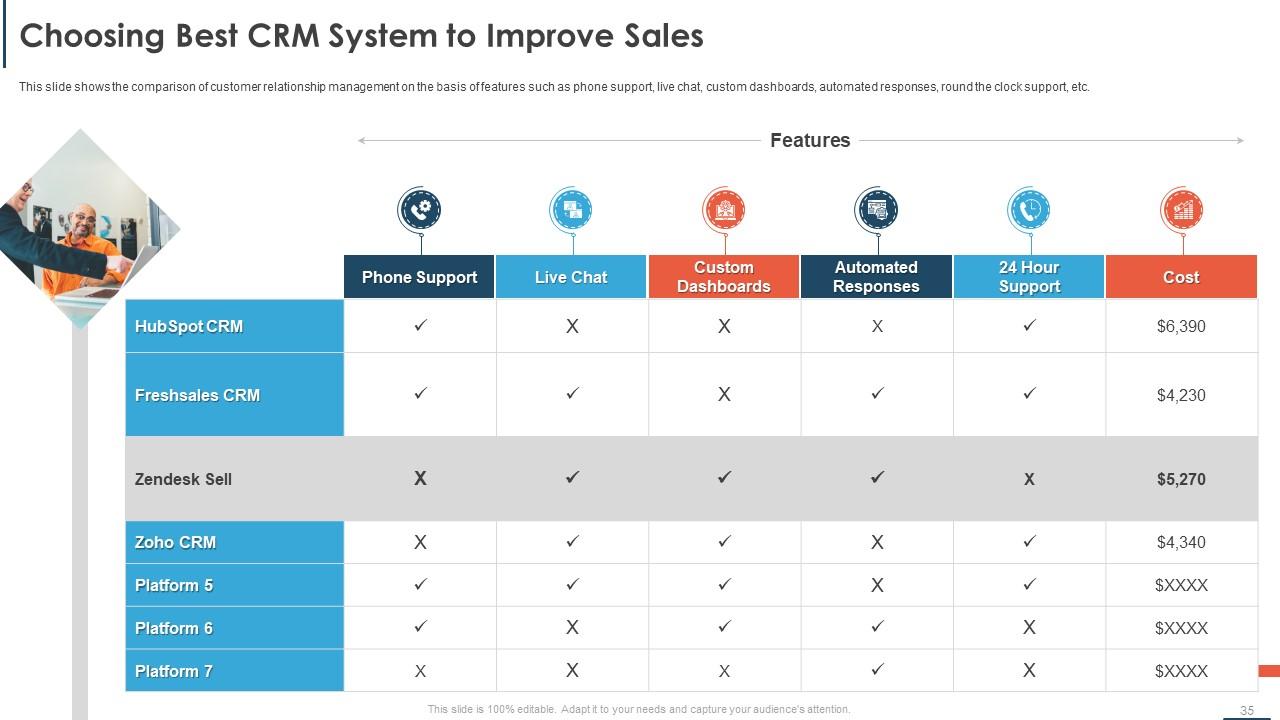
Slide 35: This slide shows the comparison of customer relationship management on the basis of features such as phone support, live chat, custom dashboards, automated responses, round the clock support, etc.
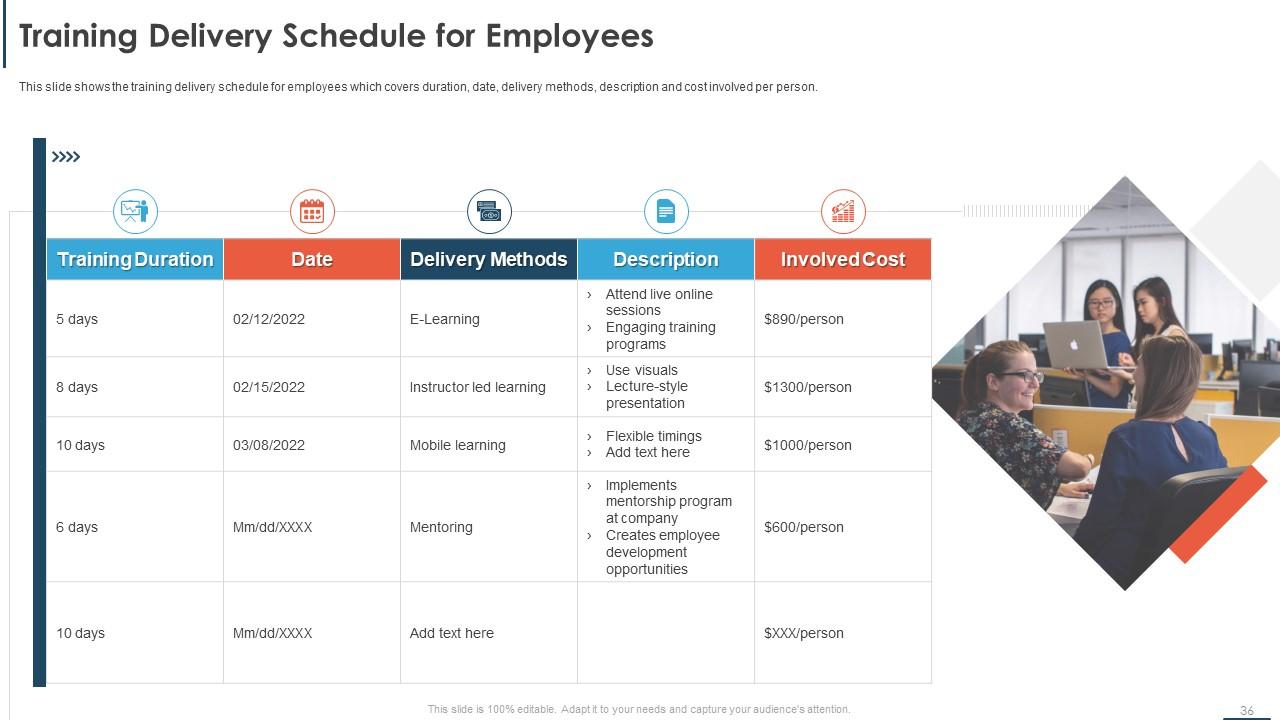
Slide 36: This slide shows the training delivery schedule for employees which covers duration, date, delivery methods, description and cost involved per person.
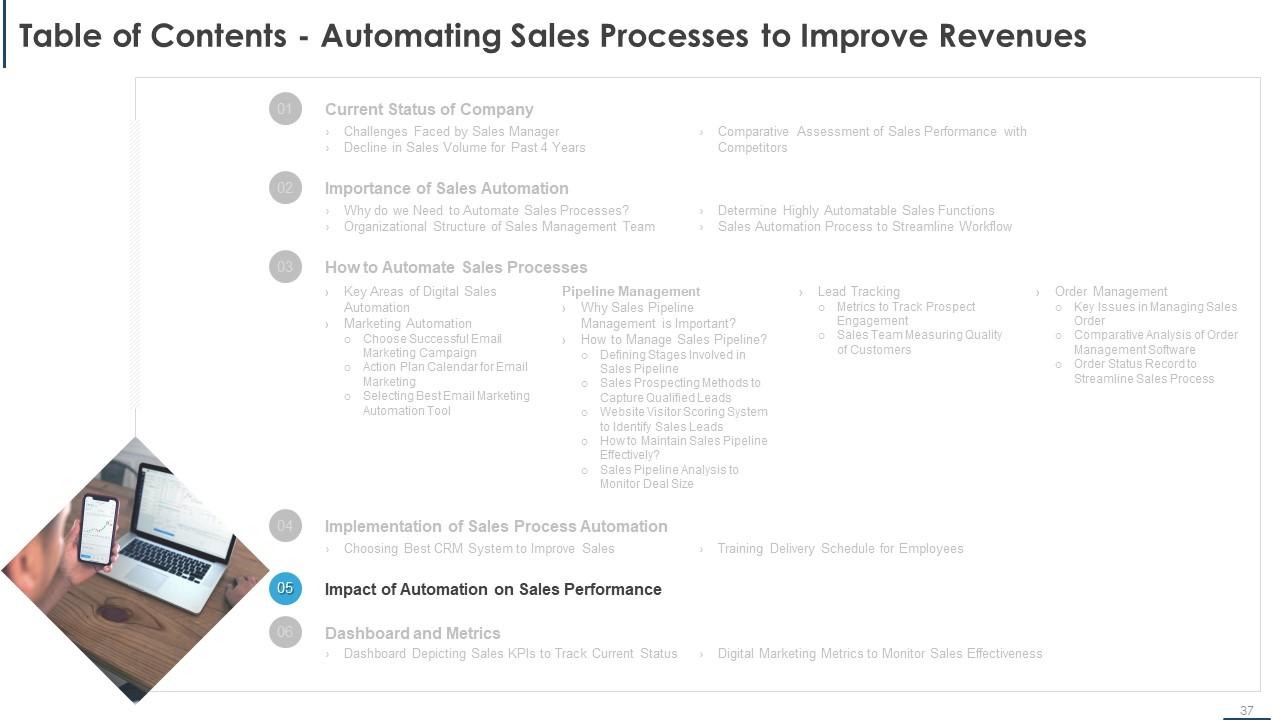
Slide 37: This is a Table of Contents slide - Automating Sales Processes to Improve Revenues
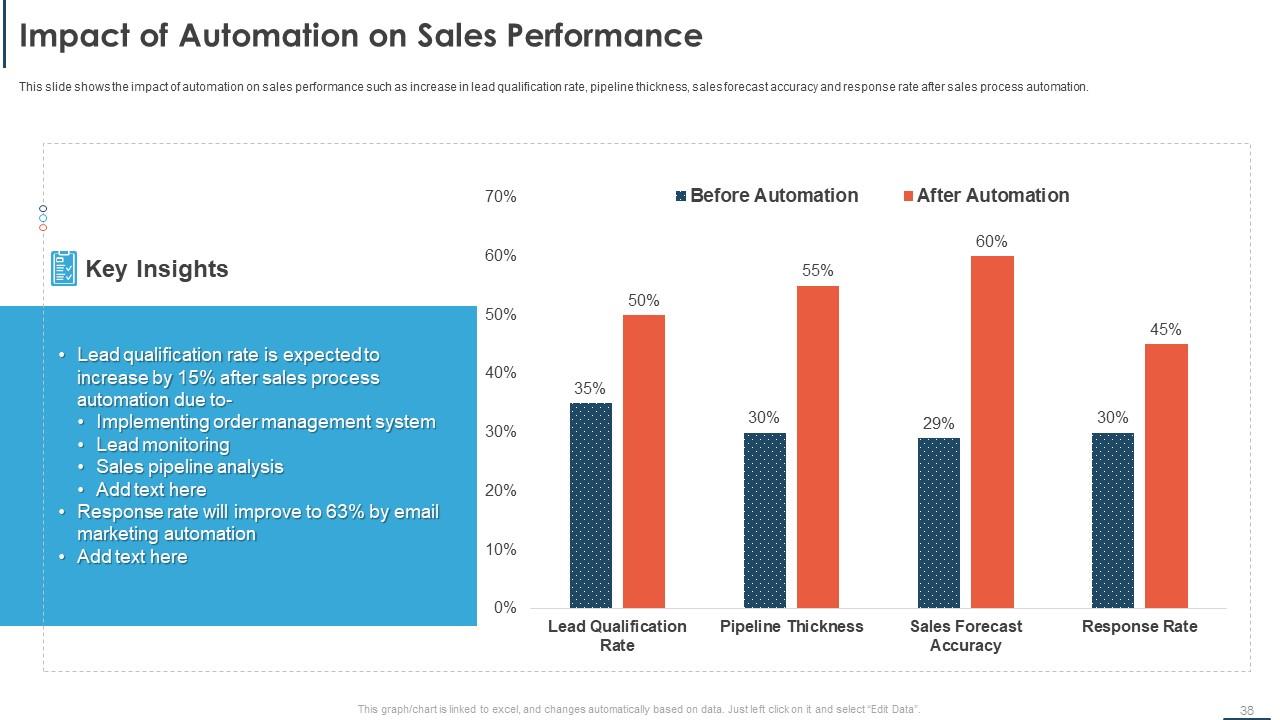
Slide 38: This slide shows the impact of automation on sales performance such as increase in lead qualification rate, pipeline thickness, sales forecast accuracy and response rate after sales process automation.
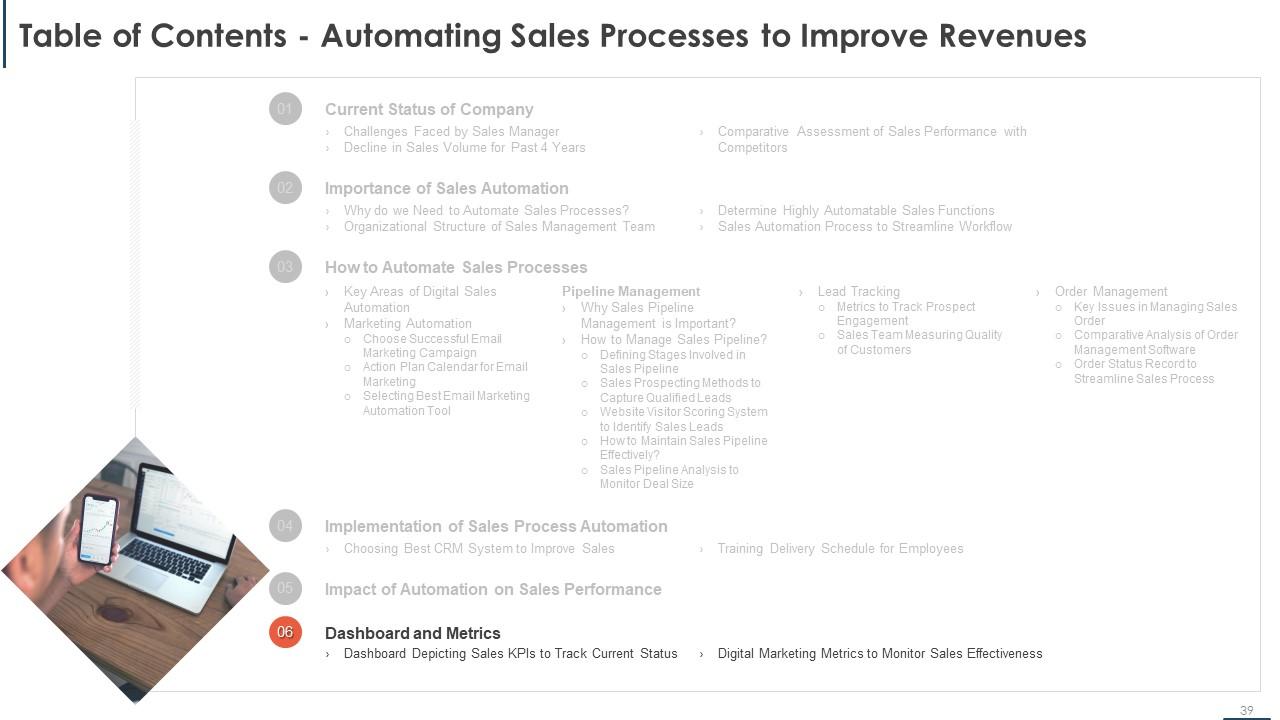
Slide 39: This is a Table of Contents slide - Automating Sales Processes to Improve Revenues
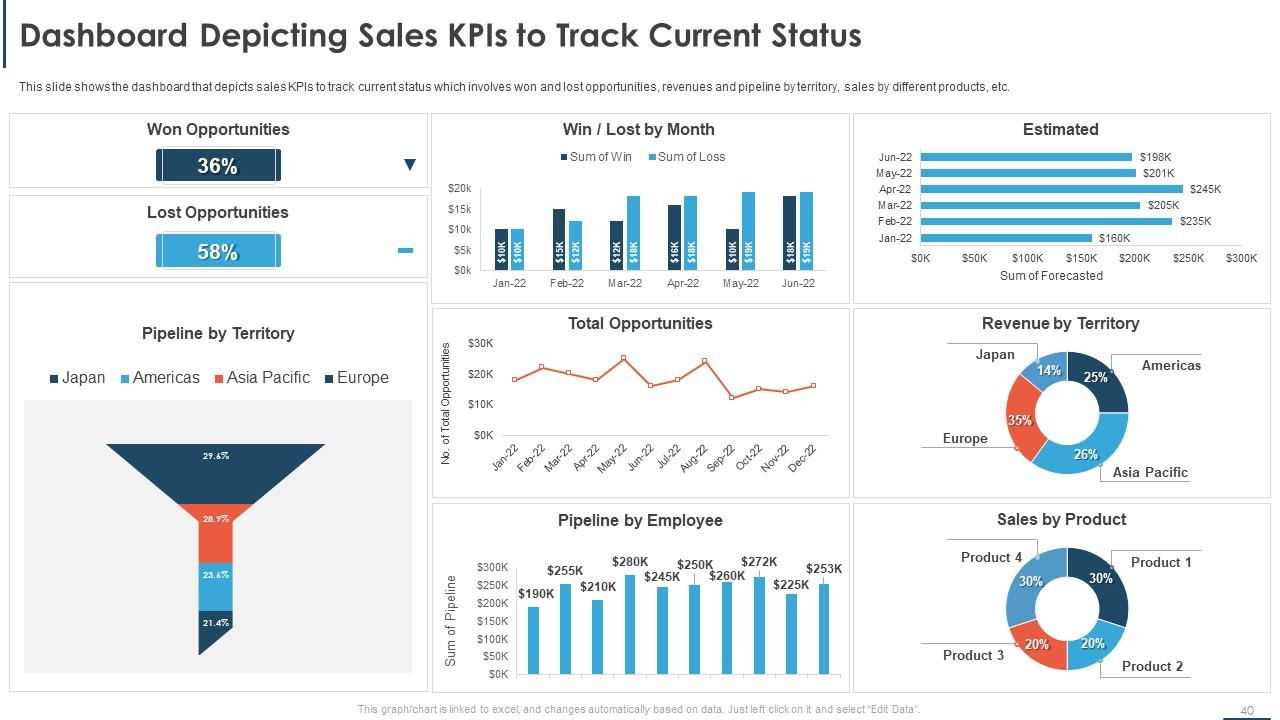
Slide 40: This slide shows the dashboard that depicts sales KPIs to track current status which involves won and lost opportunities, revenues and pipeline by territory, sales by different products, etc.
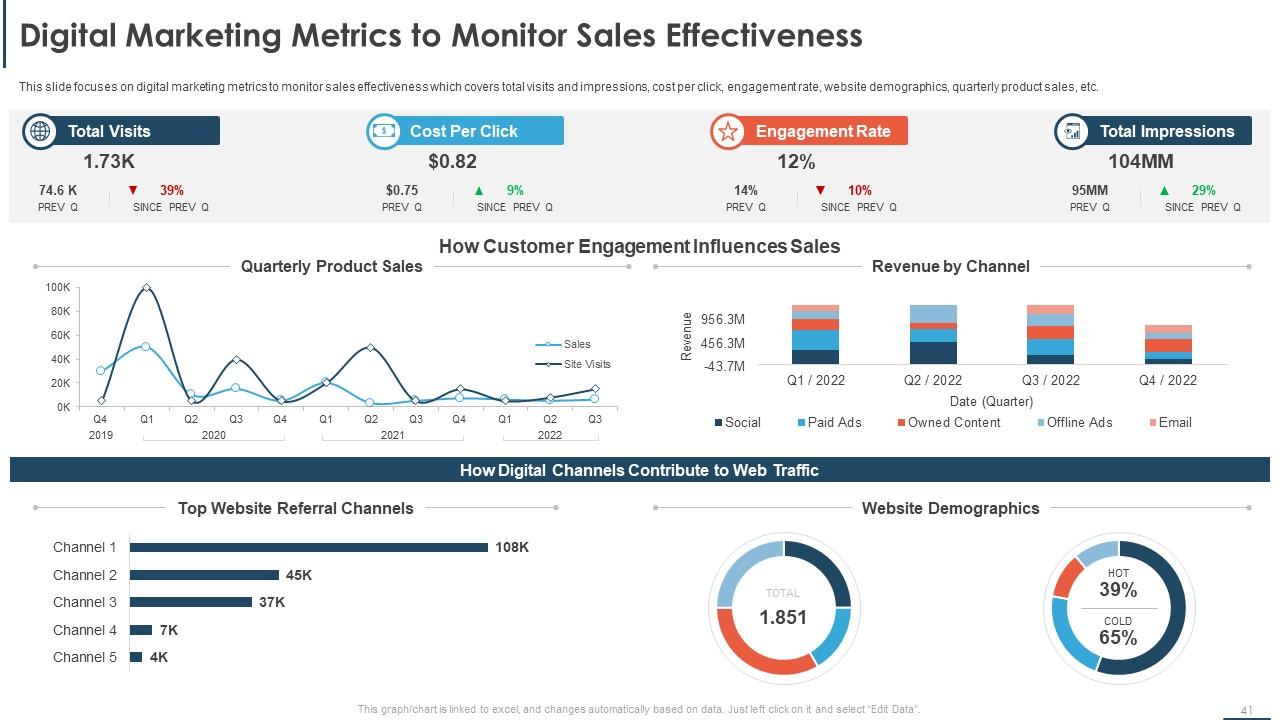
Slide 41: This slide focuses on digital marketing metrics to monitor sales effectiveness which covers total visits and impressions, cost per click, engagement rate, website demographics, quarterly product sales, etc.
Slide 42: This is Icons Slide Automating Sales Processes to Improve Revenues
Slide 43: This is Additional Slides
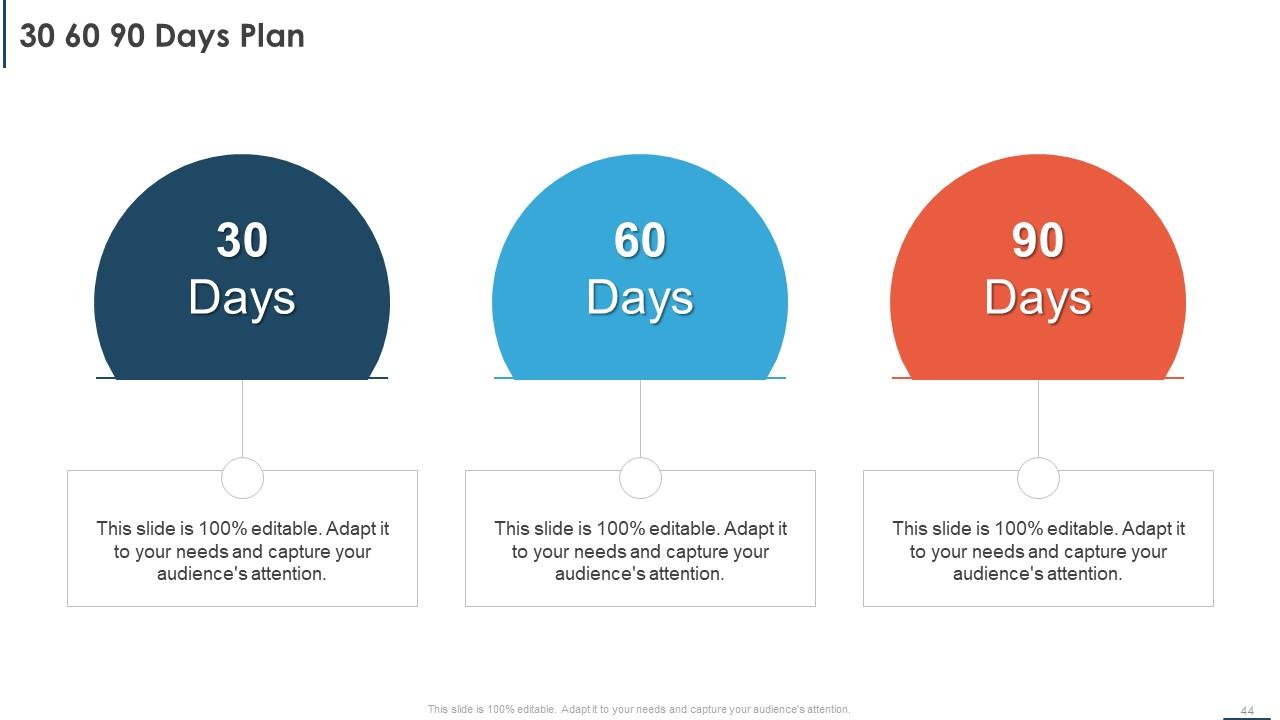
Slide 44: This is a 30 60 90 Days Plan slide that can be used to create plans.
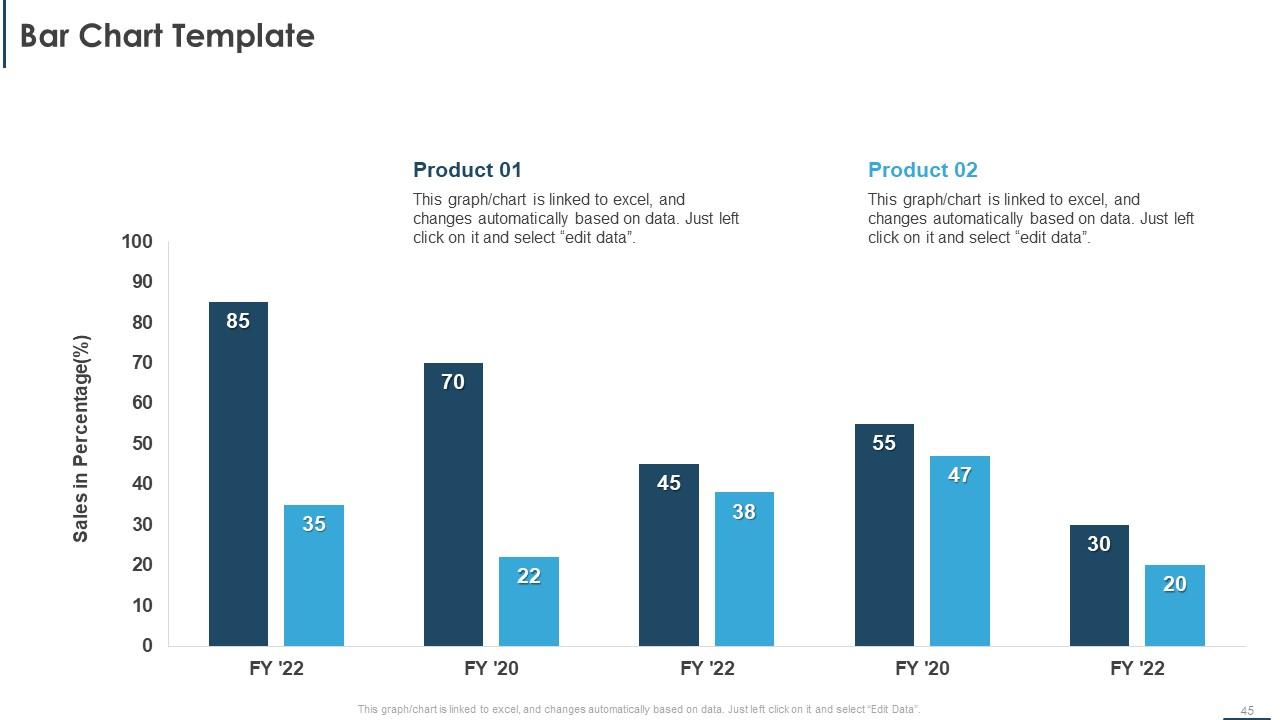
Slide 45: This is a Bar Chart Template that can be used to compare different products.
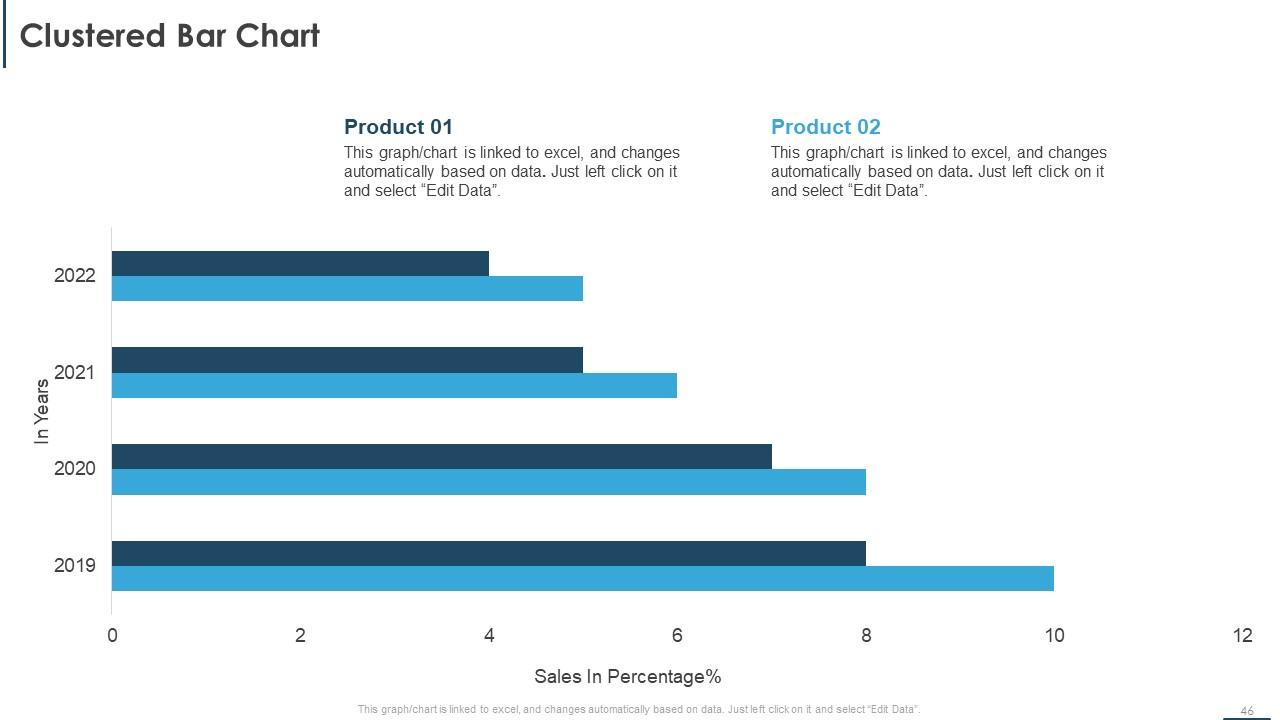
Slide 46: This is a Clustered Bar Chart slide that can be used to compare different elements.
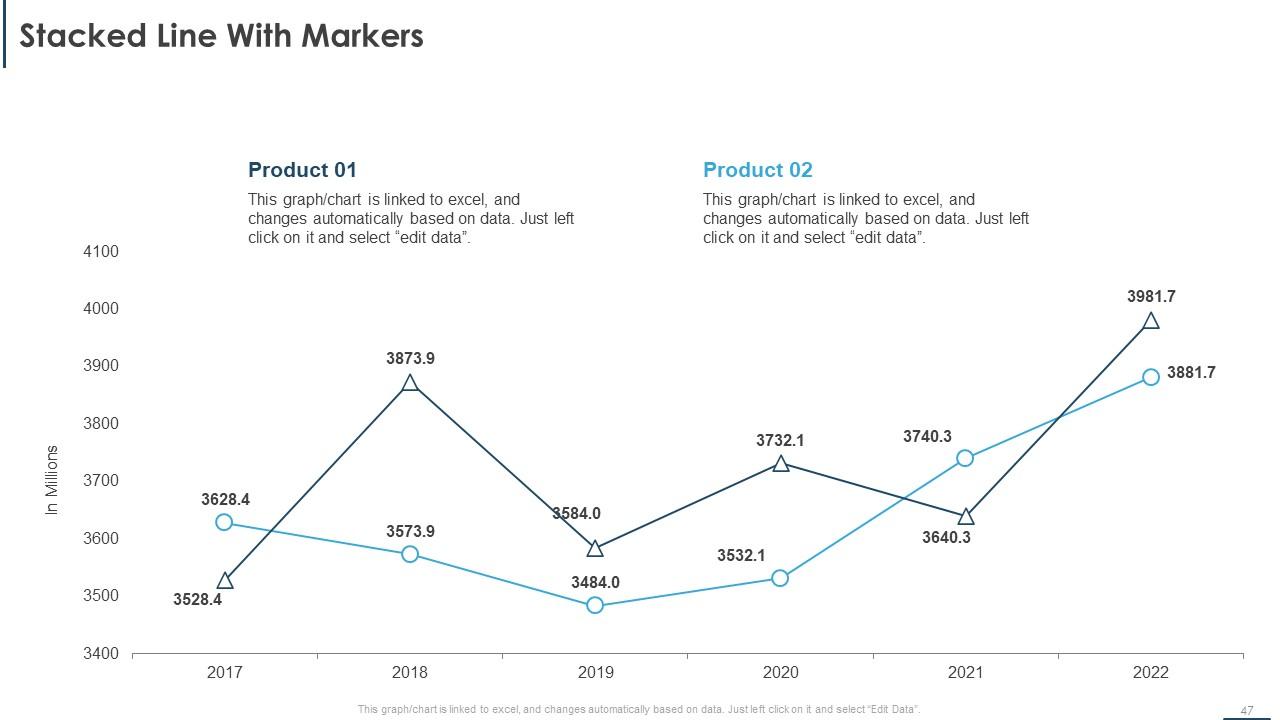
Slide 47: This is a Stacked Line With Markers chart slide that can be used to compare two products.
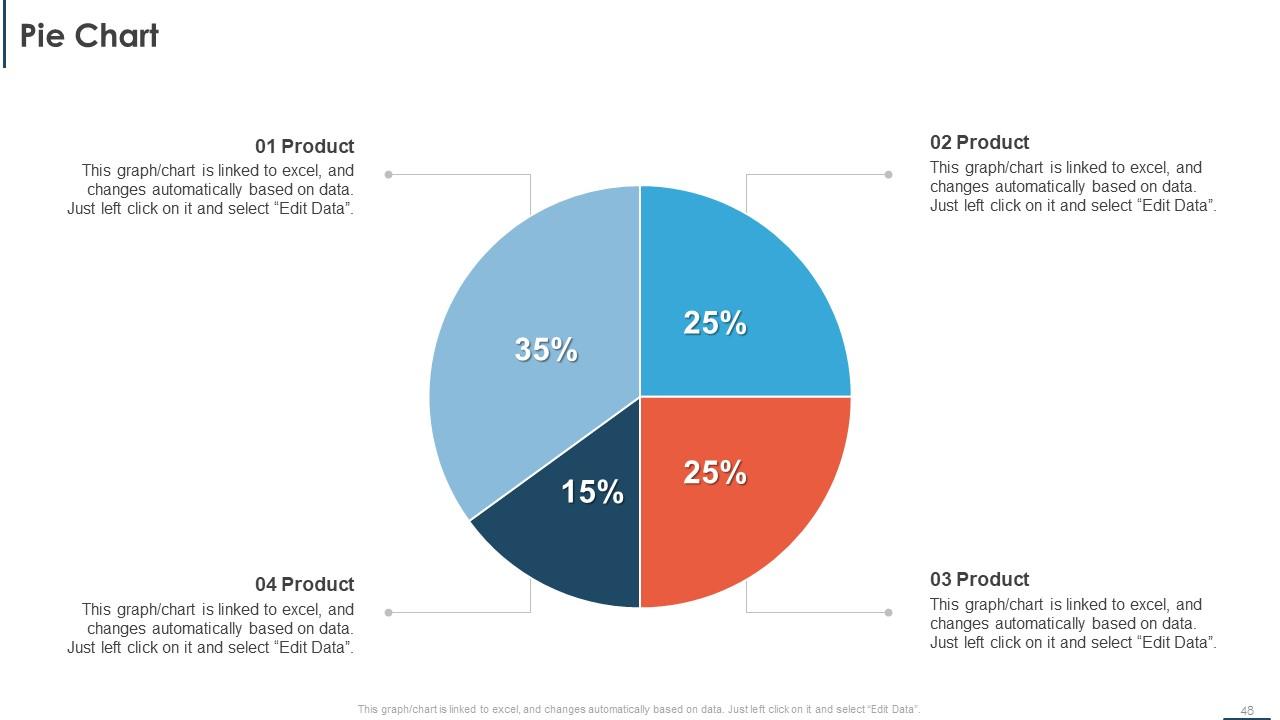
Slide 48: This is a Pie Chart slide to showcase the market segment of each product.
Slide 49: This is Meet Our Team slide to introduce your staff.
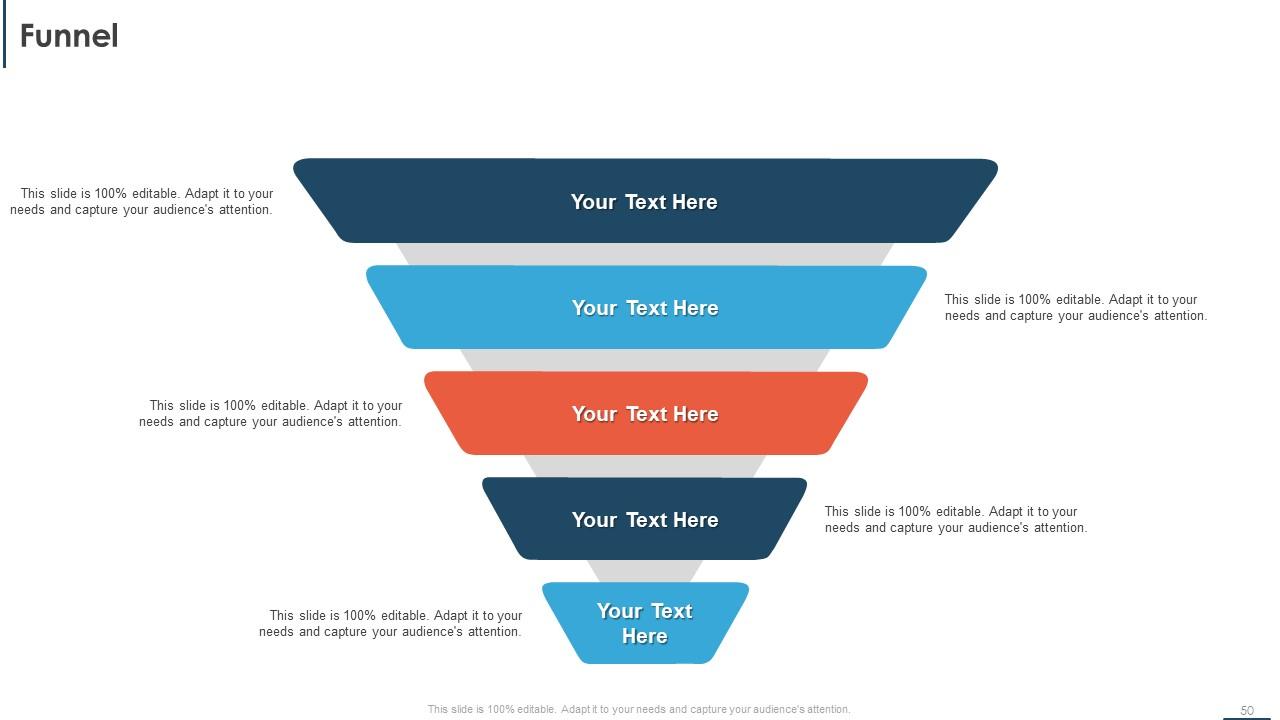
Slide 50: This is a Funnel slide that can be used to illustrate the results of a process.
Slide 51: This is a Target slide that can be used to present your goals and targets.
Slide 52: This is a Venn diagram slide that can be used to compare three different elements.
Slide 53: This is a Silhouettes slide to present the job roles and designation of each employee.
Slide 54: This is a Magnifying Glass slide to highlight an important information.
Slide 55: This is a Circular Diagram slide to present continous series of events.
Slide 56: This is a Post it Notes slide that can be used to present important information.
Slide 57: This is a Puzzle slide that can be used for idea generation.
Slide 58: This is Our Goal slide to present your goals and aspirations.
Slide 59: This is a Magnifying Glass slide to highlight an important information.
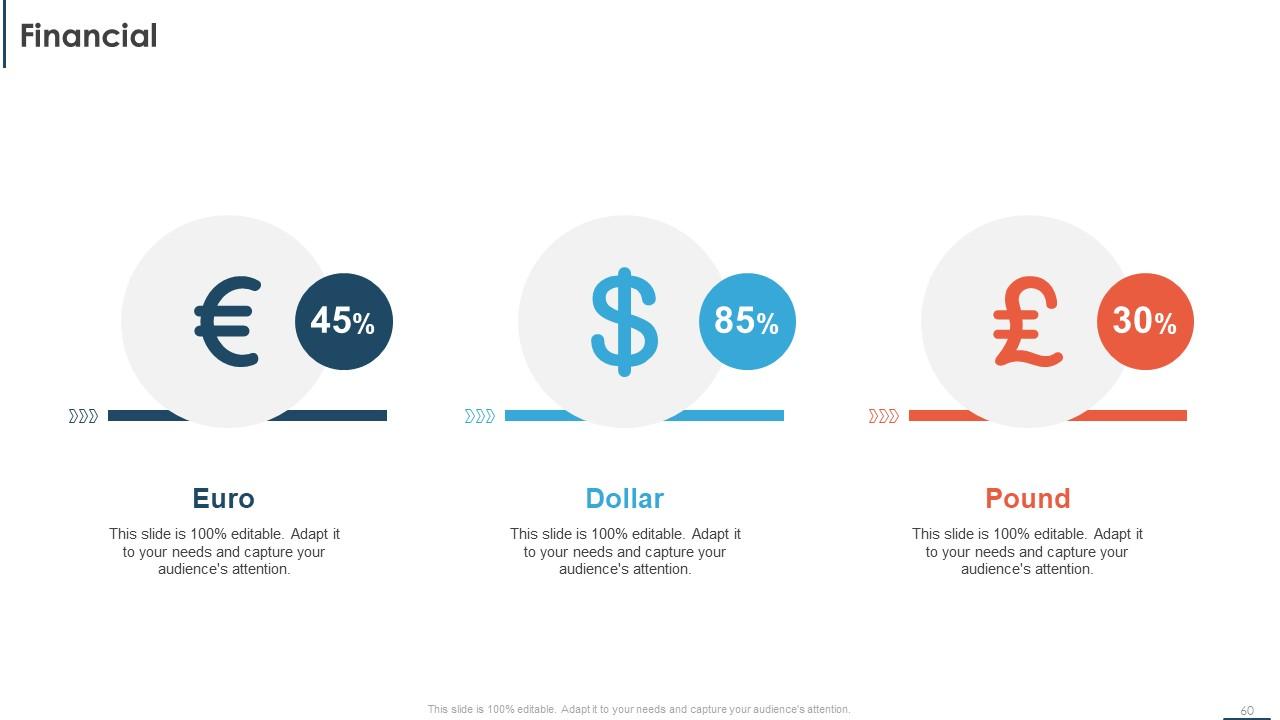
Slide 60: This is the Financial slide to present your company's finances.
Slide 61: This is a Idea Generation slide for welcoming new ideas.
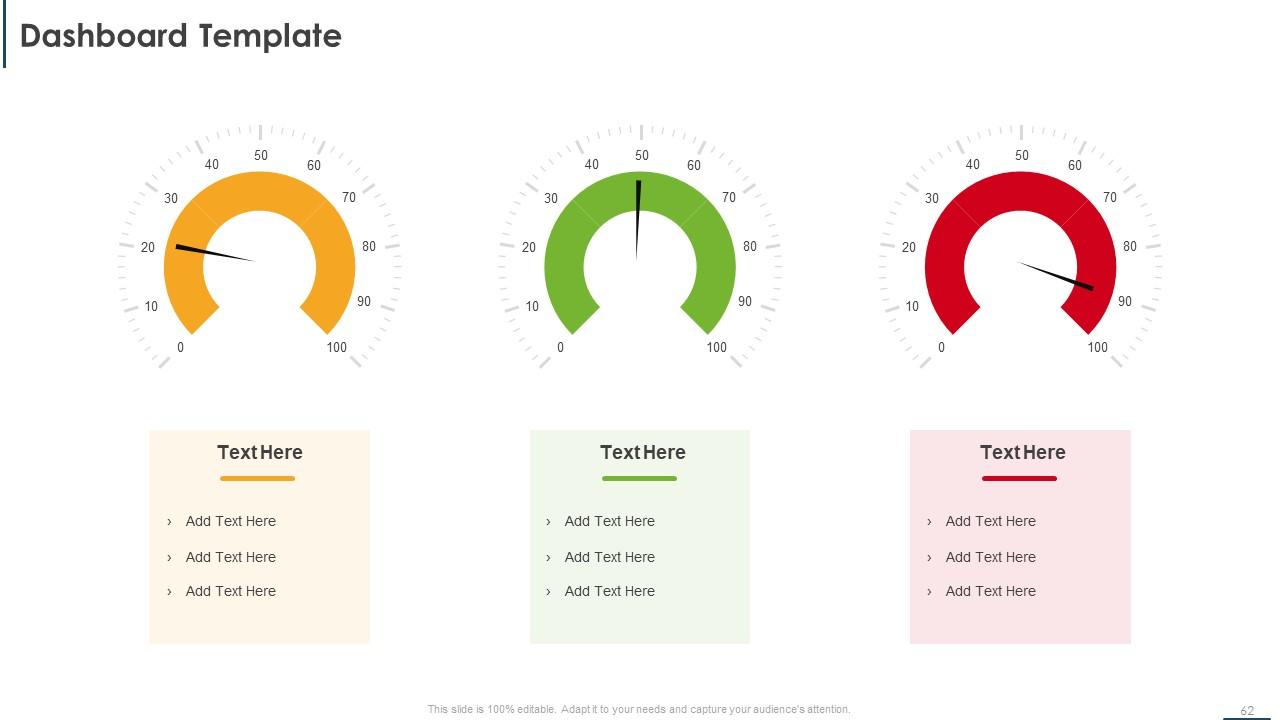
Slide 62: This is a Dashboard Template to present the KPIs.
Slide 63: This is the Organization Chart slide to present organizational structure.
Slide 64: This is a Thank You slide for acknowledgment.
Automating Sales Processes To Increase Revenues Powerpoint Presentation Slides with all 69 slides:
Use our Automating Sales Processes To Increase Revenues Powerpoint Presentation Slides to effectively help you save your valuable time. They are readymade to fit into any presentation structure.
-
I downloaded some of the presentations for work. They were simple to modify and saved me a lot of time and effort.
-
Excellent products for quick understanding.


