Balanced performance summary ppt background
Introducing Balanced Performance Summary PPT Background depicting the characteristics which are useful in completing some specific agenda or task of an organization. With the help of this template you can keep a record on the activities that are executed by the employees. The balanced performance presentation slide highlights some important features which help to plan strategically. This template includes various key factors which help in determining the production of financial and non-financial data items. The slide basically consists of major facts which are useful for measuring the performance appropriately. This template consists of a variety of high-quality icons with which you can build and analyse your strategies differently. Balanced Performance PowerPoint presentation depicts an attractive diagram in the form of chart and sheets in which the ideas and thoughts are recorded which helps an organization in implementing each and every information clearly. Therefore, download this ready to use PPT to build more plans and ideas which helps in increasing your business.
You must be logged in to download this presentation.
PowerPoint presentation slides
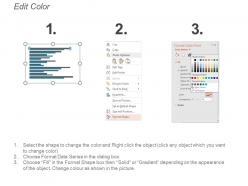
Presenting Balanced Performance Summary PPT Background which is professionally designed and 100% editable. You can customize the color, fonts, font size and font types as per the requirement. This slide is adaptable with the Google Slides which makes it easily accessible at once. Can be converted into formats like PDF, JPG and PNG. It is available in both standard and widescreen. You can modify the shape of the diagram which makes your presentation look even more engaging.
People who downloaded this PowerPoint presentation also viewed the following :
Content of this Powerpoint Presentation
Description:
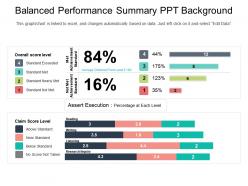
The image depicts a PowerPoint slide background designed for presenting a "Balanced Performance Summary." This slide serves as a visual representation of performance data that can be dynamically linked and updated from an Excel source. Here is an overview of the slide's components:
1. Automatic Data Update Notification:
At the top of the slide, there is a notification indicating that the graph/chart updates automatically based on the data. It also provides instructions on how to edit the data, emphasizing the slide's dynamic and customizable nature.
2. Overall Score Level:
This section presents a color-coded key with four levels, ranging from 'Standard Not Met' (Level 1 in red) to 'Standard Exceeded' (Level 4 in green). A bar graph is provided to illustrate the percentage of achievements at each level. In this example, 84% of the achievements fall within or exceed the standard (Levels 3 and 4 combined), while 16% of the achievements nearly meet or do not meet the standard (Levels 1 and 2 combined). Additionally, the slide mentions the average distance from Level 3, which is 82%.
3. Asset Execution:
This section breaks down performance into different claim score levels for various skills: Reading, Writing, Listening, and Research/Inquiry. Each skill has its horizontal bar graph, displaying the percentage distribution of scores categorized as 'Above Standard,' 'Near Standard,' 'Below Standard,' and 'No Score/Not Taken.'
Use Cases:
This performance summary slide is versatile and can be applied across various industries for performance evaluation and reporting purposes. Here are seven industries where this slide can be particularly useful:
1. Education:
Use: Displaying student performance across various subjects or skills.
Presenter: Teachers or academic administrators.
Audience: Educators, students, or parents.
2. Corporate Training:
Use: Evaluating employee training outcomes.
Presenter: Training managers or HR professionals.
Audience: Company executives or employees.
3. Healthcare:
Use: Reporting on healthcare quality measures.
Presenter: Quality assurance teams.
Audience: Healthcare providers or administrative staff.
4. Manufacturing:
Use: Assessing product quality control levels.
Presenter: Quality control analysts.
Audience: Manufacturing staff or management.
5. Retail:
Use: Summarizing customer service satisfaction levels.
Presenter: Customer service managers.
Audience: Store managers or customer service teams.
6. Technology:
Use: Analyzing user experience testing results.
Presenter: User experience researchers.
Audience: Design and development teams.
7. Financial Services:
Use: Reviewing compliance training scores.
Presenter: Compliance officers.
Audience: Financial analysts or banking staff.
Balanced performance summary ppt background with all 5 slides:
Bring in the glamour with our Balanced Performance Summary Ppt Background. Charm the audience off their feet.
-
Unique design & color.
-
Wonderful templates design to use in business meetings.


