

Balanced scorecard powerpoint presentation slides





Try Before you Buy Download Free Sample Product
 Impress Your
 Audience
 100%
100% Editable
 Save Hours
 of Time


Build a strategic management tool for your business in the form of this exclusive balance scorecard PowerPoint presentation slides. Use this balance scorecard PPT design to describe different prospective of your organization which are described as financial perspective, customer or investors perspective, organizational growth perspective and the internal process perspective. This Balanced Scorecard PPT layout explains the essential uses of the maintaining the balance scorecard for strategically developments of your organization as it also helps in analyzing various functions of your business and explains other factors which may affect the growth rate of your organization. This Balanced Scorecard presentation template will work as an effective management strategic tool to manage as well as monitor the strategic targets for the company. Thus you are just a click away from owning this professional designed PowerPoint image for your business to explain your subject matter in a very ingenious way. Gaze into the crystal ball with our Balanced Scorecard Powerpoint Presentation Slides. They give you the gift of foresight.
People who downloaded this PowerPoint presentation also viewed the following :
Content of this Powerpoint Presentation
A balanced scorecard is an essential strategic tool for organizations, as it helps its divisions get on the same page regarding strategic objectives and performance measures. This balanced scorecard is a performance metric used in strategic management, which helps an organization recognize and improve internal functions of a business and their resulting outcomes.
In today’s business environment, companies need Balanced Scorecard presentation slides to provide an overview of an organization’s progress and derive strategies. Organizations must set clear goals and go beyond traditional financial measures, which will include internal progress, customer satisfaction, learning, and growth.
If you want a PPT template to introduce a balanced scorecard, you've come to the right place. Get it now!
SlideTeam has prepared a PPT Deck for you, which offers a series of slides highlighting the balanced scorecard. These slides will give you a brief introduction to the topic, its need, perspective, implementation, strategy map, execution level, and performance dashboard. To improve an organization’s performance, You can easily find the whereabouts of a business through these templates.
Download our balanced scorecard PPT templates for your company's performance and strategy management!!
Template 1: Concept

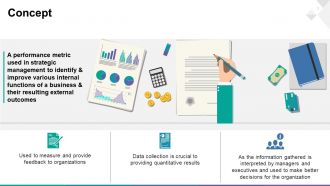
This PPT Template helps in defining the concept of a balanced scorecard and its use through impressive and captivating visuals. It helps you define the importance of performance metrics, which are used in the strategic management of a business and their resulting external outcomes. The benefit of data collection, feedback, and interpretation of gathered information is also described in this slide.
Template 2: Need for Balanced Scorecard
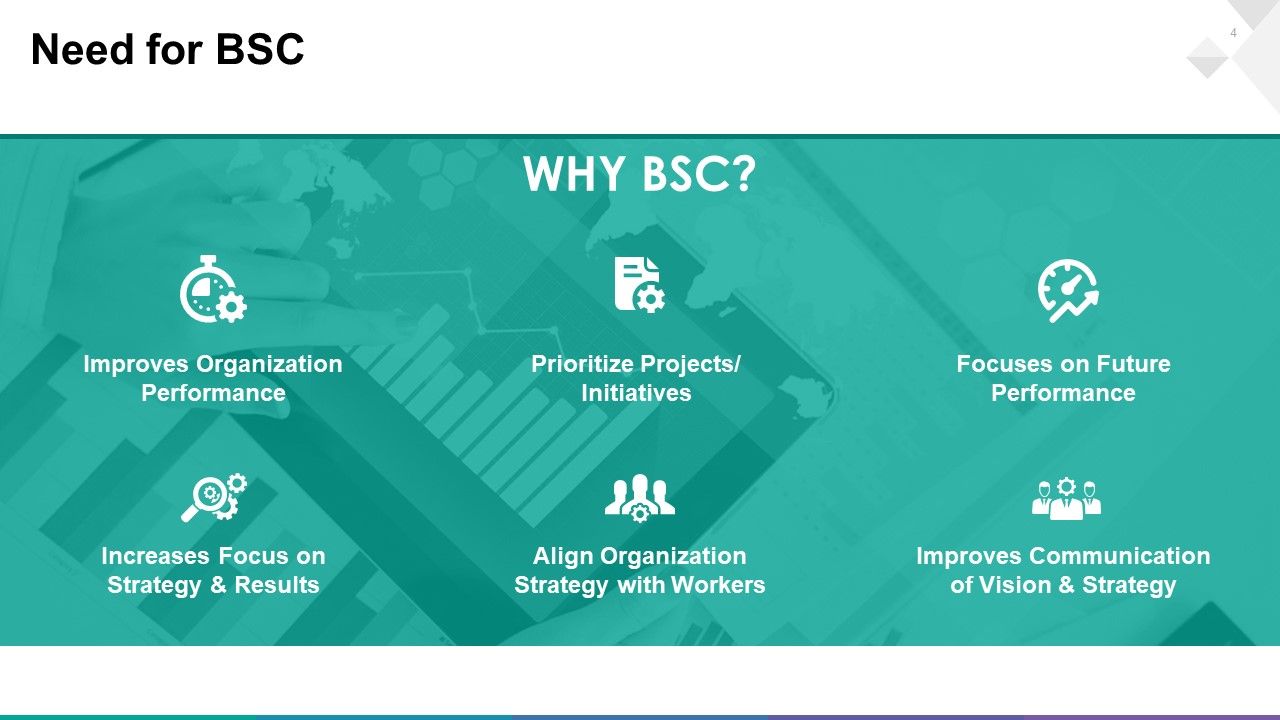
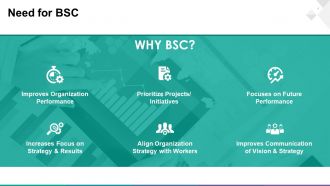
The question that must arise in your mind is, what is the need for a balanced scorecard? These PPT slides answer this question by highlighting the benefits of a balanced scorecard. These will improve organization performance, prioritize projects or initiatives, focus on future performance, increase focus on strategy and results, align organization strategy with workers, and improve communication of vision and strategy; all this is illustrated in this particular template.
Template 3: BSC- Perspectives
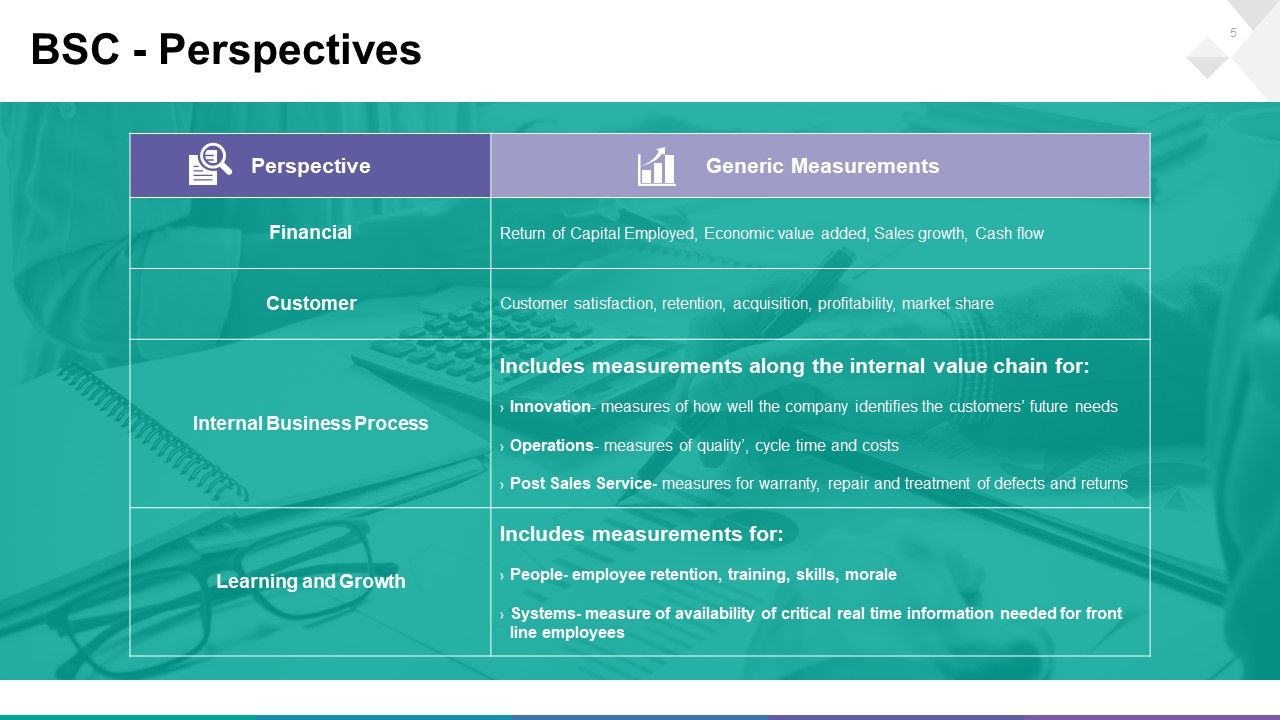
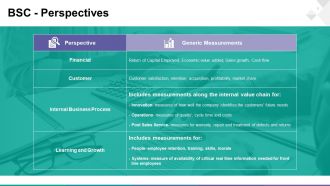
The company has several components which play a huge role in its success. This template will help you track your organization’s progress through various perspectives, along with some generic measurements. There is an opportunity to highlight the financial perspectives, customer, internal business process, and learning & growth. In the following columns, you can highlight the generic measurements related to these perspectives.
Template 4: BSC Perspectives- Measurement
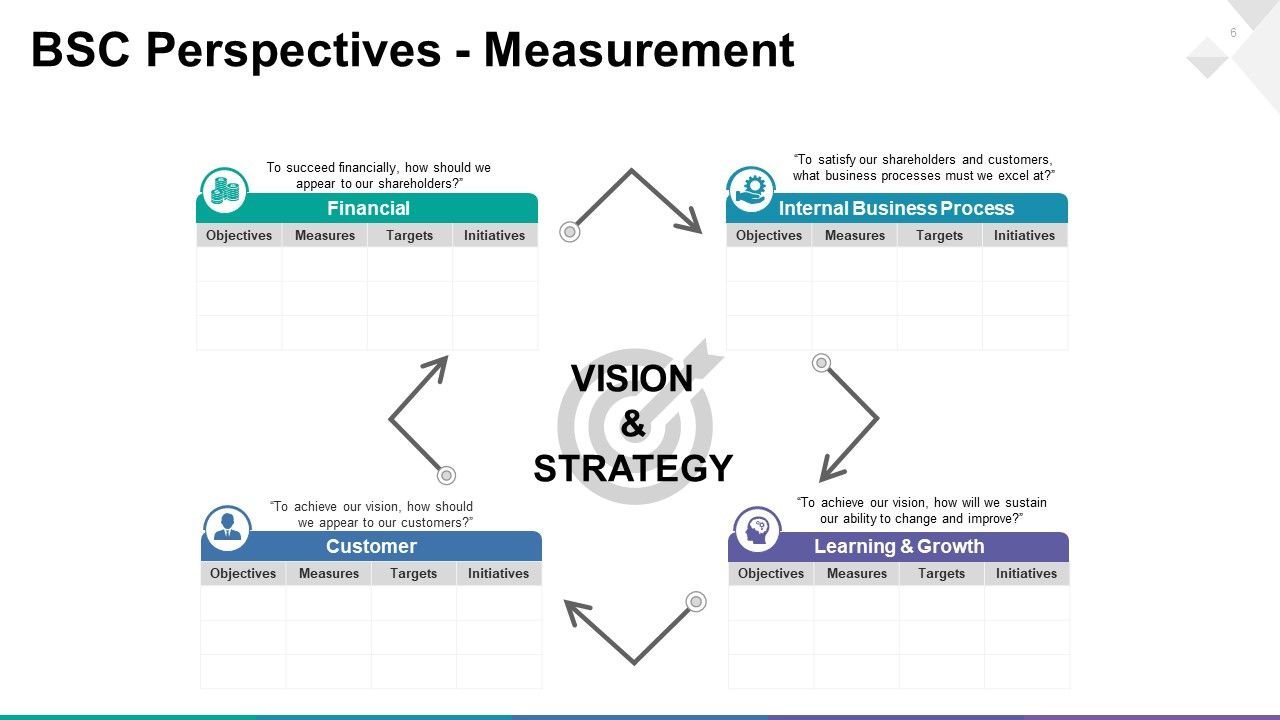
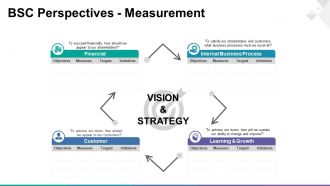
The slide demonstrates a company’s vision and strategy. It will help you provide perspectives, such as financial, internal business process, learning and growth, and customer. You can also demonstrate objectives, measures, targets, and initiatives. The icons are innovative and captivating and help you demonstrate your company's vision and strategy well.
Template 5: Balanced Scorecard Implementation PPT Templates
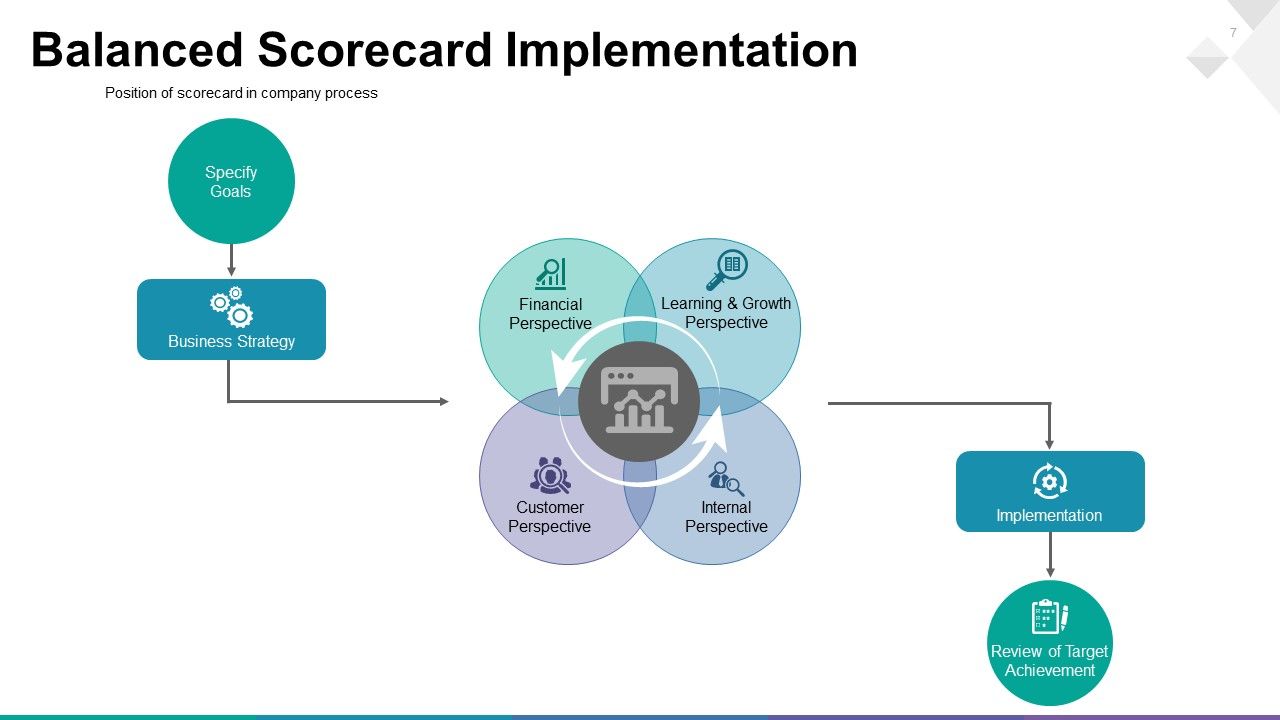
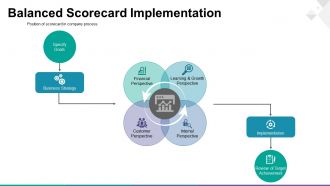
Through a flowchart that has been provided in this PPT template, you can specify goals, build business strategies, implement strategies, and review the target achieved. The template will help you demonstrate the scorecard with coloured schemes. You can build strategies while keeping financial, internal, customer, and learning & growth perspectives in mind.
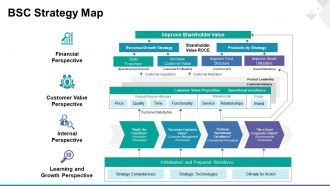
Template 6: BSC Strategy Map
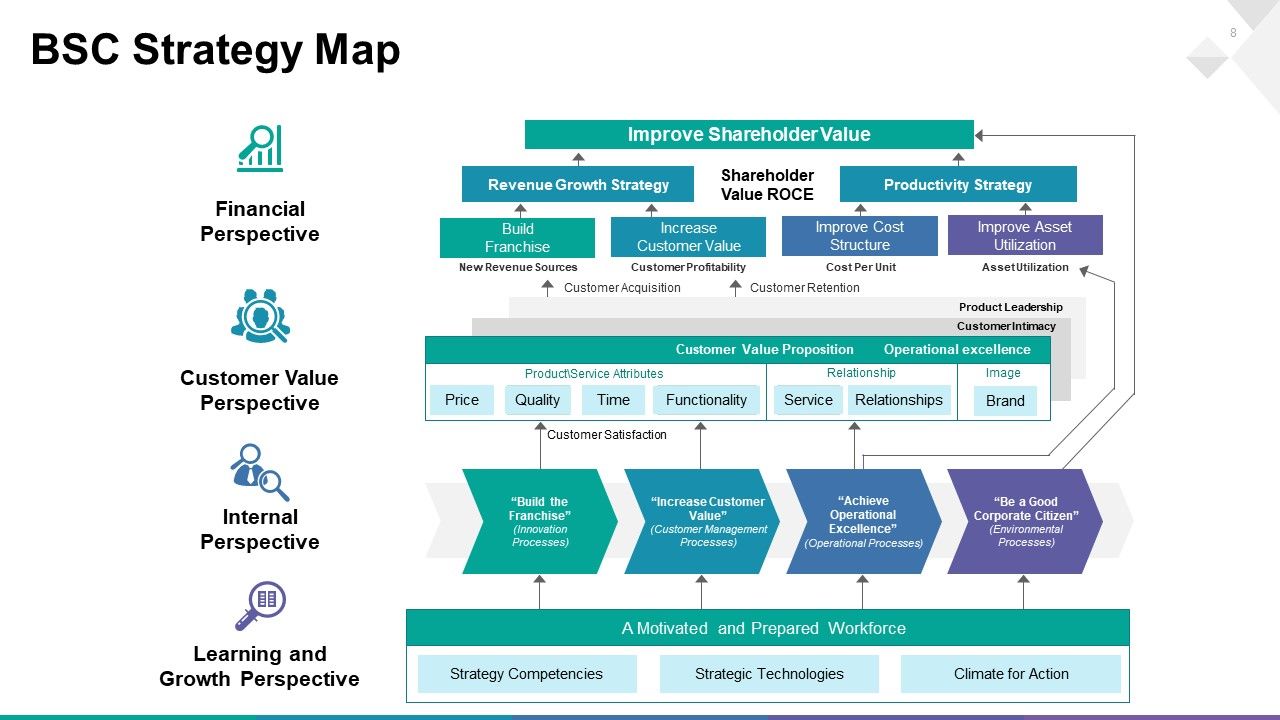
This template presents you with a strategy map to improve shareholder value by demonstrating revenue growth strategy and productivity, increasing customer value, building franchise, improving cost structure, and improving asset use. This template states the customer value proposition with price, quality, time, functionality, service, relationships, and brand.
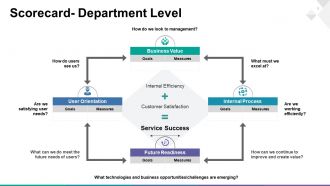
Template 7: Scorecard Department Level
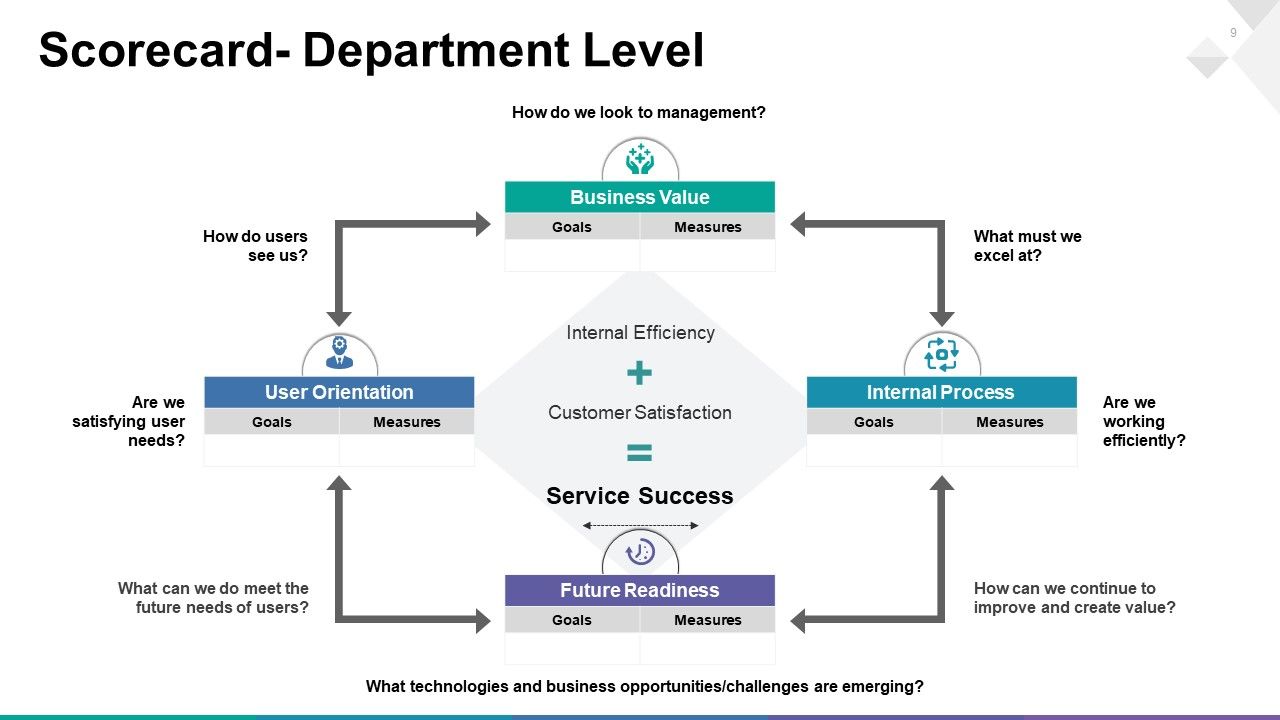
Many factors contribute to the business value of your company. This slide provides you with the opportunity to highlight the internal process, future readiness, and user orientation. The slide also unveils the mantra of the success of your organization, which is that internal efficiency + customer satisfaction provide service success.
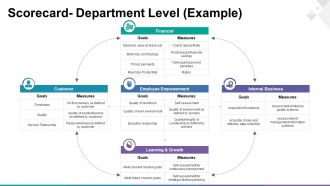
Template 8: Scorecard- Department Level (Example)
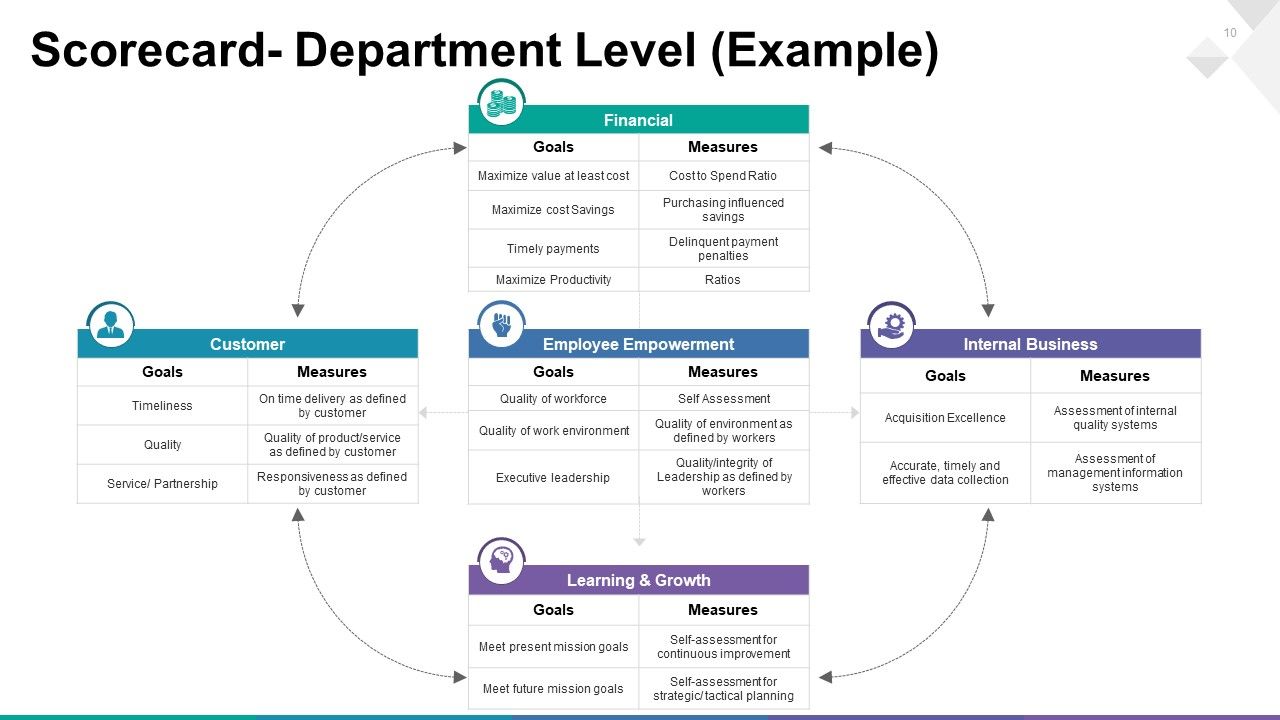
Goals and measures for improving departments within an organization can be demonstrated through the templates. The departments that can be discussed are internal business, financial, learning and growth, customer, employee empowerment, and customer. This specific template will help you achieve the strategic objectives desired by the company.
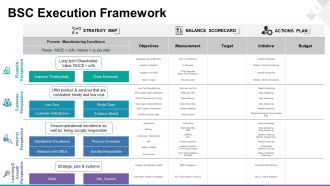
Template 9: BSC Executive Framework

You can ease out strategy execution with this PPT Template. Demonstrate objectives, measurements, targets, initiatives, and budgets of processes through this strategy map. This template will help you ensure operational excellence and social responsibility and ensure your business moves toward becoming a process-ridden company.
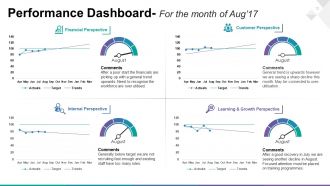
Template 10: Performance Dashboard
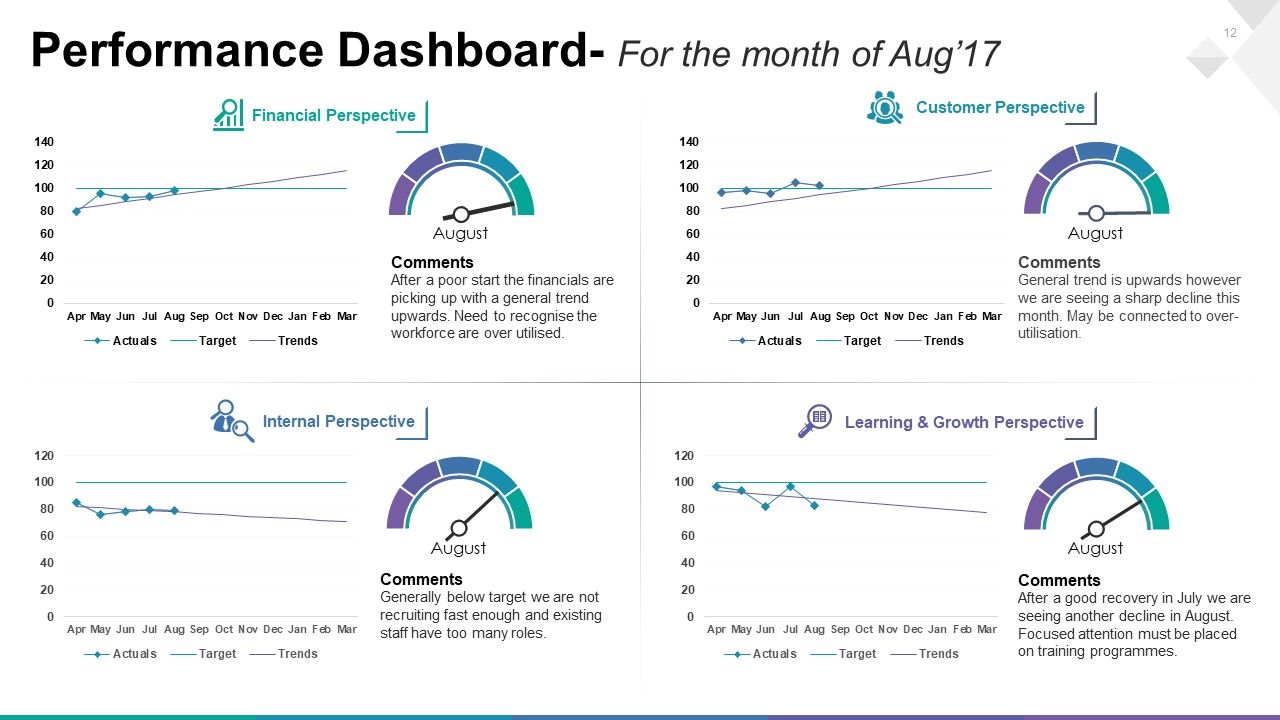
Performance dashboard is an essential tool to monitor, analyze, and improve their performance. This template will help you get real-time insights so that organizations can make decisions and drive strategic initiatives. Our performance dashboard templates will provide a visually appealing and easy-to-understand way to track progress toward goals, identify trends, and pinpoint areas for improvement.
PROCESSES MUST ALWAYS BE TOP-CLASS
Our ready-to-use balanced scorecard PPT Templates will help you explore varied perspectives and provide a comprehensive framework that goes beyond traditional financial measures to include critical aspects of performance, such as customer satisfaction, internal processes, and more. A company needs to have a balanced scorecard to achieve strategic objectives and improve its overall performance.
PS Download PPT Templates for organizational performance Management KPI Balanced Scorecard!!!
Balanced scorecard powerpoint presentation slides with all 32 slides:
Our Balanced Scorecard Powerpoint Presentation Slides ensure competency. They extract the best from you.





FAQs for Balanced scorecard
So there's four parts: Financial, Customer, Internal Process, and Learning & Growth. Picture them stacked up - you work from the bottom. Start with Learning & Growth (like training your people, better systems), that helps your Internal Processes run smoother, which makes customers happier, and boom - better financial results. It's backwards from how most people think, but it actually works. The whole point is you can't just watch the money numbers. You need those early warning signs from the other areas to see what's coming. Oh, and try sketching out how one improvement flows into the next - makes it way clearer.
Honestly, leadership buy-in is everything - without that you're screwed from day one. Map your four perspectives (financial, customer, internal processes, learning & growth) with 3-5 metrics each. Here's the thing though - don't just throw random KPIs together and call it balanced. I've watched companies do exactly that and wonder why nothing improves. The magic happens when you connect cause-and-effect relationships between all four areas. Oh, and definitely explain the "why" to your team. People work way harder when they actually see how their daily tasks move the needle on bigger goals.
So the Balanced Scorecard is basically your strategy translator - it takes those high-level business goals and breaks them into four areas: financial, customer, internal processes, and learning. Each department can actually see how their daily work connects to the big picture. What's cool is it stops teams from working in their own bubbles (happens everywhere, trust me). Marketing's customer satisfaction numbers link directly to sales revenue, which connects to how efficient operations are running. The trick is making sure everyone's metrics actually roll up to your main objectives. That's honestly where most companies mess it up.
Map your KPIs to those four BSC areas - financial, customer, internal process, and learning & growth. Don't go crazy with vanity metrics that look good but accomplish nothing (I've been there, it's painful). Each KPI needs a target, baseline, and someone who actually owns it. Balance is everything here. Stick to 3-5 per area tops, otherwise you'll drown in data. Review quarterly so you can pivot when needed. Oh, and focus on leading indicators that predict what's coming, not just the stuff that already happened. Those lagging metrics only tell half the story anyway.
Honestly, the biggest pain points are always resistance to change and crappy data quality. Plus leadership goes nuts wanting to track everything at once - I've seen teams get hit with like 20 new metrics overnight, total disaster. Start small instead, maybe 3-4 key measures per area. Middle management buy-in is crucial before you do anything else. Your data sources better be solid or you'll tank your credibility immediately. Connect each metric directly to your strategic goals so people actually get why they're doing this extra work. Oh, and definitely pilot with just one department first to fix the inevitable mess-ups.
So the Balanced Scorecard basically gives you four angles to look at performance - financial stuff, customer metrics, internal processes, and learning/growth. Way better than just staring at revenue numbers all day (which honestly tells you almost nothing). You'll start seeing how things actually connect - like when you train employees, customer satisfaction goes up, then boom, better financials. Everyone gets how their daily grind fits into the bigger picture too. I'd map out what metrics you're already tracking in each area first - you'll probably find some weird gaps you didn't even realize were there.
Honestly, tech is a game-changer for BSC stuff. Pull your metrics automatically with BI tools like Tableau or Power BI - beats doing spreadsheets by hand any day. Real-time dashboards are clutch because everyone can see what's happening instantly. Cloud access means your team doesn't have to be glued to their desks either. Set up alerts so you'll know when KPIs go off track. The visual aspect actually makes sense to executives too, which is half the battle. First step? Figure out where your key metrics live, then find a platform that plays nice with those systems.
Honestly, quarterly reviews work best for most companies I've seen. Do the big overhauls yearly or whenever your strategy gets flipped upside down. First thing - check if your objectives still make sense with where the business is heading. Markets move crazy fast now. Update your KPIs based on what's actually happening with customers and operations. Definitely loop in your key people during revisions. They'll catch stuff you totally missed. Sometimes you can't just adjust numbers - might need to scrap whole perspectives and start fresh. Oh, and set a calendar reminder right now or you'll forget about it for like 8 months (speaking from experience).
So the Balanced Scorecard basically gets everyone speaking the same language. You're not just obsessing over revenue anymore - suddenly you're tracking customer happiness, how your people are growing, operational stuff too. Think of it like your car's dashboard showing everything, not just speed. Your team actually sees how their boring daily tasks connect to these four areas, which honestly makes meetings way less painful. Accountability becomes automatic because people know their specific metrics and how they fit the bigger picture. Oh, and figure out which of the four perspectives your job touches most - that's your starting point.
Healthcare, finance, and manufacturing companies have crushed it with Balanced Scorecards. Makes sense since they're already tracking a million metrics anyway - BSC just helps organize the chaos. You'll get one clean view of financials, customer happiness, internal ops, and team development. Hospitals are obsessed with it because patient care vs. profits is always this weird balancing act. Oh, and manufacturing loves the process optimization angle. Start by throwing your current KPIs into those four buckets and see what's missing. Trust me, the gaps will be obvious once you map it out properly.
Okay so the Balanced Scorecard thing is actually pretty straightforward for small businesses. You're looking at four areas: money stuff, how happy your customers are, your internal processes, and whether your team is learning/growing. Don't overcomplicate it - I've seen people waste time on fancy tools when a basic spreadsheet does the job. Pick maybe 3-4 things to track in each area that actually move the needle. Cash flow, customer retention, delivery speed, training hours - whatever fits your business. Here's the cool part: you'll start seeing connections everywhere. Better trained staff = happier customers = more money coming in. Just review monthly and pivot when needed.
So basically, old-school performance systems just track money stuff - revenue, profits, costs. Pretty one-dimensional if you ask me. Balanced Scorecards are way smarter because they look at four areas: financial, customer satisfaction, internal processes, and how well your team is learning/growing. Here's the thing - financial reports only show what already happened. Balanced Scorecards give you early warning signs through stuff like customer happiness scores or training metrics. Those actually predict where you're headed. Honestly, if you're stuck with just financial reports right now, try pushing for some customer or employee metrics too. You'll get a much clearer picture of what's really going on.
The Balanced Scorecard is clutch for catching strategic risks early. You're not just staring at financial numbers - you've got four different angles showing what's actually happening. Customer satisfaction tanking while revenue still looks decent? That's your warning sign right there. Think of it like your car's dashboard - way better to see the warning lights than wait for the engine to die on the highway (been there, not fun). Learning & growth metrics, internal processes, customer stuff - they all tell you when things are getting misaligned. Regular check-ins across all four areas help you catch problems before they blow up into full crises.
So here's the thing about Balanced Scorecards - they actually make your company culture way more visible. You're measuring stuff across financial, customer, process, and learning areas, which basically shows everyone what you actually care about (not just what you say you care about in meetings). People start acting differently when they see what's being tracked. Measure employee development? Suddenly learning matters more. Track customer satisfaction? Service becomes everyone's focus. The tricky part is picking metrics that match the culture you want, not just whatever's easiest to count. Makes culture feel less abstract, I guess.
Hey! So with non-profits you basically flip the whole thing upside down. Mission impact goes at the top - how many people you're helping, what outcomes you're getting, that sort of thing. Your "customers" become all your stakeholders (donors, volunteers, the people you serve). Learning and growth stays pretty much the same, which is nice. Instead of financial stuff though - and this is where it gets interesting - track sustainability metrics like funding sources, cost per person in your programs, how well you keep volunteers around. I mean, that's what actually shows if you're going to survive long-term anyway.
-
Easily Understandable slides.
-
Topic best represented with attractive design.