Today's world is all about digital domination and the knowledge repository available to brands, businesses, and organizations is growing by the second. Strategic usage of this abundance of insights can be a game-changer, fueling innovation, inspiring growth, and establishing a dynamic and efficient commercial apparatus. The secret behind realizing this potential lies in business executive summary dashboards, tools that not only bestow a competitive edge but also usher in a transformative era of business optimization.
Amidst the mass of digital data in our current landscape, the ability to collect, organize, and analyze mission-critical metrics is principal. This mastery positions your organization to achieve remarkable intelligence, exceeding previous boundaries.
How to do that?
The answer: Executive Summary Dashboard Templates– the catalysts for this transformation. These dashboards facilitate the creation of a data-driven environment and empower you and your team with modern dashboard creator tools, automation, and intelligent solutions. The result is a substantial enhancement in productivity and significant cost savings, underscoring the role these tools play in tackling the complexities of the contemporary business landscape.
Dive into our guide on Research Executive Summary Templates for a plot twist that unveils data insights.
Beyond mere functionality, these dashboards pave the way for a data-driven ethos, where the synergy of modern technology and strategic insights drive your empire forward. In this blog, we dig into the intrinsic value of executive dashboard templates, shedding light on their significance and nature in contemporary business practices.
Need expert guidance on strategic decisions? Check out our Consulting Executive Summary Templates for a storyline that transforms complexity into clarity.
Let's explore!
Template 1: Business Executive Summary KPI Dashboard
This PPT Slide provides a clear overview of key financial metrics for effective decision-making. It highlights total income, total expenditure, and net cash flows, offering a quick glance at the financial health of the business. The dashboard further breaks down revenue and expenses, providing a detailed analysis of income sources and expenditure categories. This PPT Set is designed to streamline the presentation of crucial financial information, aiding executives to assess the company's performance and make informed strategic decisions. Ideal for concise and impactful reporting, it ensures a clear understanding of key financial indicators in a visually-compelling format.
Template 2: Data Migration Assessment Executive Summary Dashboard
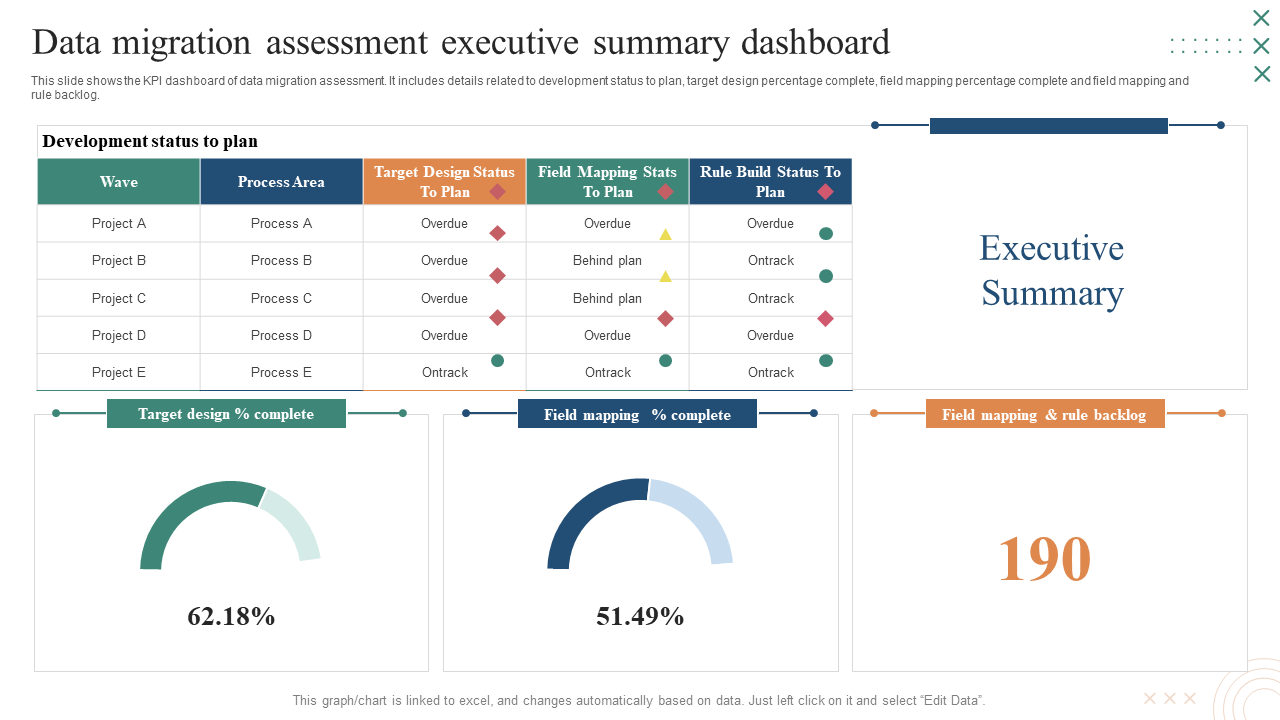
This PPT Framework offers a brief overview of critical aspects of the data migration process. The executive summary section provides a high-level overview, while the Development Status Plan outlines the progress of the migration project. The Target Design % Complete metric gauges the advancement toward the desired data migration design, and the Field Mapping % Complete offers insights into the mapping progress. This template communicates the status of data migration initiatives, facilitating informed decision-making for executives. Focusing on key development and design metrics ensures a concise yet comprehensive representation of the data migration assessment's critical components. Ideal for IT project managers, data migration specialists, and executives overseeing data-related initiatives.
Template 3: Accounting Dashboard with Executive
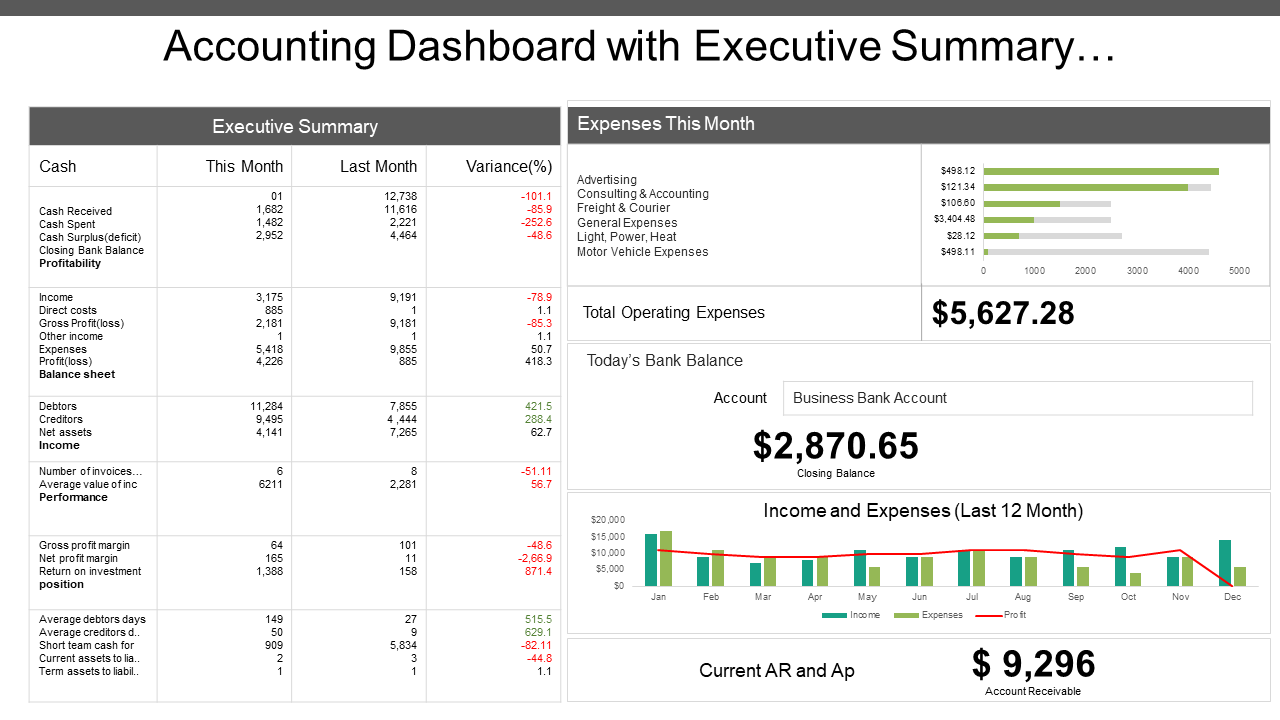
This PPT Template provides a concise and informative snapshot of financial performance. The Executive Summary section highlights key cash metrics for the current and previous months, including variances. It also features a breakdown of expenses for the current month and the total operating expenses. The template further incorporates a visually intuitive representation of income and expenses over the last 12 months, enabling executives to grasp financial trends. With a focus on critical financial data and graphical representation, this template is a powerful tool for conveying key accounting insights, aiding in swift decision-making and strategic financial planning.
Over to You
In the grand finale of our exploration into Executive Summary Dashboards, let's distill the essence of their role in your business narrative. These templates are tools crafted to improve your decision-making processes. They serve as your compass, script, and storyboard—offering clarity, efficiency, and valuable insights.
Download now!


 Customer Reviews


