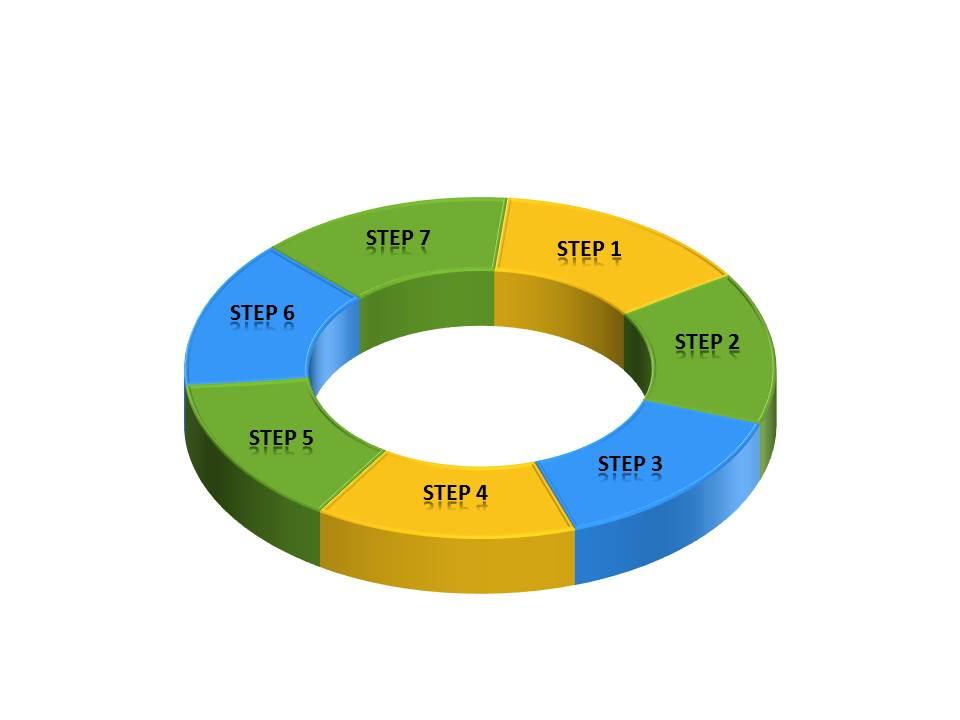
Business workflow diagram 3d circular pie chart statistics powerpoint slides
Coil your thoughts around our Business Workflow Diagram 3d Circular Pie Chart Statistics Powerpoint Slides. Create a magnetic effect on your audience.
Coil your thoughts around our Business Workflow Diagram 3d Circular Pie Chart Statistics Powerpoint Slides. Create a magnet..
- Google Slides is a new FREE Presentation software from Google.
- All our content is 100% compatible with Google Slides.
- Just download our designs, and upload them to Google Slides and they will work automatically.
- Amaze your audience with SlideTeam and Google Slides.
-
Want Changes to This PPT Slide? Check out our Presentation Design Services
- WideScreen Aspect ratio is becoming a very popular format. When you download this product, the downloaded ZIP will contain this product in both standard and widescreen format.
-

- Some older products that we have may only be in standard format, but they can easily be converted to widescreen.
- To do this, please open the SlideTeam product in Powerpoint, and go to
- Design ( On the top bar) -> Page Setup -> and select "On-screen Show (16:9)” in the drop down for "Slides Sized for".
- The slide or theme will change to widescreen, and all graphics will adjust automatically. You can similarly convert our content to any other desired screen aspect ratio.
Compatible With Google Slides

Get This In WideScreen
You must be logged in to download this presentation.
PowerPoint presentation slides
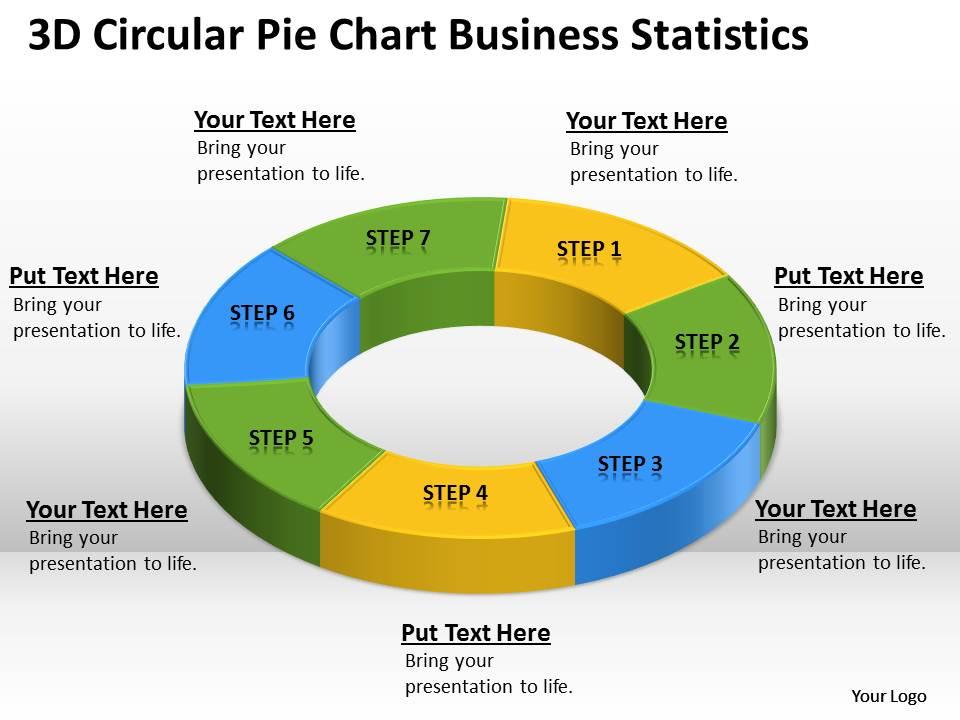
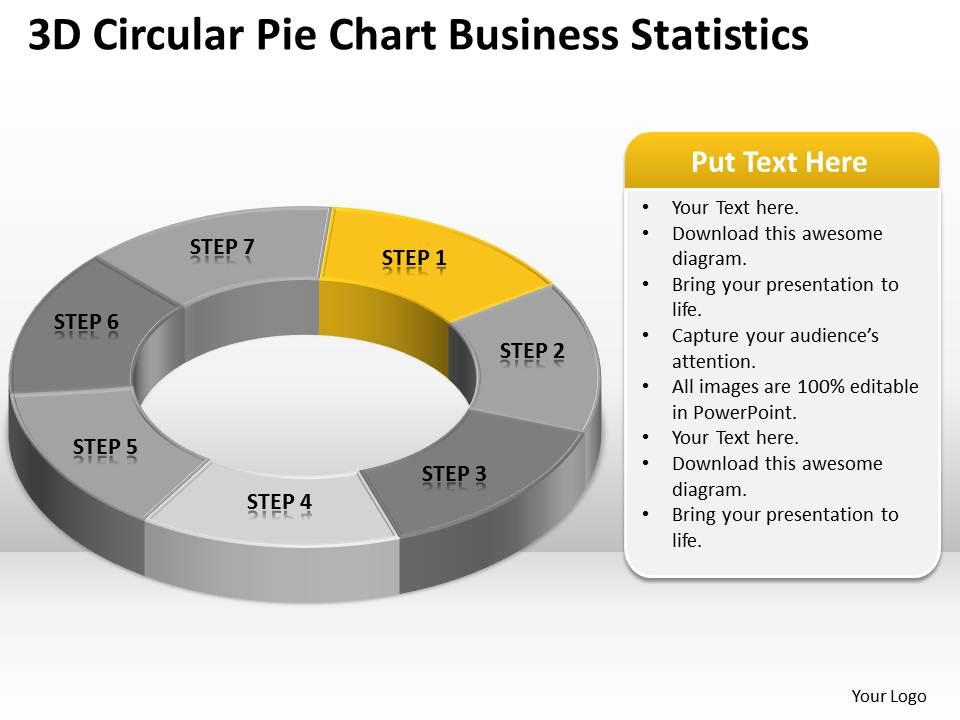
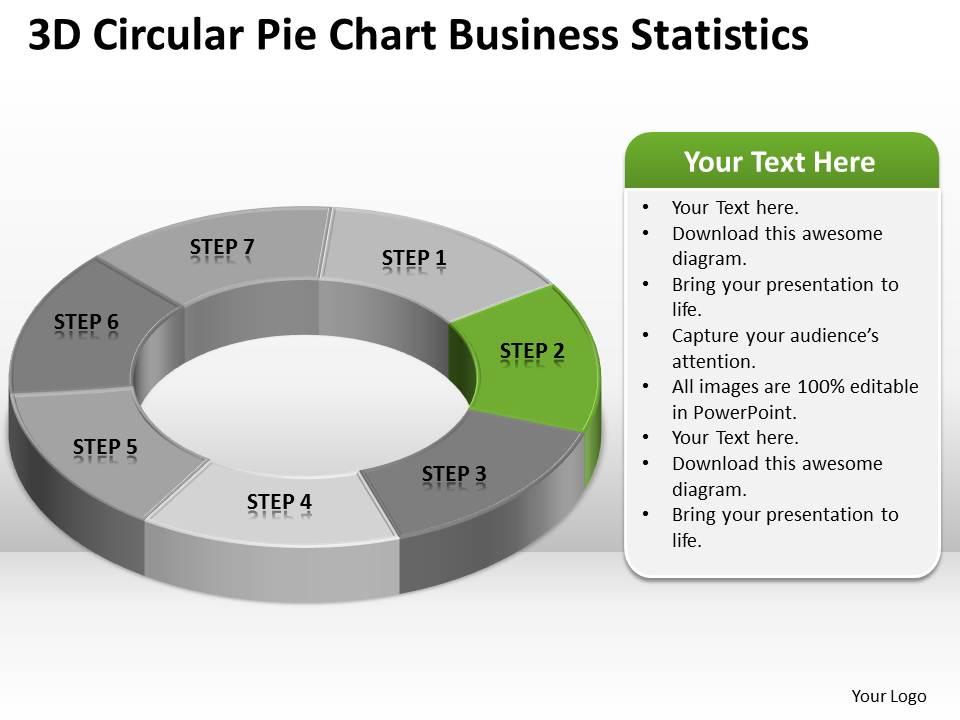
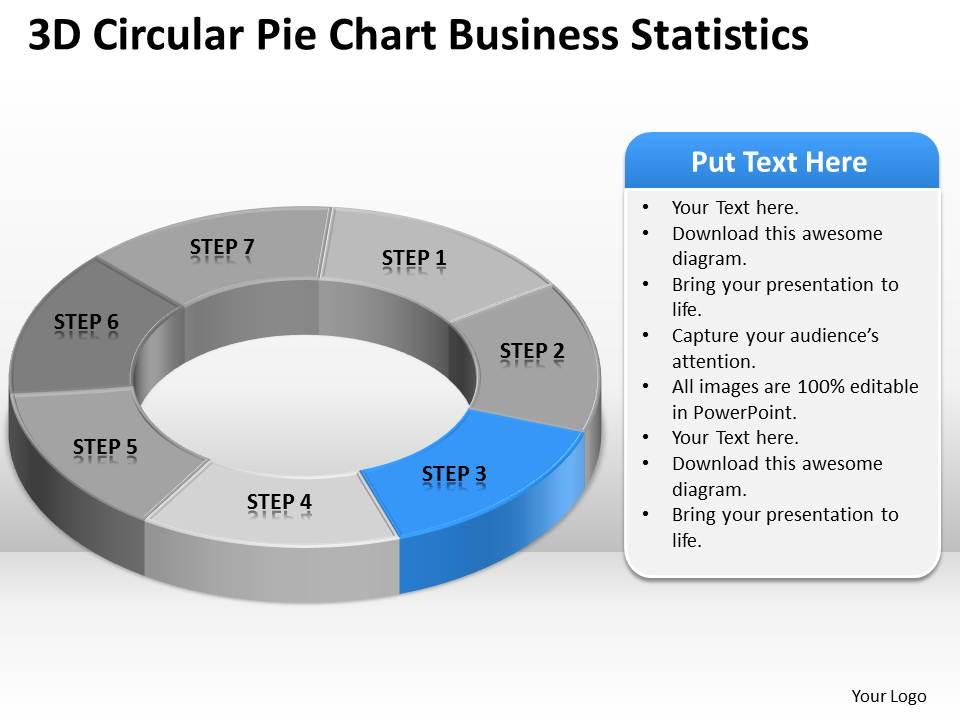
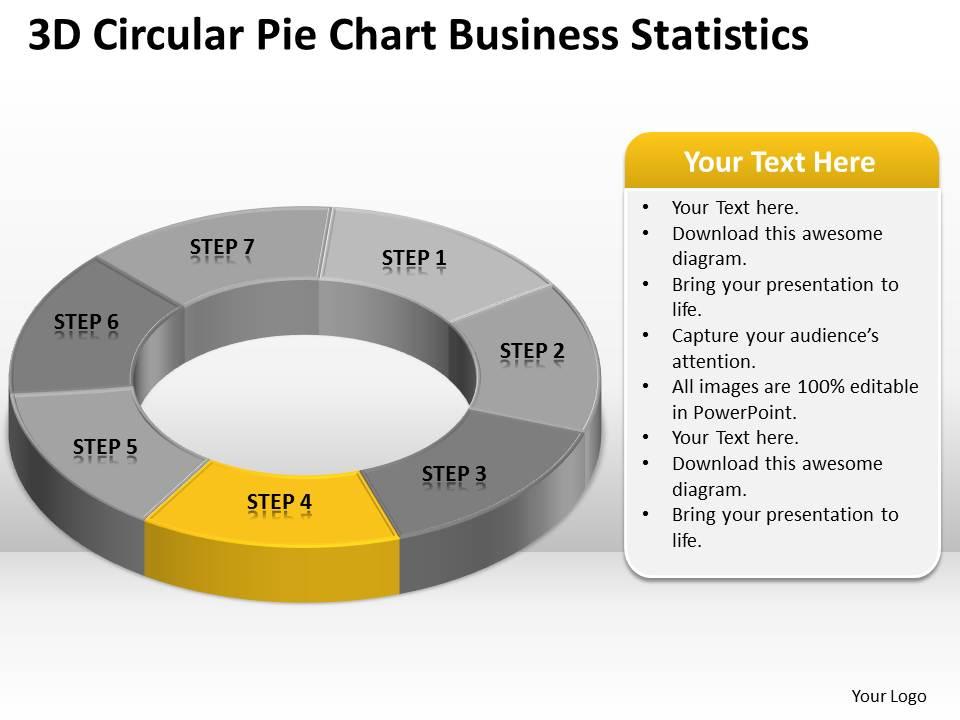
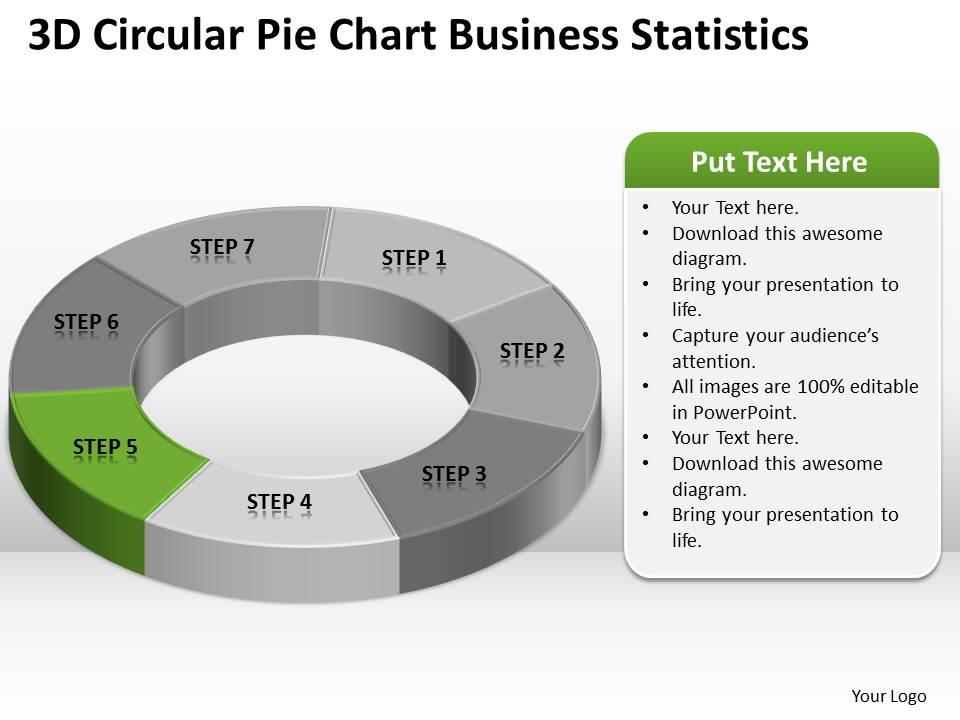
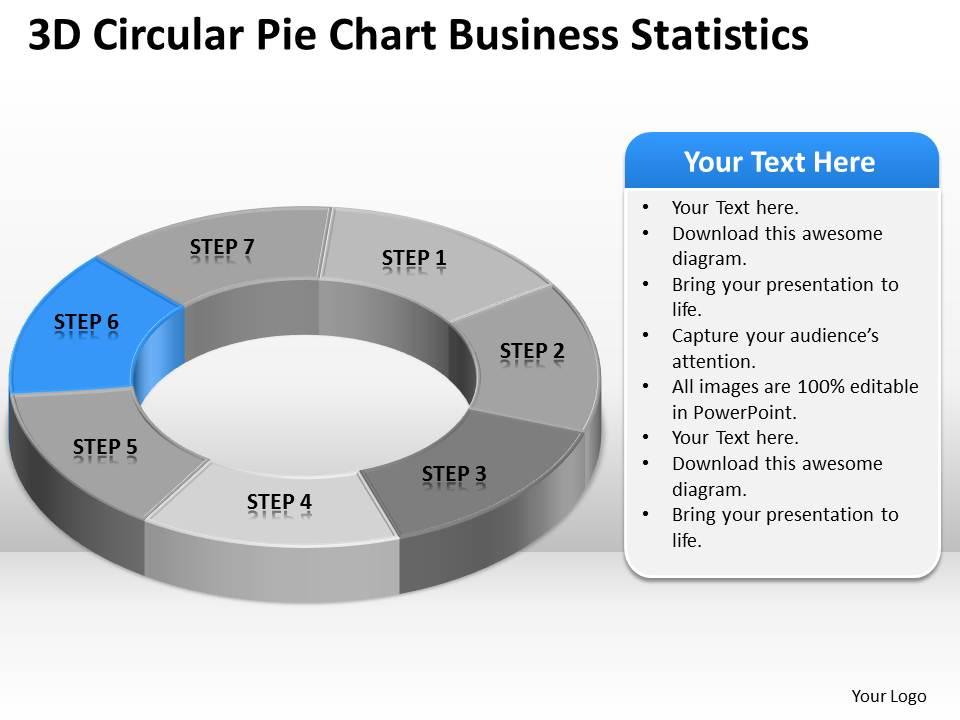
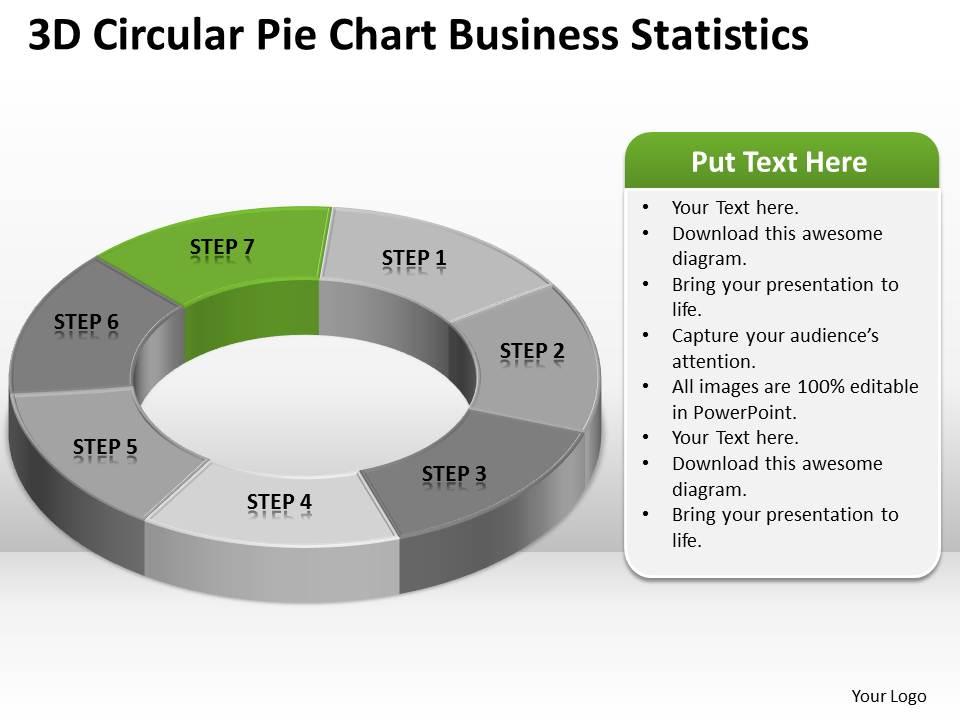
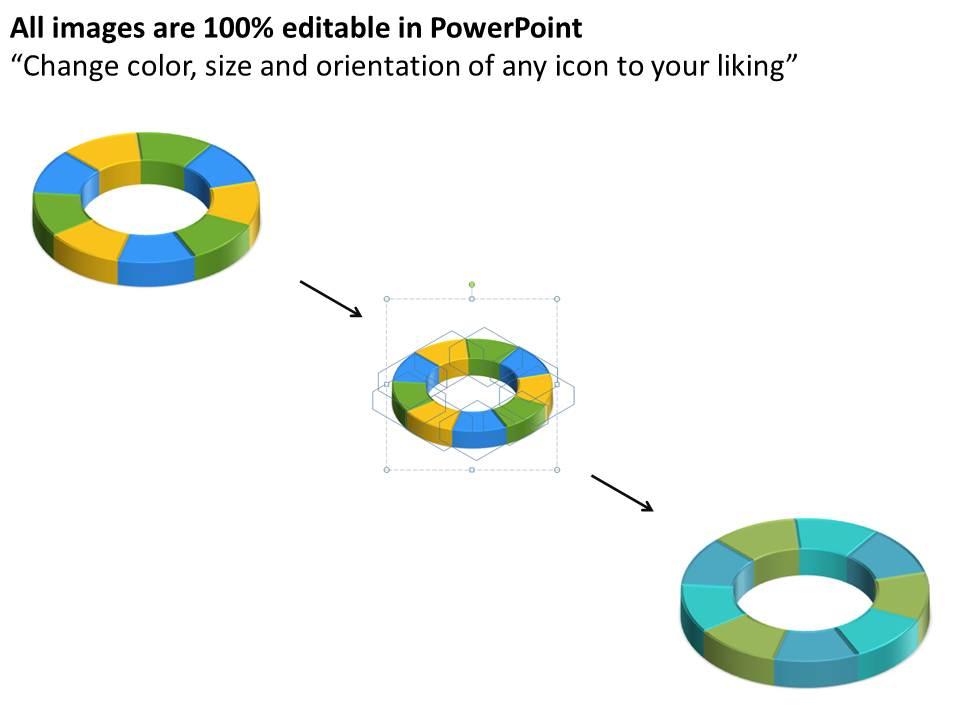
We are proud to present our business workflow diagram 3d circular pie chart statistics powerpoint slides. The above PowerPoint diagram contains an image of 3d pie chart also known as donut diagram. This diagram is a graphical representation of a business process flow, consisting of activities and the connections between these activities.
People who downloaded this PowerPoint presentation also viewed the following :
Business workflow diagram 3d circular pie chart statistics powerpoint slides with all 13 slides:
Convincing people is difficult at times. Smoothen the passage of your thoughts with our Business Workflow Diagram 3d Circular Pie Chart Statistics Powerpoint Slides.
-
Awesomely designed templates, Easy to understand.
-
Illustrative design with editable content. Exceptional value for money. Highly pleased with the product.


