Brand Revenue Comparison Graph With Key Insights
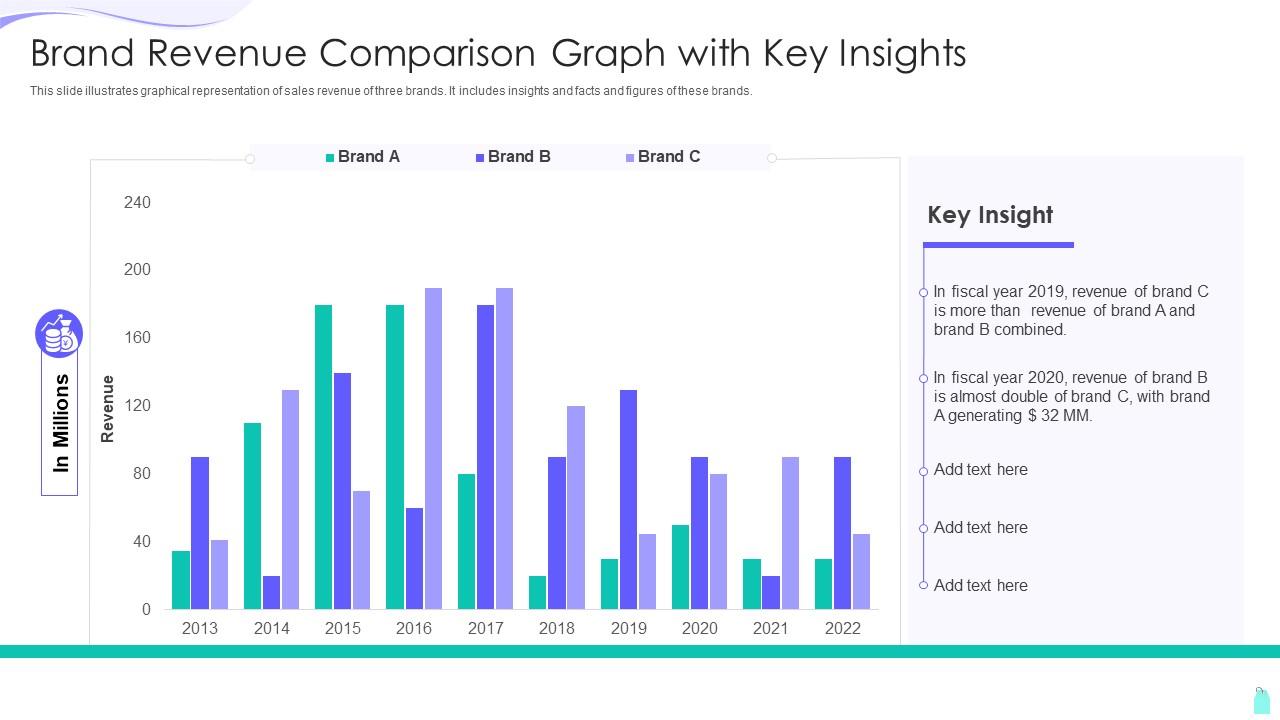
This slide illustrates graphical representation of sales revenue of three brands. It includes insights and facts and figures of these brands.
You must be logged in to download this presentation.
 Impress your
 audience
Editable
of Time
PowerPoint presentation slides
This slide illustrates graphical representation of sales revenue of three brands. It includes insights and facts and figures of these brands. Present the topic in a bit more detail with this Brand Revenue Comparison Graph With Key Insights. Use it as a tool for discussion and navigation on Brand Revenue Comparison Graph With Key Insights. This template is free to edit as deemed fit for your organization. Therefore download it now.
Brand Revenue Comparison Graph With Key Insights with all 7 slides:
Use our Brand Revenue Comparison Graph With Key Insights to effectively help you save your valuable time. They are readymade to fit into any presentation structure.
-
A big thanks to SlideTeam! An incredible and diverse library of templates helped me with my business project presentation.
-
I was never satisfied with my own presentation design but SlideTeam has solved that problem for me. Thank you SlideTeam!


