All Excel Linked Pie Chart Graph Powerpoint Diagram Slide
-
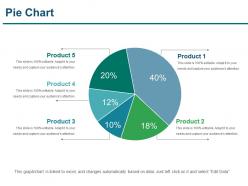 10025110 style division pie 5 piece powerpoint presentation diagram infographic slide
Presenting pie chart powerpoint slide inspiration. This is a pie chart powerpoint slide inspiration . This is a five stage process. The stages in this process are pie chart, finance, marketing, strategy, analysis, business.
-
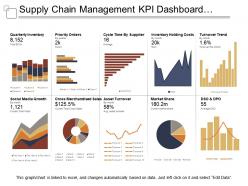 64342029 style essentials 2 financials 10 piece powerpoint presentation diagram infographic slide
Presenting this set of slides with name - Supply Chain Management Kpi Dashboard Showing Quarterly Inventory And Asset Turnover. This is a ten stage process. The stages in this process are Demand Forecasting, Predicting Future Demand, Supply Chain Management.
-
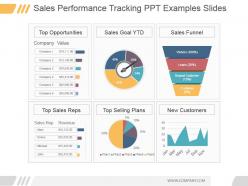 33018115 style essentials 2 financials 4 piece powerpoint presentation diagram infographic slide
Presenting sales performance tracking ppt examples slides. This is a sales performance tracking ppt examples slides. This is a four stage process. The stages in this process are top opportunities, sales goal ytd, sales funnel, company, value, company, visitors, leads, repeat customer, customer, top sales reps, top selling plans, new customers, plan, jan, mar, may, jul, sep, nov, sales rep, mary, emma, michael, john.
-
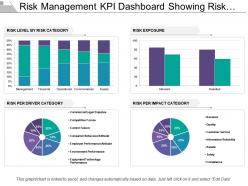 69951282 style essentials 2 financials 4 piece powerpoint presentation diagram infographic slide
Presenting this set of slides with name - Risk Management Kpi Dashboard Showing Risk Level Exposure And Impact Category. This is a four stage process. The stages in this process are Risk Management, Risk Assessment, Project Risk.
-
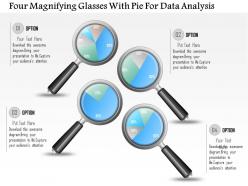 1214 four magnifying glasses with pie for data analysis powerpoint slide
We are proud to present our 1214 four magnifying glasses with pie for data analysis powerpoint slide. Four magnifying glasses are used to craft this power point template slide. This PPT slide also contains the graphic of pie graph. This PPT contains the concept of data driven search. This PPT can be used for business and finance related presentations
-
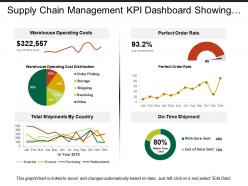 73302194 style essentials 2 financials 3 piece powerpoint presentation diagram infographic slide
Presenting predesigned Supply Chain Management KPI Dashboard Showing Warehouse Operating Costs PPT slide. Download of the template design is simple. You can modify the layout font type, font size, colors and the background as per needs. Template slide is fully flexible with Google Slides and other online software’s. You can alter the design using the instructional slides provided with the template. You can remove the watermark with your brand name, trademark, signature or logo. You can save the template into PNG or JPEG formats. Supreme quality layouts are used to create this template which is editable in PowerPoint. Sample content can be replaced with your presentation content.
-
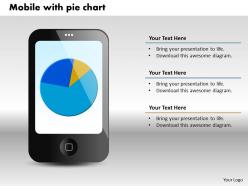 0414 mobile display business pie chart powerpoint graph
They are prodigiously devised PPT template expounding about the significance of Pie chart in business. All the features like verse, themes, figures etc. of these Presentation designs are totally amendable. They are also quite feasible for business experts, management scholars and professionals etc. These Presentation graphics can be easily adaptable with the Google slides and other software’s. They are also easily exportable into PDF or JPG file formats.
-
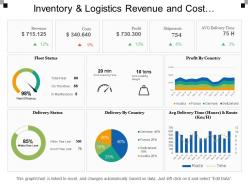 81215616 style division donut 3 piece powerpoint presentation diagram infographic slide
Presenting this set of slides with name - Inventory And Logistics Revenue And Cost Dashboards. This is a three stage process. The stages in this process are Inventory And Logistics, Inventory Management, Warehousing And Inventory Management.
-
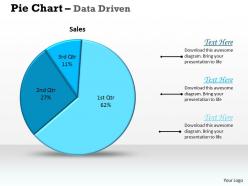 Data driven pie chart for sales process powerpoint slides
We are proud to present our data driven pie chart for sales process powerpoint slides. This PowerPoint diagram can be used to compare sets of business data. You can see entire business processes at a glance using this diagram. You can clarify what works and what doesnt in your teams task and information flow, analyze problems, and identify areas for improvement
-
 38246743 style division donut 3 piece powerpoint presentation diagram infographic slide
Presenting employees who leave within first 6 months powerpoint shapes. This is a employees who leave within first 6 months powerpoint shapes. This is a three stage process. The stages in this process are employees left job within the first 6 months, felt their boss was a jerk, work was different than they expected, changed their mind on work type.
-
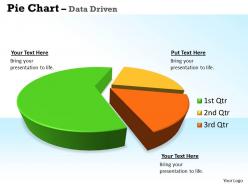 Data driven 3d pie chart for business statistics powerpoint slides
We are proud to present our data driven 3d pie chart for business statistics powerpoint slides. Put The Wind In Your Sails With Our Data Driven 3D Pie Chart For Business Statistics Powerpoint Slides Power Point Templates. Skim Smoothly Over The Choppy Waters Of The Market. Let Our Data Driven 3D Pie Chart For Business Statistics Powerpoint Slides Power Point Templates Give The Updraft To Your Ideas. See Them Soar To Great Heights With Ease.
-
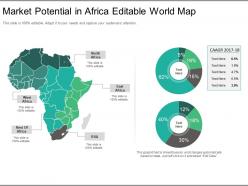 28105733 style division pie 3 piece powerpoint presentation diagram infographic slide
Presenting market potential in africa editable world map ppt model. This is a market potential in africa editable world map ppt model. This is a three stage process. The stages in this process are north africa, east africa, rsa, rest of africa, west africa.
-
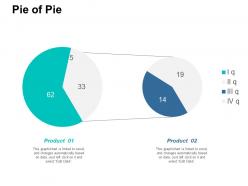 76308499 style division pie 2 piece powerpoint presentation diagram infographic slide
Presenting this set of slides with name - Pie Of Pie Ppt Summary Background Designs. This is a two stage process. The stages in this process are Percentage, Product, Business, Management, Marketing.
-
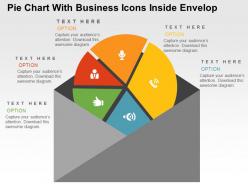 Pie chart with business icons inside envelop powerpoint slides
Pie chart with business icons inside envelop PPT Slide. Easy to use and edit. Colors, icons and layout can be easily changed as the PPT slide is completely editable. Simply click to add company logo, trademark or name. This PPT Slide is available in both Standard and Widescreen slide size. Quick and easy downloadable process. Flexible option for conversion in PDF or JPG formats. Can use with Google slides.
-
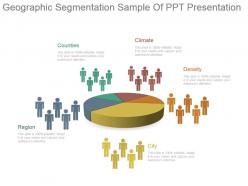 46051019 style division pie 5 piece powerpoint presentation diagram infographic slide
Presenting geographic segmentation sample of ppt presentation. This is a geographic segmentation sample of ppt presentation. This is a five stage process. The stages in this process are counties, climate, density, city, region.
-
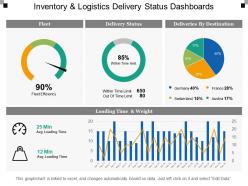 66914169 style essentials 2 dashboard 4 piece powerpoint presentation diagram infographic slide
Presenting this set of slides with name - Inventory And Logistics Delivery Status Dashboards. This is a four stage process. The stages in this process are Inventory And Logistics, Inventory Management, Warehousing And Inventory Management.
-
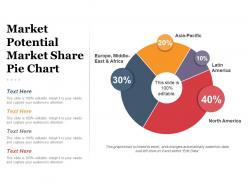 52411359 style division pie 4 piece powerpoint presentation diagram infographic slide
Presenting market potential market share pie chart presentation deck. This is a market potential market share pie chart presentation deck. This is a four stage process. The stages in this process are business, marketing, finance, strategy, success, pie chart.
-
 15375048 style division pie 4 piece powerpoint presentation diagram infographic slide
Presenting pie chart powerpoint slide ideas. This is a pie chart powerpoint slide ideas. This is a four stage process. The stages in this process are pie chart, finance, marketing, strategy, finance, business.
-
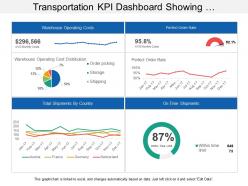 42640045 style division pie 2 piece powerpoint presentation diagram infographic slide
Presenting transportation KPI dashboard showing warehouse operating costs perfect order rate PPT slide. This layout is fully compatible with Google slides and data driven. User can edit the data in linked excel sheet and graphs and charts gets customized accordingly. Easy to put in company logo, trademark or name; accommodate words to support the key points. Images do no distort out even when they are projected on large screen. Adjust colors, text and fonts as per your business requirements.
-
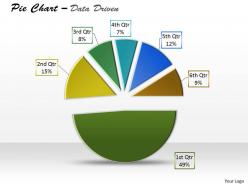 Data driven express business facts in pie chart powerpoint slides
We are proud to present our data driven express business facts in pie chart powerpoint slides. Our Data Driven Express Business Facts In Pie Chart Powerpoint slides Power Point Templates Are Building A Great Reputation. Of Being The Driving Force Of A Good Presentation. Use Our Data Driven Express Business Facts In Pie Chart Powerpoint slides Power Point Templates And Surely Win The Game. As A Presenter Gain Great Name And Fame.
-
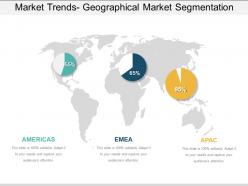 99011964 style essentials 1 location 3 piece powerpoint presentation diagram infographic slide
Presenting market trends geographical market segmentation ppt example. This is a market trends geographical market segmentation ppt example. This is a three stage process. The stages in this process are americas, emea, apac.
-
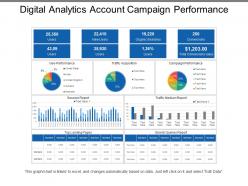 19631265 style essentials 2 financials 3 piece powerpoint presentation diagram infographic slide
Presenting this set of slides with name - Digital Analytics Account Campaign Performance. This is a five stage process. The stages in this process are Digital Analytics, Digital Dashboard, Digital Kpis.
-
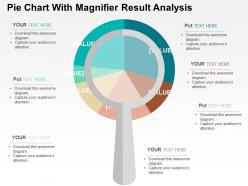 Pie chart with magnifier result analysis powerpoint slides
Readymade template pie chart with magnifier result analysis. Can be used for business people, sales executives and communication departments. Colors, charts and shapes can be easily changed as the PPT slide is completely editable. Simply click to add company logo, trademark or name. This PPT Slide is available in both Standard and Widescreen slide size. Easy and quick downloading process.
-
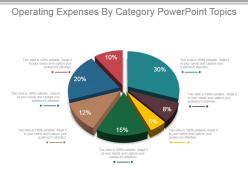 54291725 style division pie 7 piece powerpoint presentation diagram infographic slide
Presenting operating expenses by category powerpoint topics. This is a operating expenses by category powerpoint topics. This is a seven stage process. The stages in this process are business, management, marketing, finance, pie.
-
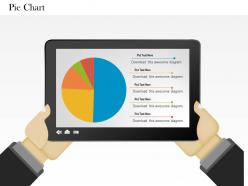 0514 data driven pie chart graphic powerpoint slides
We are proud to present our 0514 data driven pie chart graphic powerpoint slides. This Business Power Point template is designed with data driven pie chart to highlight the result in any business presentation. Create a good impact on your viewers with our unique template collection.
-
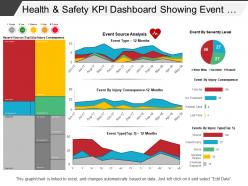 25077998 style essentials 2 financials 4 piece powerpoint presentation diagram infographic slide
Presenting the colorful dashboard presentation layout. This modern dashboard design is fully editable and is created under the strict supervision of professionals. You can bring changes to the objects in the slide like font size and font color hassle-free. This presentation slide is fully compatible with Google Slide and can be saved in JPG or PDF file format without any hassle. Fast download this at the click of the button.
-
 17683719 style division pie 3 piece powerpoint presentation diagram infographic slide
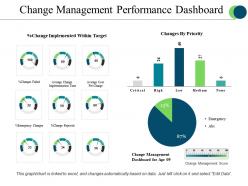
Presenting change management performance dashboard powerpoint slide designs. This is a change management performance dashboard powerpoint slide designs. This is a three stage process. The stages in this process are critical, high, low, medium, none.
-
 1214 four pie chart for data driven result analysis of business powerpoint slide
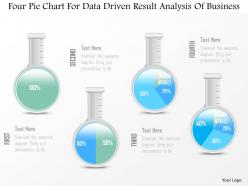
We are proud to present our 1214 four pie chart for data driven result analysis of business powerpoint slide. This Power Point template has been crafted with graphic of four pie charts. This PPT slide contains the concept of data driven result analysis. Use this PPT slide for your business and marketing related presentations.
-
 Handshake with business deal data driven pie chart powerpoint slides
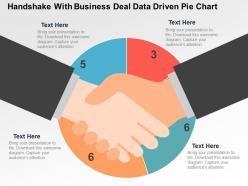
We are proud to present our handshake with business deal data driven pie chart powerpoint slides. Graphic of handshake and pie chart has been used to design this power point template diagram. This PPT diagram contains the concept of data driven business deal and analysis. Use this PPT diagram for business and finance related presentations.
-
 0514 5 staged data driven pie chart powerpoint slides
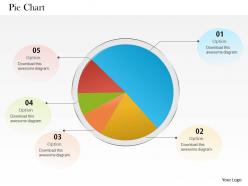
Proofing and editing can be done with ease in PPT design. Presentation slide is of utmost use to management professionals, big or small organizations and business startups. Smooth functioning is ensured by the presentation slide show on all software’s. When projected on the wide screen the PPT layout does not sacrifice on pixels or color resolution. Best feature being the conversion of presentation slide show to PDF or JPG format.
-
 73176488 style essentials 2 financials 3 piece powerpoint presentation diagram infographic slide
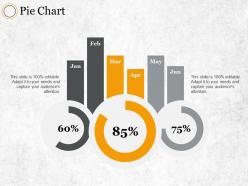
Presenting this set of slides with name - Pie Chart Ppt Professional Graphics Download. This is a three stage process. The stages in this process are Product, Percentage, Business, Marketing, Management.
-
 26278524 style division pie 4 piece powerpoint presentation diagram infographic slide
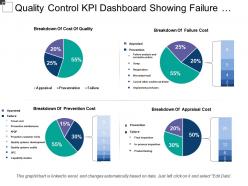
Presenting this set of slides with name - Quality Control Kpi Dashboard Showing Failure And Prevention Cost. This is a four stage process. The stages in this process are Quality Management, Quality Control, Quality Assurance.
-
 Donut style pie chart for data driven analysis powerpoint slides
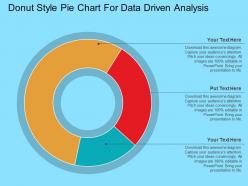
Organized slide pie diagram is totally variable. Downloading design in any configuration choices like JPEG, JPG or PDF is straightforward and lively. Provide a star point of view to your organization slides. Highly clear with Google slides. Symbols are in like way being joined. Editing of substance, portrayal, diagrams, and substance as showed up by your hurting and need. Visuals don't dark when exposed on widescreen.
-
 97757242 style essentials 2 financials 4 piece powerpoint presentation diagram infographic slide
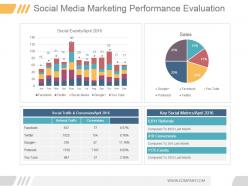
Presenting social media marketing performance evaluation ppt diagrams. This is a social media marketing performance evaluation ppt diagrams. This is a four stage process. The stages in this process are social event april, facebook, twitter, social media, google, you tube, jan, feb, mar, apr, may, jun, jul, aug, sep, oct, nov, dec, social traffic and conversion april 2016, referral traffic, conversions, pinterest, sales, key social metrics april 2016, referral traffic, conversions, pinterest, sales, key social metrics april, referrals, compared to 4655 last month, conversions, compared to 354 last month, events, compared to 1052 last month.
-
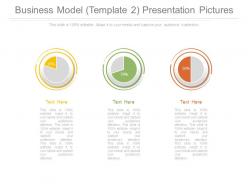 5255089 style division pie 3 piece powerpoint presentation diagram template slide
Presenting business model template 2 presentation pictures. This is a business model template 2 presentation pictures. This is a three stage process. The stages in this process are business, percentage, marketing, success, strategy.
-
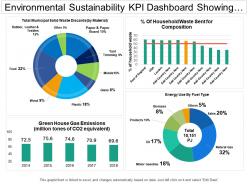 42217199 style division pie 4 piece powerpoint presentation diagram infographic slide
Presenting this set of slides with name - Environmental Sustainability Kpi Dashboard Showing Municipal Solid Waste Discard. This is a four stage process. The stages in this process are Environment Sustainability, Environment Continual, Environment Feasibility.
-
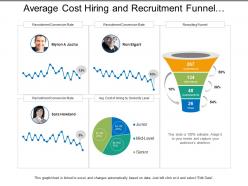 29546045 style layered funnel 3 piece powerpoint presentation diagram infographic slide
Presenting this set of slides with name - Average Cost Hiring And Recruitment Funnel Dashboard. This is a three stage process. The stages in this process are Staffing Plan, Recruitment, Staff Management.
-
 68896409 style division pie 4 piece powerpoint presentation diagram infographic slide
Presenting Pie Chart PowerPoint Slides. This PPT theme is available in both 4:3 and 16:9 aspect ratios. This PowerPoint template is customizable so you can modify the font size, font type, color and shapes as per your requirements. This PPT presentation is Google Slides compatible hence it is easily accessible. You can download and save this PowerPoint layout in different formats like PDF, PNG, and JPG.
-
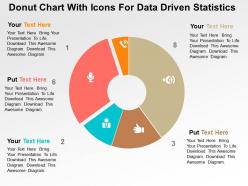 Donut chart with icons for data driven statistics powerpoint slides
Businessmen, micro, small and medium enterprises can use the PPT visual as a master slide. PowerPoint presentation supports filling background in a different color from the text. All images are 100% editable in the presentation slide. Text can be differentiated form the background by the handy features provided by PPT layout. There is no space constrain in the PowerPoint design, thus enabling easy addition or edition of data.
-
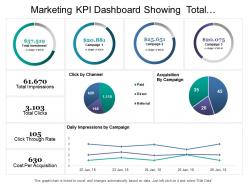 52553811 style division donut 4 piece powerpoint presentation diagram infographic slide
Presenting marketing KPI dashboard showing total investment impressions click cost per acquisition PPT slide. This layout is fully compatible with Google slides and data driven. User can edit the data in linked excel sheet and graphs and charts gets customized accordingly. Easy to put in company logo, trademark or name; accommodate words to support the key points. Images do no distort out even when they are projected on large screen. Adjust colors, text and fonts as per your business requirements
-
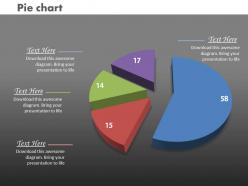 0414 pie chart with data division powerpoint graph
We are proud to present our 0414 pie chart with data division powerpoint graph. Our Pie Chart With Data Division Powerpoint Graph Power Point Templates Offer You The Needful To Organize Your Thoughts. Use Them To List Out Your Views In A Logical Sequence. Our Pie Chart With Data Division Powerpoint Graph Power Point Templates Are Created By A Hardworking Bunch Of Busy Bees. Always Flitting Around With Solutions Guaranteed To Please.
-
 1977365 style essentials 2 financials 8 piece powerpoint presentation diagram infographic slide
Presenting this set of slides with name - Government And Public Works Kpi Dashboard Showing Criminal Records. This is a eight stage process. The stages in this process are Government And Public Works, Government And Public Tasks.
-
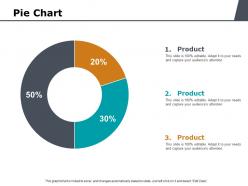 3867447 style essentials 2 financials 3 piece powerpoint presentation diagram infographic slide
Presenting this set of slides with name - Pie Chart Investment Ppt Powerpoint Presentation Templates. This is a three stages process. The stages in this process are Pie Chart, Finance, Marketing, Business, Analysis.
-
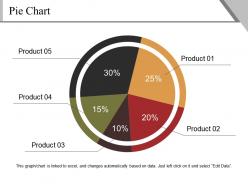 44495939 style division pie 5 piece powerpoint presentation diagram infographic slide
Presenting pie chart ppt background template. This is a pie chart ppt background template. This is a five stage process. The stages in this process are pie, finance, business, marketing, strategy.
-
 73105254 style division pie 4 piece powerpoint presentation diagram infographic slide
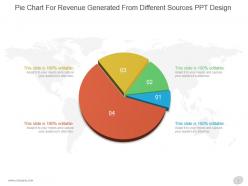
Presenting pie chart for revenue generated from different sources ppt design. This is a pie chart for revenue generated from different sources ppt design. This is a four stage process. The stages in this process are business, marketing, pie, circle, piece.
-
 60877488 style division pie 4 piece powerpoint presentation diagram infographic slide
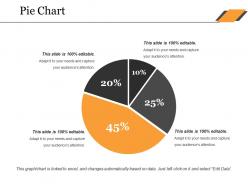
Presenting Pie Chart PPT Microsoft that has been designed according to your needs and convenience. This template can be saved into various formats like PDF, JPG, and PNG. These PPT slides are completely customizable and editable. You can change the colors, fonts, font size, and font types of the presentation as per your needs. It is also compatible with Google Slides making it an even more suitable option for you. This template also supports the standard (4:3) and widescreen (16:9) sizes.
-
 Data driven pie chart for easy comparison powerpoint slides
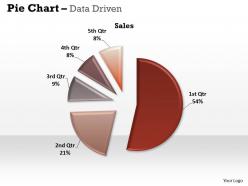
We are proud to present our data driven pie chart for easy comparison powerpoint slides. This Pie charts is useful to compare different parts of a whole amount. It is often used to present financial information.Use this slide to transmit this clarity of purpose onto the eager minds of your team.
-
 62096557 style division pie 4 piece powerpoint presentation diagram infographic slide
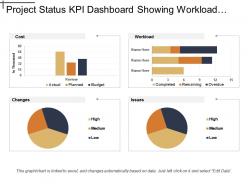
Presenting this set of slides with name - Project Status Kpi Dashboard Showing Workload Cost And Issues. This is a four stage process. The stages in this process are Project Health Card, Project Performance, Project Status.
-
 36940311 style essentials 2 financials 4 piece powerpoint presentation diagram infographic slide
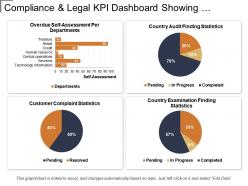
Presenting this set of slides with name - Compliance And Legal Kpi Dashboard Showing Self-Assessment Per Department. This is a four stage process. The stages in this process are Compliance And Legal, Legal Governance, Risk Management.
-
 0514 sales data driven pie chart powerpoint slides
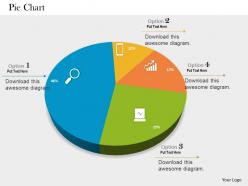
Absolutely editable color scheme and contrast of PPT graphics. Add your company name, logo, brand-name etc. to personalize. Presentation slide accessible in Standard 4:3 and Widescreen 16:9 view. Handy to be saved in JPG or PDF format. Beneficial for sales executives, marketers, business professionals, financial analysts, strategists, students, teachers, etc. Self-explanatory and intellectual slide design.
-
 1968135 style division pie 3 piece powerpoint presentation diagram template slide
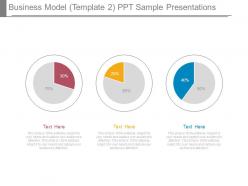
Presenting business model template 2 ppt sample presentations. This is a business model template 2 ppt sample presentations. This is a three stage process. The stages in this process are business, percentage, marketing, strategy, process.
-
 43707776 style division pie 4 piece powerpoint presentation diagram template slide
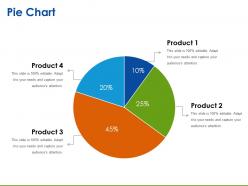
Presenting pie chart ppt sample download. This is a pie chart ppt sample download. This is a four stage process. The stages in this process are pie chart, finance, analysis, marketing, strategy, business.
-
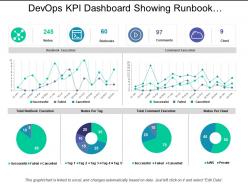 Devops kpi dashboard showing runbook execution and command execution
Presenting this set of slides with name - Devops Kpi Dashboard Showing Runbook Execution And Command Execution. This is a six stage process. The stages in this process are Development And Operations, Devops.
-
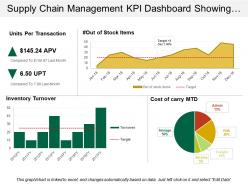 75231696 style essentials 2 financials 3 piece powerpoint presentation diagram infographic slide
Presenting predesigned Supply Chain Management KPI Dashboard Showing Warehouse Operating Costs PPT slide. Download of the template design is simple. You can modify the layout font type, font size, colors and the background as per needs. Template slide is fully flexible with Google Slides and other online software’s. You can alter the design using the instructional slides provided with the template. You can remove the watermark with your brand name, trademark, signature or logo. You can save the template into PNG or JPEG formats. Supreme quality layouts are used to create this template which is editable in PowerPoint. Sample content can be replaced with your presentation content.
-
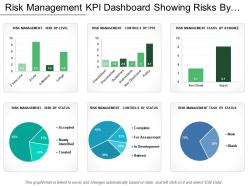 99290375 style essentials 2 financials 6 piece powerpoint presentation diagram infographic slide
Presenting this set of slides with name - Risk Management Kpi Dashboard Showing Risks By Level Assignee And Status. This is a six stage process. The stages in this process are Risk Management, Risk Assessment, Project Risk.
-
 27059106 style division pie 3 piece powerpoint presentation diagram infographic slide
Presenting transportation KPI dashboard snapshot showing fleet delivery status loading time and weight PPT slide. Simple data input with linked Excel chart, just right click to input values. This PowerPoint theme is fully supported by Google slides. Picture quality of these slides does not change even when project on large screen. Fast downloading speed and formats can be easily changed to JPEG and PDF applications. This template is suitable for marketing, sales persons, business managers and entrepreneurs.
-
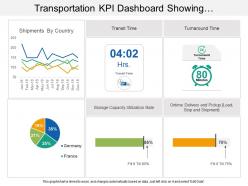 4939293 style division pie 3 piece powerpoint presentation diagram infographic slide
Presenting transportation KPI Dashboard showing shipments by country and transit time PPT slide. This deck offers you plenty of space to put in titles and subtitles. This template is Excel linked just right click to input your information. High resolution based layout, does not change the image even after resizing. This presentation icon is fully compatible with Google slides. Quick downloading speed and simple editing options in color text and fonts.PPT icons can easily be changed into JPEG and PDF applications
-
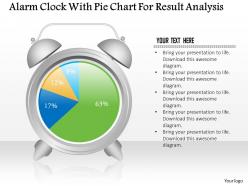 1214 alarm clock with pie chart for result analysis powerpoint slide
We are proud to present our 1214 alarm clock with pie chart for result analysis powerpoint slide. This power point template slide has been crafted with graphic of pie chart and alarm clock. These charts can be used for data driven result analysis. Use this PPT for your business result analysis related presentations.
-
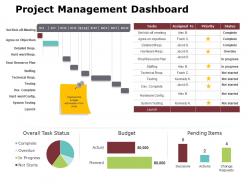 79618981 style essentials 2 financials 2 piece powerpoint presentation diagram infographic slide
Presenting this set of slides with name - Project Management Dashboard Ppt Powerpoint Presentation Gallery Display. This is a two stage process. The stages in this process are Business, Management, Strategy, Analysis, Marketing.
-
 0414 gears pie chart marketing layout powerpoint graph
We are proud to present our 0414 gears pie chart marketing layout powerpoint graph. Our Gears Pie Chart Marketing Layout Powerpoint Graph Powerpoint Templates are created with admirable insight. Use them and give your group a sense of your logical mind. Use our Gears Pie Chart Marketing Layout Powerpoint Graph Powerpoint Templates to bullet point your ideas. See them fall into place one by one.


