All Excel Linked Pie Chart Graph Powerpoint Diagram Slide
-
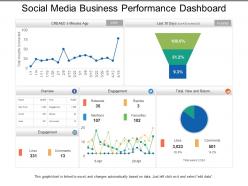 62654694 style layered funnel 5 piece powerpoint presentation diagram infographic slide
Presenting, agile development showing product owner with iteration plan and planning meeting PPT template. This PPT slide can be used for agile development and sprint planning related presentations by experts, students or strategists. All the icons practiced here are 100% editable in PowerPoint software. You can change the color, size, and format of any icon to your liking. Insert your business logo in the PPT slide, which is also compatible with google slides.
-
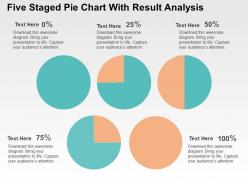 Five staged pie chart with result analysis powerpoint slides
Modifiable PPT Slide with pie diagrams with rate and symbols. Perfect with various arrangement alternatives like JPEG, JPG or PDF. Gives an expert standpoint to your PowerPoint introduction. Symbols are likewise being included. Customization of each PowerPoint realistic and content as indicated by your craving and need. Accessible in Widescreen slide estimate too. Opportunity to alter it with organization name and logo.
-
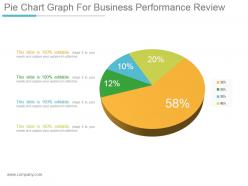 27909401 style division pie 4 piece powerpoint presentation diagram infographic slide
Presenting pie chart graph for business performance review ppt design templates. This is a pie chart graph for business performance review ppt design templates. This is a four stage process. The stages in this process are pie, percentage, business, finance, marketing.
-
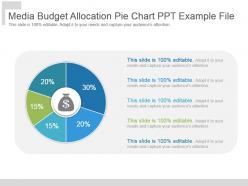 57309626 style division pie 5 piece powerpoint presentation diagram infographic slide
Presenting media budget allocation pie chart ppt example file. This is a media budget allocation pie chart ppt example file. This is a five stage process. The stages in this process are business, marketing, strategy, management, success.
-
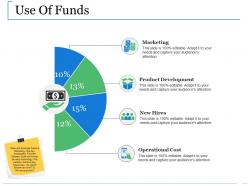 24663275 style division pie 4 piece powerpoint presentation diagram infographic slide
Presenting this set of slides with name - Use Of Funds Ppt Slides Gallery. This is a four stage process. The stages in this process are Business, Operational Cost, New Hires, Product Development, Marketing.
-
 12113157 style essentials 2 financials 7 piece powerpoint presentation diagram infographic slide
Presenting this set of slides with name - Healthcare Dashboard With Admission By Division And Overall Patient Satisfaction. This is a seven stage process. The stages in this process are Healthcare, Health Improvement, Medical Care.
-
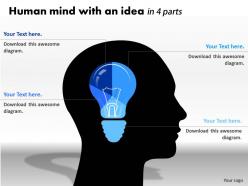 0414 human mind with an idea pie chart powerpoint graph
Extremely powerful PPT presentation tools, helps in the generation of innovative ideas. Portrays a completely professional image of your enterprise. Adds a hint of glace to the entire presentation. Makes the information easily understandable and adaptable. Fits into any presentation easily and effortlessly. Allows insertion of titles and subtitles. Provides instant downloading to save your valuable time.
-
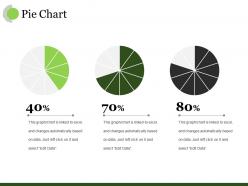 27420241 style division pie 3 piece powerpoint presentation diagram infographic slide
Presenting this set of slides with name - Pie Chart Ppt Sample. This is a three stage process. The stages in this process are Business, Marketing, Finance, Planning, Strategy.
-
 46248997 style essentials 2 financials 3 piece powerpoint presentation diagram infographic slide
• Bright colors and clarity in graphics • Thoroughly editable slides • Ease of editing the slides with the help of instructions provided. • Easy to download • Comfortably customizable • Of much help to financial analysts, insurance company employees, students and teachers. • High resolution of slide visuals do not let the image pixelate when projected on wide screen • Compatible with latest software options and multiple format types.
-
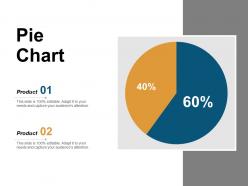 61082114 style essentials 2 financials 2 piece powerpoint presentation diagram infographic slide
Presenting this set of slides with name - Pie Chart Ppt Powerpoint Presentation Model Information. This is a two stage process. The stages in this process are Analysis, Financials, Business, Management, Strategy.
-
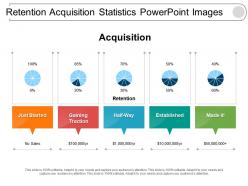 85299505 style essentials 2 financials 5 piece powerpoint presentation diagram template slide
Introducing retention acquisition statistics PowerPoint design. This PowerPoint design is adaptable with all software’s operations and all Google Slides. This Presentation slide can also be simply exportable into PDF or JPG file schemes. This PPT image can be displayed in a larger screen ratio with an unaffected high resolution. All the aspects or features of this Presentation graphic like matter, pattern, context, intensity etc. can be manually manageable.
-
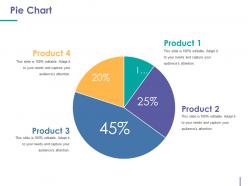 35586083 style division pie 4 piece powerpoint presentation diagram infographic slide
Presenting Pie Chart PowerPoint Templates Download. This PPT theme is available in both 4:3 and 16:9 aspect ratios. This PowerPoint template is customizable so you can modify the font size, font type, color and shapes as per your requirements. This PPT presentation is Google Slides compatible hence it is easily accessible. You can download and save this PowerPoint layout in different formats like PDF, PNG, and JPG.
-
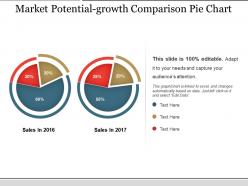 71083504 style division pie 2 piece powerpoint presentation diagram infographic slide
Presenting Market Potential Growth Comparison pie chart PPT infographics slide. This presentation diagram is 100% editable in PowerPoint and has been designed by professionals using high-quality graphics. You can customize the font type, font size, colors of the diagram, and background color as per your requirement. Incorporating your company name and logo in this slide is very easy. You can replace the dummy content in text placeholders with your presentation content without any hassle. This slide is fully compatible with Google Slides and can be saved in JPG or PDF format. High quality graphics and icons ensure that there is no deteriorating in quality on enlarging their size.
-
 57431074 style essentials 2 financials 3 piece powerpoint presentation diagram infographic slide
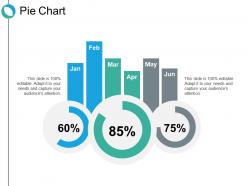
Presenting this set of slides with name - Pie Chart Ppt Show Example Introduction. This is a three stage process. The stages in this process are Percentage, Product, Management, Marketing.
-
 46905914 style essentials 2 financials 3 piece powerpoint presentation diagram infographic slide
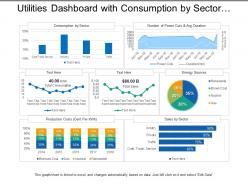
Presenting this set of slides with name - Utilities Dashboard With Consumption By Sector And Energy Sources. This is a three stage process. The stages in this process are Utilities, Use, Advantage.
-
 21764057 style division pie 5 piece powerpoint presentation diagram infographic slide
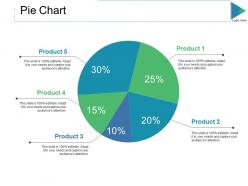
Presenting this set of slides with name - Pie Chart Ppt Slides Outfit. This is a five stage process. The stages in this process are Business, Marketing, Strategy, Percentage, Process.
-
 67485599 style division pie 3 piece powerpoint presentation diagram infographic slide
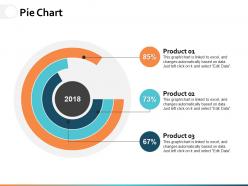
Presenting this set of slides with name - Pie Chart Ppt Powerpoint Presentation Gallery Infographic Template. This is a three stage process. The stages in this process are Percentage, Product, Business, Management, Marketing.
-
 40053781 style technology 1 servers 1 piece powerpoint presentation diagram infographic slide
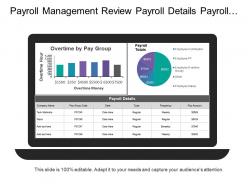
Presenting this set of slides with name - Payroll Management Review Payroll Details Payroll Totals. This is a one stage process. The stages in this process are Payroll Management, Human Resource Management, Employment Compensation.
-
 30672143 style division pie 7 piece powerpoint presentation diagram template slide
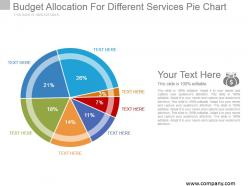
Presenting budget allocation for different services pie chart example of ppt. This is a budget allocation for different services pie chart example of ppt. This is a seven stage process. The stages in this process are pie chart, finance, marketing, strategy, business, success, percentage.
-
 92565116 style division pie 6 piece powerpoint presentation diagram template slide
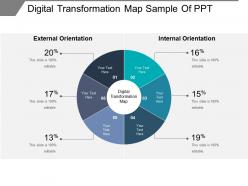
Presenting digital transformation map PPT slide design. This is contemporarily styled PowerPoint visual of tremendous quality and graphics. Easily exportable to PDF or JPG file compositions. Abundant space option to insert company emblem or trademark with the Presentation diagram. 100% rebuild able visuals, symbols, texts, pictures etc. Easily projected on large screen with immense quality Presentation graphic. Option to insert title and subtitle. Versant with all Google Slides. Quite beneficial for the management professionals.
-
 0514 different symbol data driven pie chart powerpoint slides
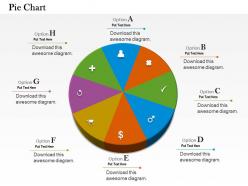
We are proud to present our 0514 different symbol data driven pie chart powerpoint slides. This Business Power Point template slide is designed with different symbols graphic of data driven pie chart. This template is crafted for financial growth display.
-
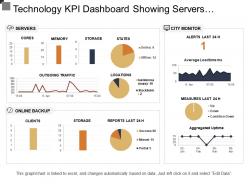 37536882 style essentials 2 financials 3 piece powerpoint presentation diagram infographic slide
Sharing technology KPI dashboard server’s online backup presentation template.PPT design is adjustable with Google slides. Quick to download and can be shared into JPG and PDF format. Fully amendable as color, text and font as elements can be modified. Sharing can be possible on both standard and widescreen. Matching designs are available with different nodes and stages. Ready to use PowerPoint slide are compatible with Google slides and can be merged easily.
-
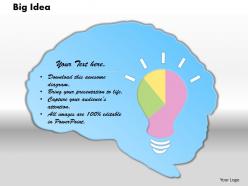 0414 business idea bulb pie chart powerpoint graph
We are proud to present our 0414 business idea bulb pie chart powerpoint graph. Our 0414 Business Idea Bulb Pie Chart Powerpoint Graph Powerpoint Templates will provide weight to your words. They will bring out the depth of your thought process. Words like arrows fly straight and true. Use our 0414 Business Idea Bulb Pie Chart Powerpoint Graph Powerpoint Templates to make them hit bullseye everytime.
-
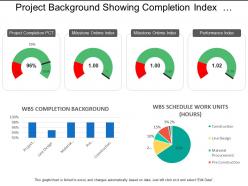 52639228 style essentials 2 dashboard 4 piece powerpoint presentation diagram template slide
Presenting this set of slides with name - Project Background Showing Completion Index And Pie Chart. This is a four stage process. The stages in this process are Project Background, Project Management, Project Description.
-
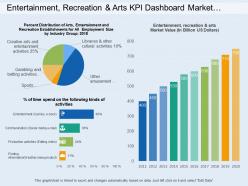 86274960 style essentials 2 financials 3 piece powerpoint presentation diagram infographic slide
Presenting this set of slides with name - Entertainment Recreation And Arts Kpi Dashboard Market Value And Percentage Of Time Spend. This is a three stage process. The stages in this process are Entertainment, Recreation And Arts, Attractions, Culture, Entertainment.
-
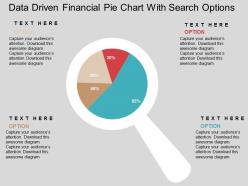 Data driven financial pie chart with search options powerpoint slides
We are proud to present our data driven financial pie chart with search options powerpoint slides. This power point template diagram has been designed with graphic of financial pie chart. This pie chart is data driven and can be used for financial data study with search options. Use this PPT diagram can be used for marketing and business related presentations.
-
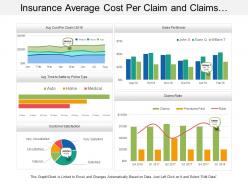 90914237 style essentials 2 financials 5 piece powerpoint presentation diagram template slide
Presenting this set of slides with name - Insurance Average Cost Per Claim And Claims Ratio Dashboard. This is a five stage process. The stages in this process are Assurance, Surety, Insurance.
-
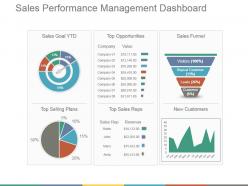 45433492 style essentials 2 dashboard 4 piece powerpoint presentation diagram infographic slide
Presenting sales performance management dashboard ppt background images. This is a sales performance management dashboard snapshot ppt background images. This is a four stage process. The stages in this process are sales goal ytd, top opportunities, sales funnel, top selling plans, top sales reps, new customers.
-
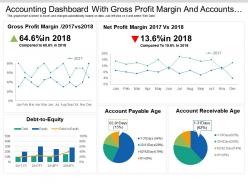 75805140 style essentials 2 financials 5 piece powerpoint presentation diagram infographic slide
Offering accounting dashboard with gross profit margin and account payable PPT slideshow. Makes the information clear in the mind of the audience. Editable visuals, colors and charts. Easy to edit and customize as per your needs. Beneficial for industry professionals, technologists, managers, executives, researchers, sales people, etc. Flexible presentation designs can be presented in standard and widescreen view. Has a futuristic and realistic approach. Easy to download and save. Highly beneficial PowerPoint Slide for highlighting financial data.
-
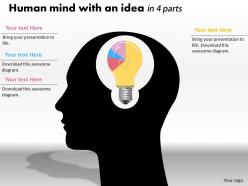 0414 idea of brain pie chart illustration powerpoint graph
We are proud to present our 0414 idea of brain pie chart illustration powerpoint graph. Lay the foundation of your presentation with our Idea Of Brain Pie Chart Illustration Powerpoint Graph Powerpoint Templates. Build upon it layer by layer and give it the form of your choice. Our Idea Of Brain Pie Chart Illustration Powerpoint Graph Powerpoint Templates are the heartstrings of your brilliant song. Strum them and produce a tune certain to touch the souls of your audience.
-
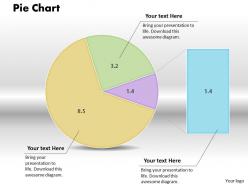 0414 pie chart businesss growth design powerpoint graph
We are proud to present our 0414 pie chart businesss growth design powerpoint graph. Our Pie Chart Businesss Growth Design Powerpoint Graph Power Point Templates Come In All Colors Shades And Hues. They Help Highlight Every Nuance Of Your Views. Our Pie Chart Businesss Growth Design Powerpoint Graph Power Point Templates Will Fulfill Your Every Need. Use Them And Effectively Satisfy The Desires Of Your Audience.
-
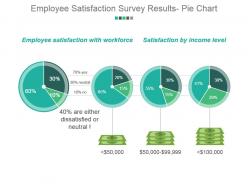 38196922 style division pie 4 piece powerpoint presentation diagram infographic slide
Presenting employee satisfaction survey results pie chart powerpoint presentation examples. This is a employee satisfaction survey results pie chart powerpoint presentation examples. This is a four stage process. The stages in this process are employee satisfaction with workforce, satisfaction by income level.
-
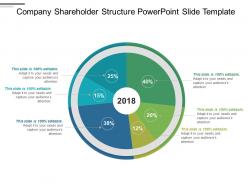 29271561 style division pie 6 piece powerpoint presentation diagram template slide
Presenting company shareholder structure PowerPoint slide template. This layout is fully compatible with Google slides and data driven. User can edit the data in linked excel sheet and graphs and charts gets customized accordingly. Easy to put in company logo, trademark or name; accommodate words to support the key points. Images do no distort out even when they are projected on large screen. Adjust colors, text and fonts as per your business requirements. Fast downloading speed and formats can be easily changed to JPEG and PDF applications.
-
 64118533 style division pie 4 piece powerpoint presentation diagram template slide
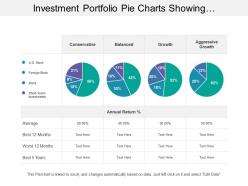
Presenting this set of slides with name - Investment Portfolio Pie Charts Showing Conservative And Balanced Growth. This is a four stage process. The stages in this process are Investment Portfolio, Funding Portfolio, Expenditure Portfolio.
-
 43822914 style division pie 5 piece powerpoint presentation diagram infographic slide
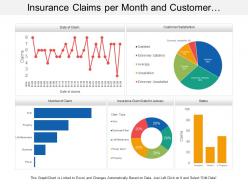
Presenting this set of slides with name - Insurance Claims Per Month And Customer Satisfaction Dashboard. This is a five stage process. The stages in this process are Assurance, Surety, Insurance.
-
 92089318 style division pie 3 piece powerpoint presentation diagram infographic slide
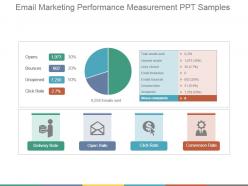
Presenting email marketing performance measurement ppt samples. This is a email marketing performance measurement ppt samples. This is a three stage process. The stages in this process are opens, bounces, unopened, click rate, delivery rate, open rate, click rate, conversion rate.
-
 94044753 style division pie 3 piece powerpoint presentation diagram infographic slide
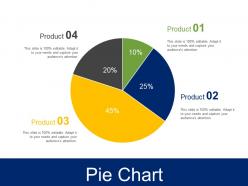
Presenting pie chart ppt infographic template. This is a pie chart ppt infographic template. This is a four stage process. The stages in this process are chart, percentage, business, marketing, strategy.
-
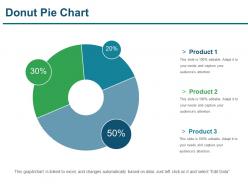 50944699 style division pie-donut 3 piece powerpoint presentation diagram infographic slide
Presenting Donut Pie Chart Presentation Powerpoint. Easy to download PPT layout and can be saved in different formats like JPG, PDF, and PNG. This PowerPoint slide is completely editable so you can modify, font type, font color, shape and image according to your requirements. This Google Slides compatible PPT is available in 4:3 and 16:9 aspect ratios.
-
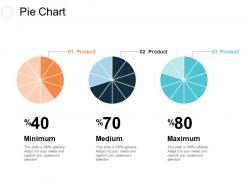 67356338 style division pie 3 piece powerpoint presentation diagram infographic slide
Presenting this set of slides with name - Pie Chart Ppt Slides Guidelines. This is a three stage process. The stages in this process are Business, Management, Strategy, Analysis, Marketing.
-
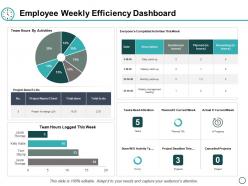 66585044 style essentials 2 financials 4 piece powerpoint presentation diagram infographic slide
Presenting this set of slides with name - Employee Weekly Efficiency Dashboard Ppt Powerpoint Presentation Gallery Styles. This is a four stages process. The stages in this process are Pie Chart, Finance, Marketing, Business, Analysis.
-
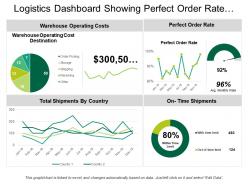 60994626 style division pie 4 piece powerpoint presentation diagram infographic slide
Presenting Logistics Dashboard Showing Perfect Order Rate And On Time Shipments PPT slide. The on-time shipments dashboard PowerPoint template designed professionally by the team of SlideTeam to present the record of on time delivery to clients and investors. The different icons such as pie chart, ring, line chart and many other which include text in the perfect order rate dashboard slide are customizable in PowerPoint. A user can illustrate the desired values as the graphical dashboard template get linked with Excel Sheet and it is also compatible with Google Slide. A user can do alteration in the font size, font type, color and dimensions of the line and pie chart to present the desired delivery time.
-
 24549710 style division pie 3 piece powerpoint presentation diagram infographic slide
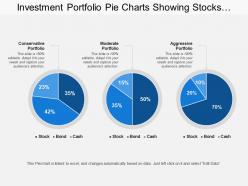
Presenting this set of slides with name - Investment Portfolio Pie Charts Showing Stocks Bonds Cash With Conservative Portfolio. This is a three stage process. The stages in this process are Investment Portfolio, Funding Portfolio, Expenditure Portfolio.
-
 29605289 style division pie 5 piece powerpoint presentation diagram infographic slide
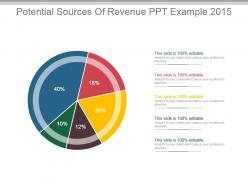
Presenting potential sources of revenue ppt example 2015. This is a potential sources of revenue ppt example 2015. This is a five stage process. The stages in this process are business, management, marketing, finance, pie.
-
 12883535 style division pie 4 piece powerpoint presentation diagram infographic slide
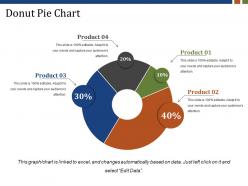
Presenting Donut Pie Chart Presentation PowerPoint slide. This PPT theme is available in both 4:3 and 16:9 aspect ratios. As this PowerPoint template is 100% editable, you can modify color, font size, font type, and shapes as per your requirements. This PPT presentation is Google Slides compatible hence it is easily accessible. You can download and save this PowerPoint layout in different formats like PDF, PNG, and JPG.
-
 42309004 style essentials 2 financials 5 piece powerpoint presentation diagram infographic slide
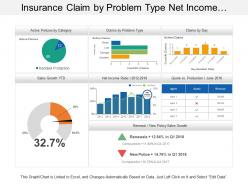
Presenting this set of slides with name - Insurance Claim By Problem Type Net Income Ratio Dashboard. This is a five stage process. The stages in this process are Assurance, Surety, Insurance.
-
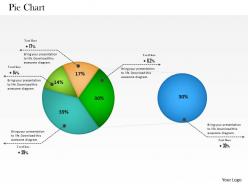 0514 business result data driven pie chart powerpoint slides
We are proud to present our 0514 business result data driven pie chart powerpoint slides. This Business Power Point template is designed with pie chart to highlight the result in any business presentation. Create a good impact on your viewers with our unique template collection.
-
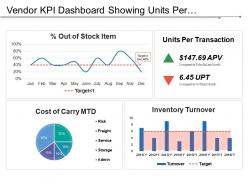 82188138 style essentials 2 financials 4 piece powerpoint presentation diagram infographic slide
Presenting this set of slides with name - Vendor Kpi Dashboard Showing Units Per Transaction Percentage Out Of Stock Items. This is a four stage process. The stages in this process are Vendor, Supplier, Retailer.
-
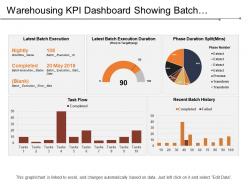 17408097 style essentials 2 financials 5 piece powerpoint presentation diagram infographic slide
Showing, warehousing KPI dashboard PowerPoint Presentation Slide. This Presentation has been designed professionally and is fully editable. You can customize the font size, font type, colors, and even the background. This Template is disciplinary with Google Slide and can be saved in JPG or PDF format without any fuss created. Fast download at the click of the button.
-
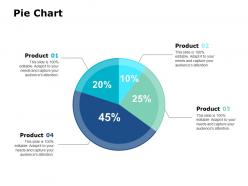 28068702 style essentials 2 financials 3 piece powerpoint presentation diagram infographic slide
Presenting this set of slides with name - Pie Chart Ppt Powerpoint Presentation Model Guide. This is a three stage process. The stages in this process are Analysis, Financials, Business, Management, Strategy.
-
 15827367 style division pie 5 piece powerpoint presentation diagram infographic slide
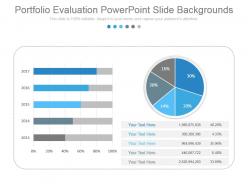
Presenting portfolio evaluation powerpoint slide backgrounds. This is a portfolio evaluation powerpoint slide backgrounds. This is a five stage process. The stages in this process are business, marketing, management, strategy, process.
-
 10539998 style essentials 2 financials 9 piece powerpoint presentation diagram infographic slide
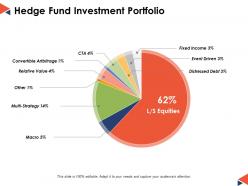
This is a nine stages process. The stages in this process are Pie Chart, Percentage, Marketing, Business, Analysis.
-
 87660521 style division pie 7 piece powerpoint presentation diagram infographic slide
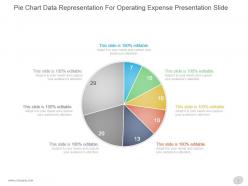
Presenting pie chart data representation for operating expense presentation slide. This is a pie chart data representation for operating expense presentation slide. This is a seven stage process. The stages in this process are business, marketing, pie, circle, piece.
-
 54336500 style essentials 2 financials 5 piece powerpoint presentation diagram infographic slide
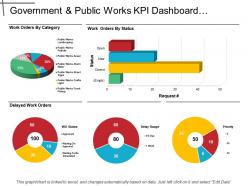
Presenting the KPI dashboard presentation layout. This dashboard template is completely customizable and is professionally designed. You can modify the objects in the template like font color and font size without going through any fuss. This presentation slide is fully compatible with Google Slide and can be saved in JPG or PDF file format without any hassle. Fast download this at the click of the button.
-
 86559284 style essentials 2 financials 3 piece powerpoint presentation diagram infographic slide
Presenting Logistics Dashboard With Revenue Breakdown And Time To Market PPT slide. The revenue breakdown dashboard PowerPoint template designed by the professional team of SlideTeam to present the entire plan to clients as well as investors. The bar chart, pie charts, text and image in time to market dashboard slide are customizable in PowerPoint and can help you in sharing the market sale target. The logistics performance dashboard slide is compatible with Google Slide which makes easy for a presenter to present business financial statistics. A user may do changes in the font size, font type, color and dimensions of the charts to present the desired sales value.
-
 60225619 style essentials 2 financials 6 piece powerpoint presentation diagram infographic slide
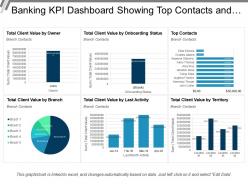
Presenting this set of slides with name - Banking Kpi Dashboard Sowing Top Contacts And Client Value. This is a six stage process. The stages in this process are Banking, Finance, Money.
-
 67647718 style division pie 4 piece powerpoint presentation diagram template slide
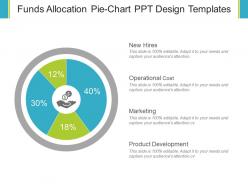
Presenting funds allocation pie chart PPT design templates presentation slide. The cyclic design template is completely compatible with Google Slides and a user can edit it in PowerPoint. You can insert your organization's name and logo in this slide. Slide's quality remains the same, even after doing changes in it such as color, font size, font type, aspect ratio and insert text as per requirement. You may download this pie chart diagram template easily. The pie chart slide is compatible with other formats such as JPEG and PDF.
-
 33724209 style division pie 3 piece powerpoint presentation diagram infographic slide
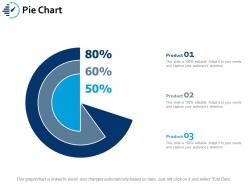
Presenting this set of slides with name - Pie Chart Ppt Portfolio Graphics Example. This is a three stage process. The stages in this process are Business, Management, Strategy, Analysis, Marketing.
-
 33785115 style essentials 2 financials 3 piece powerpoint presentation diagram infographic slide
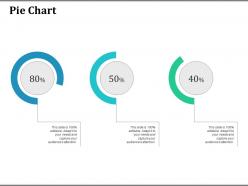
Presenting this set of slides with name - Pie Chart Ppt Professional Background Designs. This is a three stage process. The stages in this process are Percentage, Product, Management.
-
 25887092 style division pie 3 piece powerpoint presentation diagram infographic slide
Presenting commercial report presentation images PowerPoint presentation which is 100% editable. This PPT template is crafted with attractive display and unique components. This PPT slide is easy to customize and enables you to personalize it as per your own criteria. The presentation slide is fully compatible with Google slides, multiple format and software options. In case of any assistance, kindly take instructions from our presentation design services and it is easy to download in a very short span of time. The images, layouts, designs are of high quality and ensures quality in widescreen.
-
 80744440 style essentials 2 financials 2 piece powerpoint presentation diagram infographic slide
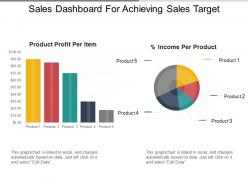
SlideTeam would like to introduce all of you with this totally alterable and user-friendly sales dashboard for achieving sales target PPT templates. This PowerPoint presentation is fully editable which allows you to make changes to its predesigned slides. It allows you to change the size, color, and orientation of various features. By simply following the instructions given in the sample slides you can make these changes. The presentation allows you to save it in the format of either JPG or PDF. You can add or delete any given information from the already prepared slides.


