All Business Slides Financial Analysis Powerpoint Diagram Slide
-
 84023371 style essentials 2 compare 9 piece powerpoint presentation diagram infographic slide
Presenting this set of slides with name - Steps For 3 Ways Match. This is a nine stage process. The stages in this process are Three Way Match,Three Document,Accounting.
-
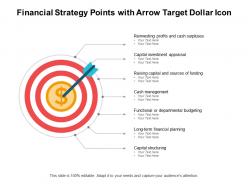 Financial strategy points with arrow target dollar icon
Presenting this set of slides with name Financial Strategy Points With Arrow Target Dollar Icon. This is a one stage process. The stages in this process are Financial Strategy, Business Strategy, Cash Management. This is a completely editable PowerPoint presentation and is available for immediate download. Download now and impress your audience.
-
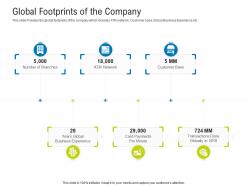 Global footprints of the company raise funding after ipo equity ppt ideas format
This slide Provides the global footprints of the company which includes ATM network, Customer base, Global Business Experience etc. Increase audience engagement and knowledge by dispensing information using Global Footprints Of The Company Raise Funding After IPO Equity Ppt Ideas Format. This template helps you present information on six stages. You can also present information on Payments, Global, Business Experience using this PPT design. This layout is completely editable so personaize it now to meet your audiences expectations.
-
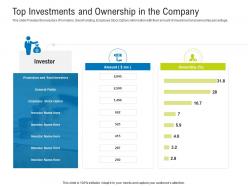 Top investments and ownership in the company raise funding after ipo equity ppt tips
This slide Provides the investors Promoters, Seed Funding, Employee Stock Option information with their amount of investment and ownership percentage. Present the topic in a bit more detail with this Top Investments And Ownership In The Company Raise Funding After IPO Equity Ppt Tips. Use it as a tool for discussion and navigation on Stock, Investor, Promotors. This template is free to edit as deemed fit for your organization. Therefore download it now.
-
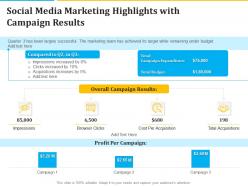 Social media marketing highlights with campaign results
Introducing our Social Media Marketing Highlights With Campaign Results set of slides. The topics discussed in these slides are Expenditure, Cost Per Acquisition, Budget. This is an immediately available PowerPoint presentation that can be conveniently customized. Download it and convince your audience.
-
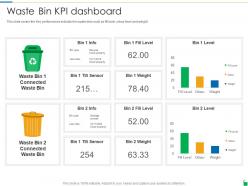 Waste bin kpi dashboard waste disposal and recycling management ppt powerpoint layouts
This slide covers the Key performance indicator for waste bins such as fill level, odour level and weight Deliver an outstanding presentation on the topic using this Waste Bin KPI Dashboard Snapshot Waste Disposal And Recycling Management Ppt Powerpoint Layouts. Dispense information and present a thorough explanation of Waste Bin KPI dashboard using the slides given. This template can be altered and personalized to fit your needs. It is also available for immediate download. So grab it now.
-
 Hobbies 10 minutes self introduction ppt powerpoint presentation pictures clipart
Present the topic in a bit more detail with this Hobbies 10 Minutes Self Introduction Ppt Powerpoint Presentation Pictures Clipart. Use it as a tool for discussion and navigation on Hobbies. This template is free to edit as deemed fit for your organization. Therefore download it now.
-
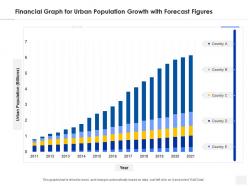 Financial graph for urban population growth with forecast figures
Introducing our Financial Graph For Urban Population Growth With Forecast Figures set of slides. The topics discussed in these slides are Financial Graph For Urban Population Growth With Forecast Figures. This is an immediately available PowerPoint presentation that can be conveniently customized. Download it and convince your audience.
-
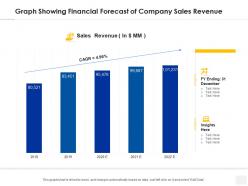 Graph showing financial forecast of company sales revenue
Introducing our Graph Showing Financial Forecast Of Company Sales Revenue set of slides. The topics discussed in these slides are Graph Showing Financial Forecast Of Company Sales Revenue. This is an immediately available PowerPoint presentation that can be conveniently customized. Download it and convince your audience.
-
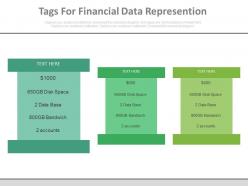 50308053 style essentials 2 financials 3 piece powerpoint presentation diagram infographic slide
Presenting three infographic tags for financial data representation powerpoint slides. This Power Point template slide has been crafted with graphic of three info graphic tags. This PPT slide contains the concept of financial data representation. Use this PPT slide for business and finance related presentations.
-
 50114996 style essentials 2 financials 3 piece powerpoint presentation diagram infographic slide
Presenting three tags with dollar values talktime days facility powerpoint slides. This is a three tags with dollar values talktime days facility powerpoint slides. This is a three stage process. The stages in this process are financials.
-
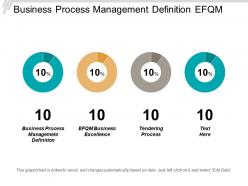 17538000 style essentials 2 financials 4 piece powerpoint presentation diagram infographic slide
This is an editable four stages graphic that deals with topics like Business Process Management Definition, Efqm Business Excellence, Tendering Process to help convey your message better graphically. This product is a premium product available for immediate download, and is 100 percent editable in Powerpoint. Download this now and use it in your presentations to impress your audience.
-
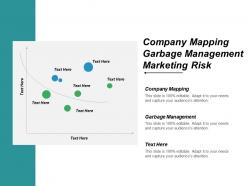 26053447 style essentials 2 financials 3 piece powerpoint presentation diagram infographic slide
This is an editable three stages graphic that deals with topics like Company Mapping, Garbage Management, Marketing Risk, Business Lockout to help convey your message better graphically. This product is a premium product available for immediate download, and is 100 percent editable in Powerpoint. Download this now and use it in your presentations to impress your audience.
-
 7537286 style essentials 2 financials 1 piece powerpoint presentation diagram infographic slide
This is an editable one stages graphic that deals with topics like Leadership Training Program Outline, Leadership Skills Training Program to help convey your message better graphically. This product is a premium product available for immediate download, and is 100 percent editable in Powerpoint. Download this now and use it in your presentations to impress your audience.
-
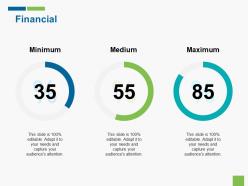 91493894 style division donut 3 piece powerpoint presentation diagram infographic slide
This is a three stage process. The stages in this process are Financial, Analysis, Marketing, Strategy, Business.
-
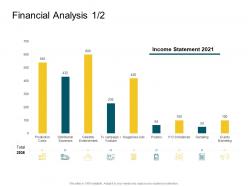 Financial analysis product competencies ppt diagrams
Deliver an outstanding presentation on the topic using this Financial Analysis Product Competencies Ppt Diagrams. Dispense information and present a thorough explanation of Production Cost, Events Marketing, Distribution Expenses using the slides given. This template can be altered and personalized to fit your needs. It is also available for immediate download. So grab it now.
-
 Financial analysis product channel segmentation ppt guidelines
Introducing Financial Analysis Product Channel Segmentation Ppt Guidelines to increase your presentation threshold. Encompassed with one stage, this template is a great option to educate and entice your audience. Dispence information on Financial Analysis, using this template. Grab it now to reap its full benefits.
-
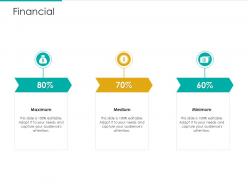 Financial strategic plan marketing business development ppt summary themes
Increase audience engagement and knowledge by dispensing information using Financial Strategic Plan Marketing Business Development Ppt Summary Themes. This template helps you present information on three stages. You can also present information on Maximum, Medium, Minimum using this PPT design. This layout is completely editable so personaize it now to meet your audiences expectations.
-
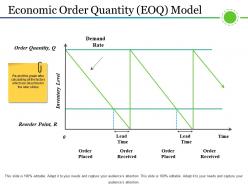 4572867 style concepts 1 decline 3 piece powerpoint presentation diagram infographic slide
Presenting Economic Order Quantity EOQ Model PowerPoint Presentation. This presentation diagram is professionally designed and is completely editable in PowerPoint. You can alter the font type, font size, colors of the diagram, and background color as per your requirement. The slide is fully compatible with Google Slides and can be saved in multiple image formats such as JPG, PNG or document formats such as PDF without any hassle. Moreover, standard and widescreen ratios are supported.
-
 16965798 style linear single 3 piece powerpoint presentation diagram infographic slide
Presenting Logistics And IT PowerPoint Slide Designs PPT template. This presentation diagram is professionally designed and is completely editable in PowerPoint and other office suites. You can customize the font type, font size, colors of the diagram, and background color according to your needs. The slide is fully compatible with Google Slides and can be saved in general image formats such as JPG or PDF without any problem. High-quality graphics and icons ensure that there is no distortion in the quality even when viewed in fullscreen.
-
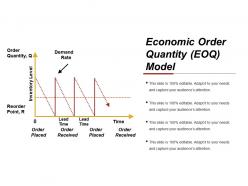 75530477 style essentials 2 financials 2 piece powerpoint presentation diagram infographic slide
Presenting Economic Order Quantity EOQ Model PowerPoint Presentation Examples. This PPT layout is Google Slides compatible. You can download this PowerPoint theme in various formats like PDF, JPG and PNG. As this PPT slide is customizable, you can modify the color, font size, font type, and shapes. This PowerPoint template is available in both 4:3 and 16:9 aspect ratios.
-
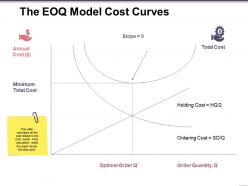 40854697 style essentials 2 financials 3 piece powerpoint presentation diagram infographic slide
Presenting The EOQ cost curves presentation portfolio PPT template. This PowerPoint presentation is completely compatible with Google Slides and can be transformed into various formats. Add or remove the fields of the communication medium as per your organization. This slide can be viewed on standard screen i,e. 4:3 and on widescreen 16:9. Change the colors, font type and the font size of this slide as per your presentation theme.
-
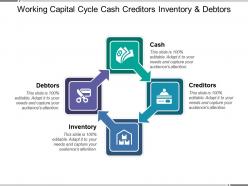 74430492 style division non-circular 4 piece powerpoint presentation diagram infographic slide
Presenting our Working Capital Cycle Cash Creditors Inventory And Debtors PowerPoint template. The PPT is easy to download and can be edited according to your company’s capital flow. The presentation can be downloaded in both widescreen and standard screen aspect ratios. Smooth performance is rendered by the presentation slideshow on all the software. The slideshow is compatible with both google slides and PowerPoint.
-
 60216614 style essentials 2 financials 1 piece powerpoint presentation diagram infographic slide
Presenting this set of slides with name - Working Capital Icon Ppt Example. This is a one stage process. The stages in this process are Working Capital, Wc, Financial Metric.
-
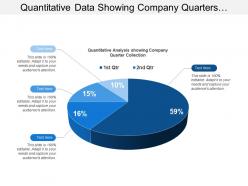 51198665 style division pie 4 piece powerpoint presentation diagram infographic slide
Presenting this set of slides with name - Quantitative Data Showing Company Quarters Collection. This is a four stage process. The stages in this process are Quantitative, Financial Analysis, Statistical Modelling.
-
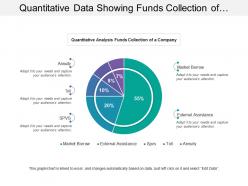 78914345 style division pie 5 piece powerpoint presentation diagram infographic slide
Presenting this set of slides with name - Quantitative Data Showing Funds Collection Of Abc Company. This is a five stage process. The stages in this process are Quantitative, Financial Analysis, Statistical Modelling.
-
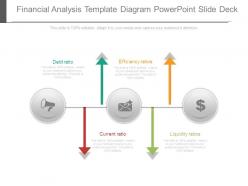 4885427 style linear single 4 piece powerpoint presentation diagram infographic slide
Presenting financial analysis template diagram powerpoint slide deck. This is a financial analysis template diagram powerpoint slide deck. This is a four stage process. The stages in this process are debt ratio, efficiency ratios, liquidity ratios, current ratio.
-
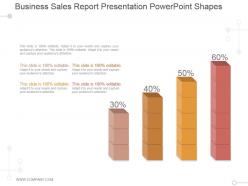 33264401 style concepts 1 growth 4 piece powerpoint presentation diagram infographic slide
Presenting business sales report presentation powerpoint shapes. This is a business sales report presentation powerpoint shapes. This is a four stage process. The stages in this process are finance, growth, success, business, marketing.
-
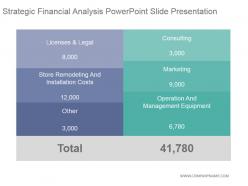 70800211 style essentials 2 financials 2 piece powerpoint presentation diagram infographic slide
Presenting strategic financial analysis powerpoint slide presentation. This is a strategic financial analysis powerpoint slide presentation. This is a two stage process. The stages in this process are licenses and legal, store remodeling and installation costs, other, operation and management equipment, marketing, consulting.
-
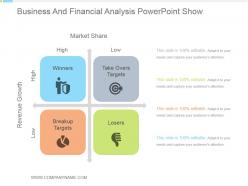 64395685 style hierarchy matrix 4 piece powerpoint presentation diagram infographic slide
Presenting business and financial analysis powerpoint show. This is a business and financial analysis powerpoint show. This is a four stage process. The stages in this process are market share, revenue growth, winners, take overs targets, breakup targets, losers.
-
 54011223 style essentials 2 financials 3 piece powerpoint presentation diagram infographic slide
Presenting three square tags with financial details powerpoint slides. This Power Point template diagram slide has been crafted with graphic of three square tags diagram. This PPT diagram contains the concept of financial details representation. Use this PPT diagram for business and finance related presentations.
-
 47748626 style linear single 4 piece powerpoint presentation diagram infographic slide
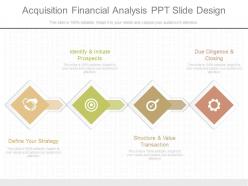
Presenting custom acquisition financial analysis ppt slide design. This is a acquisition financial analysis ppt slide design. This is a four stage process. The stages in this process are identify and initiate prospects, due diligence and closing, define your strategy, structure and value transaction.
-
 Facebook page dashboard ppt powerpoint presentation inspiration layouts
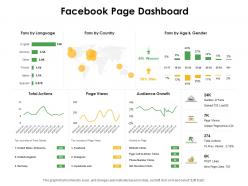
Presenting this set of slides with name Facebook Page Dashboard Ppt Powerpoint Presentation Inspiration Layouts. The topics discussed in these slides are Audience Growth, Sources, Direction. This is a completely editable PowerPoint presentation and is available for immediate download. Download now and impress your audience.
-
 Twitters tweet performance dashboard ppt powerpoint presentation outline template
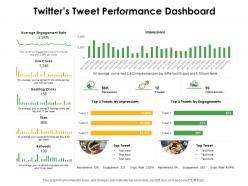
Presenting this set of slides with name Twitters Tweet Performance Dashboard Ppt Powerpoint Presentation Outline Template. The topics discussed in these slides are Average Engagement Rate, Impressions, Engagements. This is a completely editable PowerPoint presentation and is available for immediate download. Download now and impress your audience.
-
 Youtube channel performance dashboard ppt powerpoint presentation infographic template grid
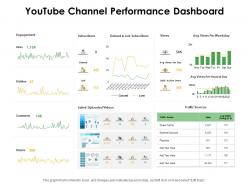
Presenting this set of slides with name Youtube Channel Performance Dashboard Ppt Powerpoint Presentation Infographic Template Grid. The topics discussed in these slides are Comments, Engagement, Shares. This is a completely editable PowerPoint presentation and is available for immediate download. Download now and impress your audience.
-
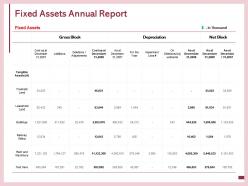 Fixed assets annual report impairment loss adjustments ppt powerpoint presentation layouts model
Presenting this set of slides with name Fixed Assets Annual Report Impairment Loss Adjustments Ppt Powerpoint Presentation Layouts Model. The topics discussed in these slides are Comparison, Marketing, Process, Business, Planning. This is a completely editable PowerPoint presentation and is available for immediate download. Download now and impress your audience.
-
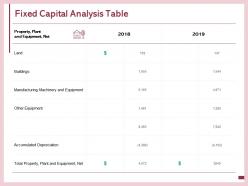 Fixed capital analysis table manufacturing other equipment ppt powerpoint presentation outline visuals
Presenting this set of slides with name Fixed Capital Analysis Table Manufacturing Other Equipment Ppt Powerpoint Presentation Outline Visuals. The topics discussed in these slides are Comparison, Marketing, Process, Business, Planning. This is a completely editable PowerPoint presentation and is available for immediate download. Download now and impress your audience.
-
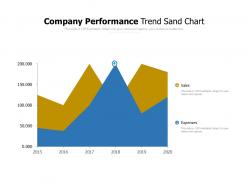 Company performance trend sand chart
Presenting this set of slides with name Company Performance Trend Sand Chart. The topics discussed in these slides are Trend Sand Chart, Company Performance, Product. This is a completely editable PowerPoint presentation and is available for immediate download. Download now and impress your audience.
-
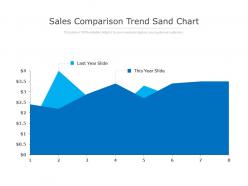 Sales comparison trend sand chart
Presenting this set of slides with name Sales Comparison Trend Sand Chart. The topics discussed in these slides are Trend Sand Chart, Company Performance, Product. This is a completely editable PowerPoint presentation and is available for immediate download. Download now and impress your audience.
-
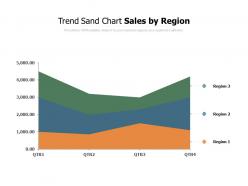 Trend sand chart sales by region
Presenting this set of slides with name Trend Sand Chart Sales By Region. The topics discussed in these slides are Trend Sand Chart, Company Performance, Product. This is a completely editable PowerPoint presentation and is available for immediate download. Download now and impress your audience.
-
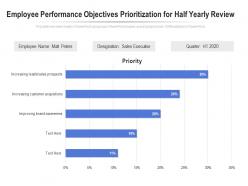 Employee performance objectives prioritization for half yearly review
Presenting this set of slides with name Employee Performance Objectives Prioritization For Half Yearly Review. The topics discussed in these slides are Increasing Leads, Sales Prospects, Improving Brand Awareness, Increasing Customer Acquisitions. This is a completely editable PowerPoint presentation and is available for immediate download. Download now and impress your audience.
-
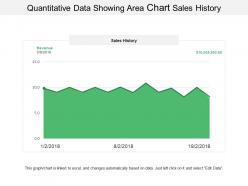 29257444 style essentials 2 financials 1 piece powerpoint presentation diagram infographic slide
Presenting this set of slides with name - Quantitative Data Showing Area Chart Sales History. This is a one stage process. The stages in this process are Quantitative, Financial Analysis, Statistical Modelling.
-
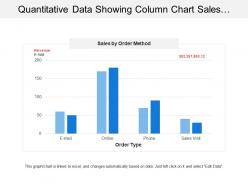 12552042 style essentials 2 financials 4 piece powerpoint presentation diagram infographic slide
Presenting this set of slides with name - Quantitative Data Showing Column Chart Sales By Order Type. This is a four stage process. The stages in this process are Quantitative, Financial Analysis, Statistical Modelling.
-
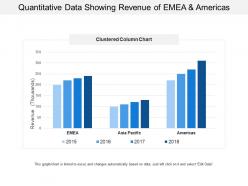 57897052 style essentials 2 financials 3 piece powerpoint presentation diagram infographic slide
Presenting this set of slides with name - Quantitative Data Showing Revenue Of Emea And America. This is a three stage process. The stages in this process are Quantitative, Financial Analysis, Statistical Modelling.
-
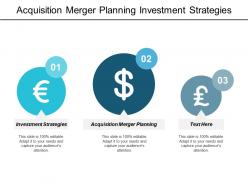 16655694 style variety 2 currency 3 piece powerpoint presentation diagram infographic slide
Presenting this set of slides with name - Acquisition Merger Planning Investment Strategies Future Supply Chain Management Cpb. This is an editable three stages graphic that deals with topics like Acquisition, Merger, Planning, Investment, Strategies, Future, Supply, Chain, Management to help convey your message better graphically. This product is a premium product available for immediate download,and is 100 percent editable in Powerpoint. Download this now and use it in your presentations to impress your audience.
-
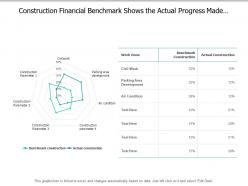 40893158 style essentials 2 financials 2 piece powerpoint presentation diagram infographic slide
Presenting this set of slides with name - Construction Financial Benchmark Shows The Actual Progress Made By The Company. This is a two stage process. The stages in this process are Financial Benchmark, Financial Analysis, Financial Management.
-
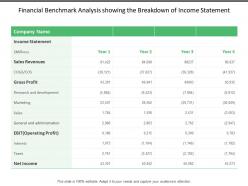 42742127 style essentials 2 compare 4 piece powerpoint presentation diagram infographic slide
Presenting this set of slides with name - Financial Benchmark Analysis Showing The Breakdown Of Income Statement. This is a four stage process. The stages in this process are Financial Benchmark, Financial Analysis, Financial Management.
-
 94020334 style essentials 2 financials 2 piece powerpoint presentation diagram infographic slide
Presenting this set of slides with name - Payment Card With Laptop Displaying Online Transaction. This is a two stage process. The stages in this process are Payment Card, Cash Card, Bank Card.
-
 79677055 style concepts 1 opportunity 4 piece powerpoint presentation diagram infographic slide
Presenting this set of slides with name - Earn Money Icon Of Cash Earning. This is a four stages process. The stages in this process are Earn Money, Earn Cash, Earn Funds.
-
 13014376 style essentials 2 financials 2 piece powerpoint presentation diagram infographic slide
Presenting this set of slides with name - Best Interview Practices Ppt Powerpoint Presentation File Example Cpb. This is an editable two stages graphic that deals with topics like Best Interview Practices to help convey your message better graphically. This product is a premium product available for immediate download, and is 100 percent editable in Powerpoint. Download this now and use it in your presentations to impress your audience.
-
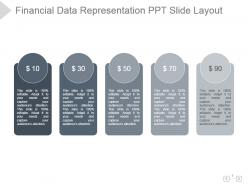 83260477 style layered horizontal 5 piece powerpoint presentation diagram infographic slide
Presenting financial data representation ppt slide layout. Presenting financial data representation ppt slide layout. This is a financial data representation ppt slide layout. This is a five stage process. The stages in this process are financial, data, representation, marketing, management, business.
-
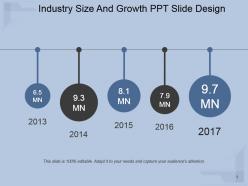 53920663 style essentials 1 roadmap 5 piece powerpoint presentation diagram infographic slide
Presenting industry size and growth ppt slide design. This is a industry size and growth ppt slide design. This is a five stage process. The stages in this process are business, time planning, finance, strategy, process.
-
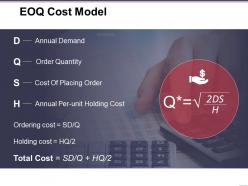 76534255 style essentials 2 financials 1 piece powerpoint presentation diagram infographic slide
Presenting EOQ Cost Model Presentation PowerPoint Example. This presentation diagram is professionally designed and is completely editable in PowerPoint. You can modify/change the font type, size, and colors of the diagram, as per your requirement. The slide is fully compatible with Google Slides and can be saved in multiple image formats such as JPG, PNG or document formats such as PDF without any hassle. Moreover, standard(4:3) and widescreen(16:9) ratios are supported.
-
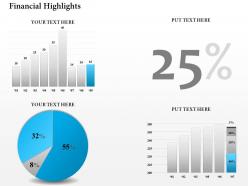 1843728 style essentials 2 financials 1 piece powerpoint presentation diagram infographic slide
Alter the PPT diagram by addition of business label. Swift download and easy to alter into JPEG and PDF document. PowerPoint diagram well-attuned with Google slides. Greater quality presentation design. Specific and easy to apprehend information. Choice to present design in standard and widescreen display view. Presentation slide can be accessed with different nodes and stages. Suitable for finance data management experts, financial reporting team, data analyst etc.
-
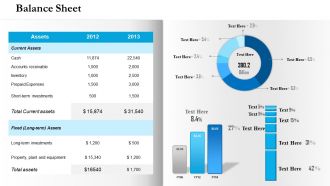 30256711 style essentials 2 financials 1 piece powerpoint presentation diagram infographic slide
High-quality PowerPoint presentation backgrounds. Adaptable PPT slides as fully compatible with Google slides. Does not interfere with the speed and consistency of the system. Beneficial for industry professionals, managers, executives, researchers, etc. The presentation template can be downloaded and saved in any desired format. Privilege of insertion of logo and trademarks for more personalization. Runs effortlessly with all the software’s without generating any errors.
-
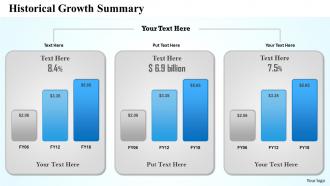 66833420 style essentials 2 financials 1 piece powerpoint presentation diagram infographic slide
Convertible into numerous format options like JPEG, JPG or PDF. Provides a professional outlook to your PowerPoint presentation. Icons can also be added. Customization of each PowerPoint graphic and text according to your desire and want. Multiple display option such as standard and widescreen view. Freedom to customize it with company name and logo. Beneficial for business professionals, students, teachers, business analysts and strategists. Compatible with Google slides as well. Modifiable PPT slide with financial charts and graphs.
-
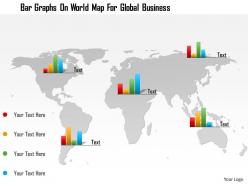 59667463 style essentials 1 location 1 piece powerpoint presentation diagram infographic slide
Presenting0115 bar graphs on world map for global business PowerPoint template. Simple data input like company logo, name or trademark. This PowerPoint theme is fully supported by Google slides. Picture quality of these slides does not change even when project on large screen. Fast downloading speed and formats can be easily changed to JPEG and PDF applications. This template is suitable for marketing, sales persons, business managers and entrepreneurs. Adjust PPT layout, font, text and color as per your necessity
-
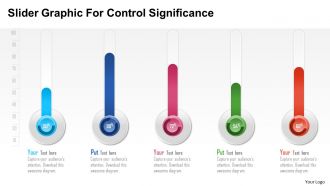 225702 style essentials 2 dashboard 5 piece powerpoint presentation diagram infographic slide
We are proud to present our slider graphic for control significance powerpoint template. Graphic of slider has been used to craft this power point template. This PPT diagram contains the concept of control. Use this PPT diagram for business and marketing related presentations.
-
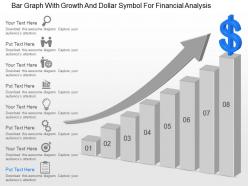 11318840 style concepts 1 growth 8 piece powerpoint presentation diagram infographic slide
Visually appealing PPT presentation slides. Possess the ability to easily grab the attention of the audience without putting much efforts. Creates a strong connection between the audience and the presentation. User-friendly PowerPoint backgrounds. Enables easy understanding and memorising of the contents displayed on these templates. Can be viewed on wide screens without the images and icons being pixelating.
-
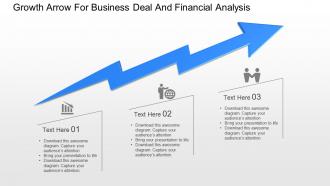 69691797 style concepts 1 growth 3 piece powerpoint presentation diagram infographic slide
They are very competent and immense quality Presentation graphics. These PowerPoint diagrams, matrix charts, designs, style, pattern, size and PowerPoint images can be amendable according to need. It is an exclusive tool convenient and useful for business professionals, students, management scholars, researchers etc from diverse sectors. They have a very gentle and easy downloading option.


