All Business Slides Financial Analysis Powerpoint Diagram Slide
-
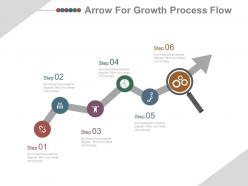 1547169 style essentials 2 financials 6 piece powerpoint presentation diagram infographic slide
Presenting six staged icons growth arrow for process flow powerpoint slides. This Power Point template slide has been crafted with graphic of six staged arrow and icons. This PPT slide contains the concept of process flow analysis. Use this PPT slide for business and finance related presentations.
-
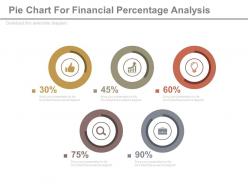 61361646 style essentials 2 financials 5 piece powerpoint presentation diagram infographic slide
Presenting five pie charts for financial percentage analysis powerpoint slides. This Power Point template slide has been crafted with graphic of five pie charts. This PPT slide contains the concept of financial percentage analysis. Use this PPT slide for business and finance related presentations.
-
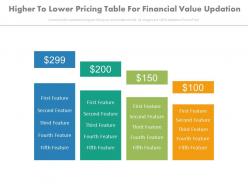 61490178 style essentials 2 financials 4 piece powerpoint presentation diagram infographic slide
Presenting higher to lower pricing table for financial value updation powerpoint slides. This Power Point template slide has been crafted with graphic of pricing table. This PPT slide contains the concept of higher to lower financial value updation and representation. Use this PPT slide for business and finance related presentations.
-
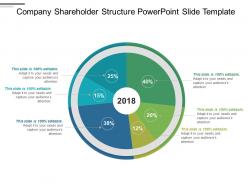 29271561 style division pie 6 piece powerpoint presentation diagram template slide
Presenting company shareholder structure PowerPoint slide template. This layout is fully compatible with Google slides and data driven. User can edit the data in linked excel sheet and graphs and charts gets customized accordingly. Easy to put in company logo, trademark or name; accommodate words to support the key points. Images do no distort out even when they are projected on large screen. Adjust colors, text and fonts as per your business requirements. Fast downloading speed and formats can be easily changed to JPEG and PDF applications.
-
 Top ways to reach your target audience powerpoint presentation slides
Presenting Top Ways To Reach Your Target Audience PowerPoint Presentation Slides. This comprehensive complete deck consists of 58 professional PPT slides. All of them are 100% editable. You can modify the text, colors, patterns, font, and background as per your convenience. It is also fairly simple to convert the PPT format into PDF, PNG, and JPG. You can view this PowerPoint slideshow on Google Slides. Our PPT presentation is replete with powerful data visualization tools. Download now to view it on standard and widescreen formats.
-
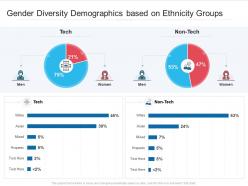 Gender diversity demographics based on ethnicity groups
Presenting our well structured Gender Diversity Demographics Based On Ethnicity Groups. The topics discussed in this slide are Gender Diversity Demographics Based On Ethnicity Groups. This is an instantly available PowerPoint presentation that can be edited conveniently. Download it right away and captivate your audience.
-
 7215876 style essentials 2 financials 1 piece powerpoint presentation diagram infographic slide
We are proud to present our 0414 pie chart for financial result. Activate the energies of your audience with our pie chart for financial result Powerpoint Templates. Get their creative juices flowing with your words. Enhance the stature of your presentation with our pie chart for financial result Powerpoint Templates. Adorn the beauty of your thoughts with their colourful backgrounds.
-
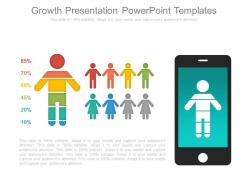 63225429 style essentials 2 financials 1 piece powerpoint presentation diagram infographic slide
Presenting growth presentation powerpoint templates. This is a growth presentation powerpoint templates. This is a one stage process. The stages in this process are business, mobile, presentation,diagram, percentage.
-
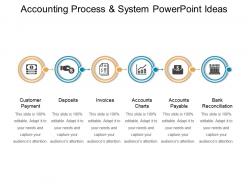 38697714 style linear single 6 piece powerpoint presentation diagram infographic slide
Presenting accounting process and system powerpoint ideas. This is a accounting process and system powerpoint ideas. This is a six stage process. The stages in this process are accounting, book keeping, auditing.
-
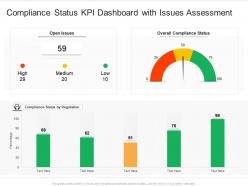 Compliance status kpi dashboard with issues assessment
Introducing our Compliance Status KPI Dashboard With Issues Assessment set of slides. The topics discussed in these slides are Compliance Status KPI Dashboard With Issues Assessment. This is an immediately available PowerPoint presentation that can be conveniently customized. Download it and convince your audience.
-
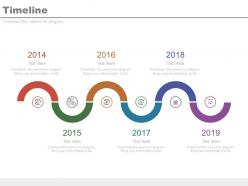 30361382 style essentials 1 roadmap 6 piece powerpoint presentation diagram infographic slide
Presenting six staged spiral timeline for financial analysis powerpoint slides. This power point template diagram has been crafted with graphic of six staged spiral timeline diagram. This PPT icon slide contains the concept of financial analysis representation. Use this PPT diagram for business and finance related presentations.
-
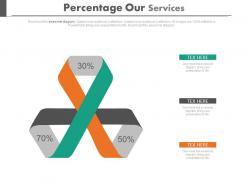 95678643 style essentials 2 financials 3 piece powerpoint presentation diagram infographic slide
Presenting three staged percentage our services diagram powerpoint slides. This Power Point template diagram slide has been crafted with graphic of three staged percentage diagram. This PPT diagram slide contains the concept of our services representation. Use this PPT slide for finance and business related presentations.
-
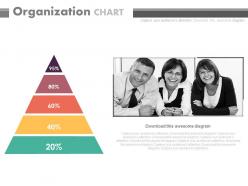 90381149 style essentials 2 financials 5 piece powerpoint presentation diagram infographic slide
Presenting triangle with percentage organization chart powerpoint slides. This Power Point template slide has been crafted with graphic of triangle and percentage..This PPT slide contains the concept of financial data analysis. Use this PPT slide for business and finance related presentations.
-
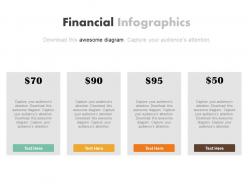 37529366 style essentials 2 financials 4 piece powerpoint presentation diagram infographic slide
Presentation slide graphic of four different price tags for finance. Can be used by marketers, sales people, business analysts, etc. Compatible with number of software options. Colors and text can be easily changed as the PPT slide is completely editable. Personalize the presentation with individual company name and logo. Available in both Standard and Widescreen slide size. Easy and quick downloading process. Flexible option for conversion in PDF or JPG formats. Can use with Google slides.
-
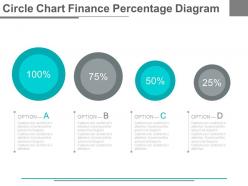 45505562 style essentials 2 financials 4 piece powerpoint presentation diagram infographic slide
Presentation slide representing circle charts with finance percentages. Useful combination of charts and percentages. Compatible with number of software options. Colors, text and fonts can be easily changed as the PPT slide is completely editable. Personalize the presentation with individual company name and logo. Available in both Standard and Widescreen slide size. Easy and quick downloading process. Flexible option for conversion in PDF or JPG formats. Can use with Google slides.
-
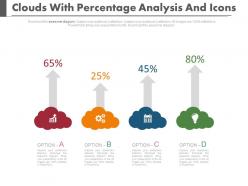 67607 style essentials 2 financials 4 piece powerpoint presentation diagram infographic slide
Presenting four clouds with percentage analysis and icons powerpoint slides. This Power Point template diagram with graphic of four clouds and percentage. This PPT diagram contains the concept of financial analysis. Use this PPT diagram for business and finance related presentations.
-
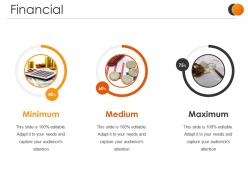 89920391 style linear single 3 piece powerpoint presentation diagram infographic slide
Presenting our Financial Presentation Images PowerPoint Presentation Slide. This is a 100% editable and adaptable PPT slide. You can save it in different formats like PDF, JPG, and PNG. It can be edited with different colors, fonts, font sizes, and font types of the template as per your requirements. This template supports the standard (4:3) and widescreen (16:9) format. It is also compatible with Google Slides.
-
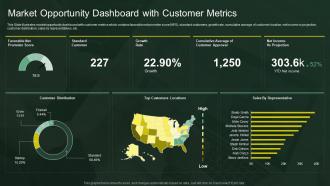 Market Opportunity Dashboard With Customer Metrics
This Slide illustrates market opportunity dashboard with customer metrics which contains favorable net promoter score NPS, standard customers, growth rate, cumulative average of customer location, net income vs projection, customer distribution, sales by representatives, etc. Introducing our Market Opportunity Dashboard With Customer Metrics set of slides. The topics discussed in these slides are Customers Locations, Growth Rate, Customer Distribution. This is an immediately available PowerPoint presentation that can be conveniently customized. Download it and convince your audience.
-
 68967632 style essentials 2 financials 5 piece powerpoint presentation diagram infographic slide
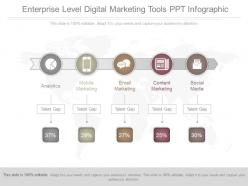
Presenting see enterprise level digital marketing tools ppt infographic. This is a enterprise level digital marketing tools ppt infographic. This is five stage process. The stages in this proces are analytics, mobile marketing, email marketing, content marketing, social media.
-
 1603071 style circular hub-spoke 4 piece powerpoint presentation diagram infographic slide
Presenting ml pie chart percentage growth indication powerpoint template. This Power Point template diagram has been crafted with graphic of pie chart and percentage diagram. This PPT diagram contains the concept of growth indication. Use this PPT diagram for business and marketing related presentations.
-
 81803474 style essentials 2 financials 5 piece powerpoint presentation diagram infographic slide
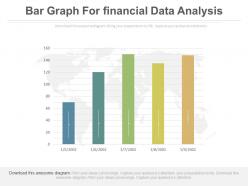
Presenting five staged bar graph for financial data analysis powerpoint slides. This Power Point template slide has been crafted with graphic of five staged bar graph. This PPT slide contains the concept of financial data analysis. Use this PPT slide for business and finance related presentations.
-
 66038222 style division pie 4 piece powerpoint presentation diagram infographic slide
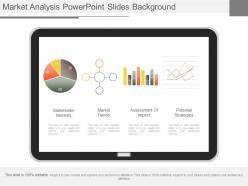
Presenting use market analysis powerpoint slides background. This is a market analysis powerpoint slides background. This is a four stage process. The stages in this process are stakeholder interests, market trends, assessment of impact, potential strategies.
-
 48683151 style layered funnel 3 piece powerpoint presentation diagram infographic slide
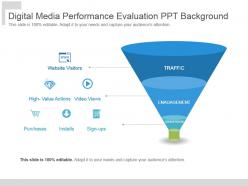
Presenting digital media performance evaluation ppt background. This is a digital media performance evaluation ppt background. This is a three stage process. The stages in this process are traffic, engagement, conversion.
-
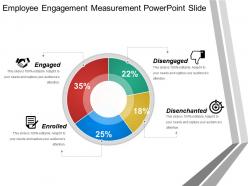 54038381 style division pie 4 piece powerpoint presentation diagram infographic slide
Presenting employee engagement measurement PowerPoint slide. This layout is fully compatible with Google slides and data driven. User can edit the data in linked excel sheet and graphs and charts gets customized accordingly. Easy to put in company logo, trademark or name; accommodate words to support the key points. Images do no distort out even when they are projected on large screen. Adjust colors, text and fonts as per your business requirements.
-
 4389605 style essentials 2 financials 4 piece powerpoint presentation diagram infographic slide
Presenting business peoples social media percentage powerpoint slides. This Power Point template diagram slide has been crafted with graphic of business peoples and percentage diagram. This PPT diagram contains the concept of social media communication. Use this PPT diagram for business and internet related presentations.
-
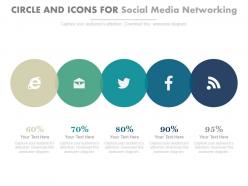 83042872 style essentials 2 financials 5 piece powerpoint presentation diagram infographic slide
Presenting five circles and icons for social media networking powerpoint slides. This Power Point template diagram with graphic of five circles and icons. This PPT diagram contains the concept of social media networking. Use this PPT diagram for business and internet related presentations.
-
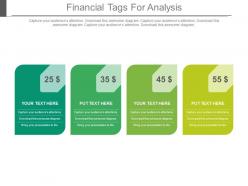 67016414 style essentials 2 financials 4 piece powerpoint presentation diagram infographic slide
Presenting four staged financial tags for analysis powerpoint slides. This Power Point template diagram with graphic of four staged tags. This PPT diagram contains the concept of financial analysis. Use this PPT diagram for business and finance related presentations.
-
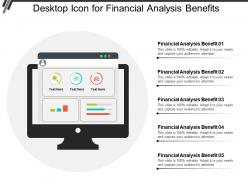 63315820 style technology 1 servers 5 piece powerpoint presentation diagram infographic slide
Presenting this set of slides with name - Desktop Icon For Financial Analysis Benefits. This is a five stage process. The stages in this process are Desktop Icon, Computer Icon, Laptop Screen Icon.
-
 Community bank overview powerpoint presentation slides
Presenting this set of slides with name - Community Bank Overview Powerpoint Presentation Slides. This complete deck is oriented to make sure you do not lag in your presentations. Our creatively crafted slides come with apt research and planning. This exclusive deck with forty-two slides is here to help you to strategize, plan, analyze, or segment the topic with clear understanding and apprehension. Utilize ready to use presentation slides on Community Bank Overview Powerpoint Presentation Slides with all sorts of editable templates, charts and graphs, overviews, analysis templates. By clicking the download button below, you get the presentation in both standard and widescreen format. The presentation is fully supported with Google Slides. It can be easily converted into JPG or PDF format.
-
 Financial concepts risk return powerpoint presentation slides
Presenting this set of slides with name - Financial Concepts Risk Return Powerpoint Presentation Slides. This PPT deck displays twenty-seven slides with in-depth research. We provide a ready to use deck with all sorts of relevant topics subtopics templates, charts and graphs, overviews, analysis templates. It showcases of all kind of editable templates infographics for an inclusive and comprehensive Financial Concepts Risk Return Powerpoint Presentation Slides presentation. By clicking the download button below, you get the presentation in both standard and widescreen format. All slides are fully editable. Change the colors, font size, add or delete text if needed. The presentation is fully supported with Google Slides. It can be easily converted into JPG or PDF format.
-
 Book Value Market Business Visual Deck Powerpoint Presentation PPT Image ECP
Introducing a Visual PPT on Book Value Market Business. Every slide in this PowerPoint is meticulously designed by our Presentation Experts. Modify the content as you see fit. Moreover, the PowerPoint Template is suitable for screens and monitors of all dimensions, and even works seamlessly with Google Slides. Download the PPT, make necessary changes, and present with confidence.
-
 Fair Market Value AI Image Powerpoint Presentation PPT ECS
Introducing a Visual PPT on Fair Market Value. Each PPT Slide is a testament to the expertise of our Design Teams Craftsmen. Personalize the Google Slides-compatible PowerPoint Slide with ease. Download the PPT, modify as you desire, and showcase it with poise.
-
 41100848 style essentials 2 dashboard 4 piece powerpoint presentation diagram infographic slide
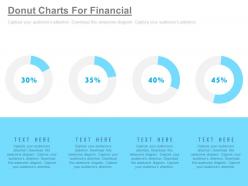
Presenting four staged donut charts for financial analysis powerpoint slides. This Power Point template slide has been crafted with graphic of four donut charts diagram. This PPT diagram contains the concept of financial analysis. Use this PPT diagram slide for business and finance related presentations.
-
 26475154 style essentials 2 financials 4 piece powerpoint presentation diagram infographic slide
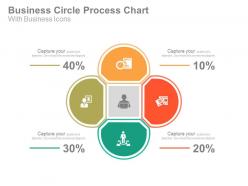
Presenting business circle process chart with business icons powerpoint slides. This Power Point template diagram has been crafted with graphic of business circle process chart and icons diagram. This PPT diagram contains the concept of business process analysis. Use this PPT diagram for business and finance related presentations.
-
 34945548 style essentials 2 financials 4 piece powerpoint presentation diagram infographic slide
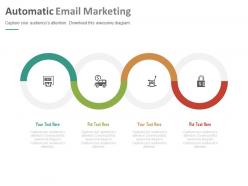
Presenting four staged automatic email marketing powerpoint slides. This Power Point template diagram has been crafted with graphic of email diagram. This PPT diagram contains the concept of automatic email marketing. Use this PPT diagram for business and marketing related presentations.
-
 36200808 style essentials 2 financials 1 piece powerpoint presentation diagram infographic slide
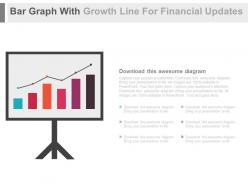
Presenting bar graph with growth line for financial updates powerpoint slides. This is a bar graph with growth line for financial updates powerpoint slides. This is a one stage process. The stages in this process are financials.
-
 60920473 style essentials 2 financials 1 piece powerpoint presentation diagram infographic slide
Presenting company detail product infographics slide powerpoint slides. This is a company detail product infographics slide powerpoint slides. This is a one stage process. The stages in this process are financials.
-
 48220826 style essentials 1 location 4 piece powerpoint presentation diagram infographic slide
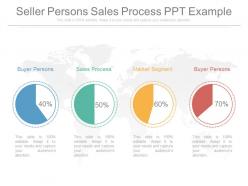
Presenting seller persons sales process ppt example. This is a seller persons sales process ppt example. This is a four stage process. The stages in this process are finance, business, management.
-
 Stock pitch for personal physical fitness powerpoint presentation slides
Our Stock Pitch For Personal Physical Fitness Powerpoint Presentation Slides is the perfect way to pitch your stock. We have researched thousands of stock pitches and designed the most impactful way to convince your investors to invest in your equity.
-
 83162011 style essentials 2 financials 4 piece powerpoint presentation diagram infographic slide
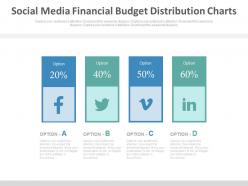
Presenting social media financial budget distribution charts powerpoint slides. This Power Point template slide has been crafted with graphic of distribution chart diagram. This PPT slide contains the concept of financial budget distribution for social media usage. Use this PPT slide for business and finance related presentations.
-
 Employee Wellbeing And Benefits Dough Nut Graph
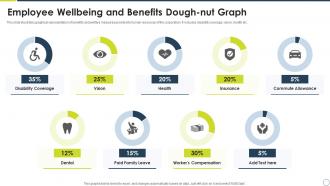
Introducing our Employee Wellbeing And Benefits Dough Nut Graph set of slides. The topics discussed in these slides are Disability Coverage, Vision, Compensation. This is an immediately available PowerPoint presentation that can be conveniently customized. Download it and convince your audience.
-
 474095 style essentials 2 financials 5 piece powerpoint presentation diagram infographic slide
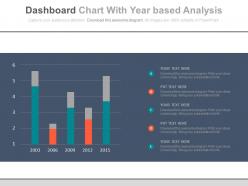
Presenting dashboard chart with year based analysis powerpoint slides. This Power Point template slide has been crafted with graphic of dashboard chart. This PPT slide contains the concept of year based analysis. Use this PPT slide for business and finance related presentations.
-
 34221293 style essentials 2 financials 4 piece powerpoint presentation diagram infographic slide
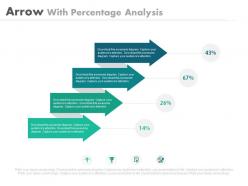
Presenting four arrows with percentage analysis powerpoint slides. This Power Point template slide has been crafted with graphic of four arrows and percentage icons. This PPT slide contains the concept of percentage analysis representation. Use this PPT slide for business and finance related presentations.
-
 4635844 style essentials 2 financials 1 piece powerpoint presentation diagram infographic slide
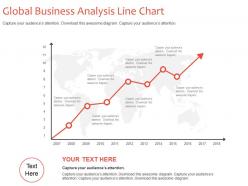
Presenting global business analysis line chart powerpoint slides. This Power Point template slide has been crafted with graphic of line chart. This PPT slide contains the concept of global business analysis representation. Use this PPT slide for business and finance related presentations.
-
 5 point likert scale with response visual presentation
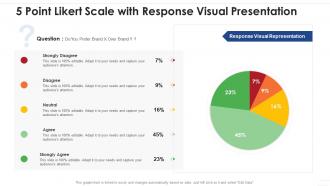
Introducing our 5 Point Likert Scale With Response Visual Presentation set of slides. The topics discussed in these slides are 5 Point Likert Scale With Response Visual Presentation. This is an immediately available PowerPoint presentation that can be conveniently customized. Download it and convince your audience.
-
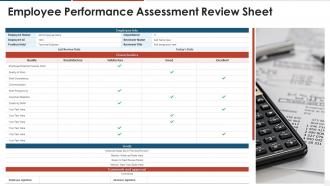 Employee performance assessment review sheet
Presenting our set of slides with Employee Performance Assessment Review Sheet. This exhibits information on one stage of the process. This is an easy to edit and innovatively designed PowerPoint template. So download immediately and highlight information on Employee Performance Assessment Review Sheet.
-
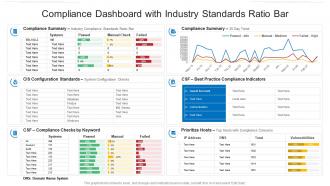 Compliance dashboard with industry standards ratio bar
Presenting our well structured Compliance Dashboard With Industry Standards Ratio Bar. The topics discussed in this slide are Compliance Dashboard With Industry Standards Ratio Bar. This is an instantly available PowerPoint presentation that can be edited conveniently. Download it right away and captivate your audience.
-
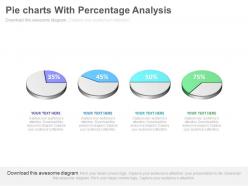 40045141 style essentials 2 financials 4 piece powerpoint presentation diagram infographic slide
Presenting four pie charts with percentage analysis powerpoint slides. This is a four pie charts with percentage analysis powerpoint slides. This is a four stage process. The stages in this process are financials.
-
 12721344 style essentials 2 financials 6 piece powerpoint presentation diagram infographic slide
Presenting six staged pie chart for financial management analysis powerpoint slides. This Power Point template diagram has been crafted with graphic of six staged pie chart and percentage diagram. This PPT diagram contains the concept of financial management analysis. Use this PPT diagram for business and finance related presentations.
-
 Telephone resume dollar financial analysis ppt icons graphics
Presenting telephone resume dollar financial analysis ppt icons graphics. This Power Point icons template slide has been crafted with graphic of telephone, r?sum? and dollar icons. This PPT diagram contains the concept of financial analysis. Use this PPT diagram for business and finance related presentations.
-
 79481311 style essentials 2 financials 5 piece powerpoint presentation diagram infographic slide
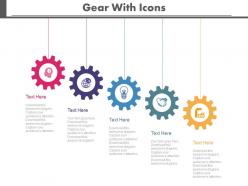
Presenting colored gears with icons for process control powerpoint slides. This Power Point template diagram slide has been crafted with graphic of colored gears and icons diagram. This PPT diagram contains the concept of business process control representation. Use this PPT diagram for business and finance related presentations.
-
 84275411 style essentials 2 financials 4 piece powerpoint presentation diagram infographic slide
Presenting four colored tags and icons for money strategy powerpoint slides. This Power Point template diagram slide has been crafted with graphic of four colored tags and icons diagram. This PPT diagram contains the concept of money strategy representation. Use this PPT diagram for business and marketing related presentations.
-
 76330972 style essentials 2 financials 4 piece powerpoint presentation diagram infographic slide
Presenting four staged semicircle chart with percentage powerpoint slides. This is a four staged semicircle chart with percentage powerpoint slides. This is a four stage process. The stages in this process are financials.
-
 29188967 style essentials 2 financials 4 piece powerpoint presentation diagram infographic slide
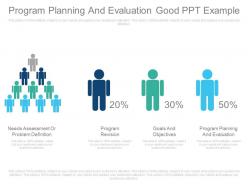
Presenting custom program planning and evaluation good ppt example. This is a program planning and evaluation good ppt example. This is a four stage process. The stages in this process are needs assessment or problem definition, program revision, goals and objectives, program planning and evaluation.
-
 264238 style variety 2 currency 4 piece powerpoint presentation diagram infographic slide
Presenting this set of slides with name - Liquidity Icon Showing Money Bag. This is a four stage process. The stages in this process are Cash Assets, Solvency, Liquidity.
-
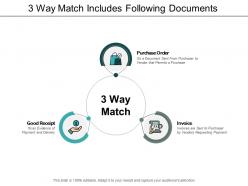 32048073 style circular loop 3 piece powerpoint presentation diagram infographic slide
Presenting this set of slides with name - 3 Way Match Includes Following Documents. This is a three stage process. The stages in this process are Three Way Match,Three Document,Accounting.
-
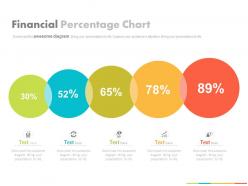 98855187 style essentials 2 financials 5 piece powerpoint presentation diagram infographic slide
Presenting five staged financial percentage chart powerpoint slides. This Power Point template slide has been crafted with graphic of five staged percentage chart. This PPT slide contains the concept of financial analysis. Use this PPT slide for business and finance related presentations.
-
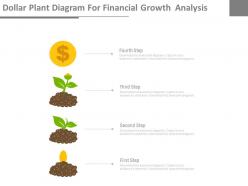 81008029 style essentials 2 financials 4 piece powerpoint presentation diagram infographic slide
Presenting dollar plant diagram for financial growth analysis powerpoint slides. This Power Point template diagram with graphic of dollar plant and finance icons. This PPT diagram contains the concept of financial growth analysis. Use this PPT diagram for business and finance related presentations.
-
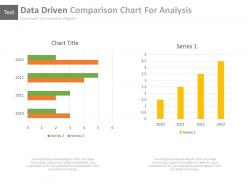 90563187 style essentials 2 financials 2 piece powerpoint presentation diagram infographic slide
Presenting two data driven comparison charts for analysis powerpoint slides. This Power Point template diagram with graphic of two data driven chart diagram. This PPT diagram contains the concept of data comparison analysis. Use this PPT diagram for business and finance related presentations.
-
 Finance risk and return powerpoint presentation slides
Presenting this set of slides with name - Finance Risk And Return Powerpoint Presentation Slides. This PPT deck displays twenty-eight slides with in-depth research. Our topic oriented Finance Risk And Return Powerpoint Presentation Slides presentation deck is a helpful tool to plan, prepare, document and analyse the topic with a clear approach. We provide a ready to use deck with all sorts of relevant topics subtopics templates, charts, and graphs, overviews, analysis templates. It showcases of all kind of editable templates. Edit the color, text, font style at your ease. Add or delete content if needed. Download PowerPoint templates in both widescreen and standard screen. The presentation is fully supported by Google Slides. It can be easily converted into JPG or PDF format.


