All Business Slides Financials Powerpoint Diagram Slide
-
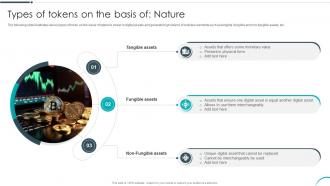 Types Of Tokens On The Basis Of Nature Revolutionizing Investments With Asset BCT SS
The following slide illustrates various types of token on the basis of nature to invest in digital assets and generate high returns. It includes elements such as tangible, fungible and non-fungible assets, etc. Introducing Types Of Tokens On The Basis Of Nature Revolutionizing Investments With Asset BCT SS to increase your presentation threshold. Encompassed with three stages, this template is a great option to educate and entice your audience. Dispence information on Tangible Assets, Fungible Assets, Non-Fungible Assets, using this template. Grab it now to reap its full benefits.
-
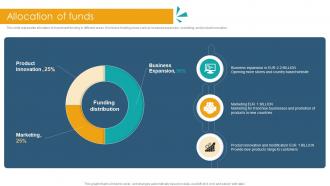 Allocation Of Funds House Accessories Investor Funding Elevator Pitch Deck
This slide represents allocation of investment funding in different areas. It includes funding areas such as business expansion, marketing, and product innovation. Present the topic in a bit more detail with this Allocation Of Funds House Accessories Investor Funding Elevator Pitch Deck. Use it as a tool for discussion and navigation on Product Innovation, Business Expansion, Marketing. This template is free to edit as deemed fit for your organization. Therefore download it now.
-
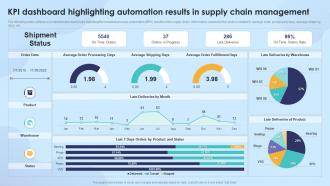 KPI Dashboard Highlighting Automation Results In Supply Chain Strengthening Process Improvement
The following slide outlines a comprehensive dashboard depicting the business process automation BPA results in the supply chain. Information covered in the slide is related to average order processing days, average shipping days, etc. Present the topic in a bit more detail with this KPI Dashboard Highlighting Automation Results In Supply Chain Strengthening Process Improvement. Use it as a tool for discussion and navigation on Shipment Status, Average Order Processing Days, Average Order Fulfillment Days, Late Deliveries By Warehouse, Late Deliveries Product. This template is free to edit as deemed fit for your organization. Therefore download it now.
-
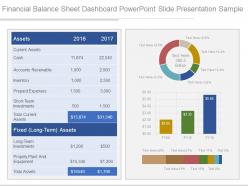 51766737 style essentials 2 financials 2 piece powerpoint presentation diagram infographic slide
Presenting financial balance sheet dashboard powerpoint slide presentation sample. This is a financial balance sheet dashboard powerpoint slide presentation sample. This is a two stage process. The stages in this process are assets, current assets, cash, accounts receivable, inventory, prepaid expenses, total current assets.
-
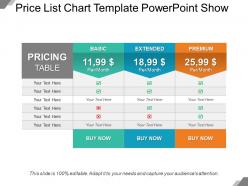 66212918 style essentials 2 financials 3 piece powerpoint presentation diagram infographic slide
Presenting price list chart template PowerPoint show slideshow which is 100% editable. This PPT template is crafted with attractive display and unique components. This PPT slide is easy to customize and enables you to personalize it as per your own criteria. The presentation slide is fully compatible with Google slides, multiple format and software options. In case of any assistance, kindly take instructions from our presentation design services and it is easy to download in a very short span of time. The images, layouts, designs are of high quality and ensures quality in widescreen.
-
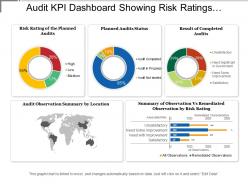 22344256 style essentials 2 financials 5 piece powerpoint presentation diagram infographic slide
Presenting this set of slides with name - Audit Kpi Dashboard Showing Risk Ratings Planned Audit Status. This is a five stage process. The stages in this process are Audit, Examine, Survey.
-
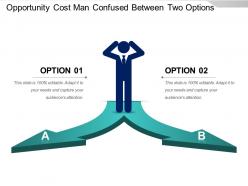 44443408 style linear 1-many 2 piece powerpoint presentation diagram infographic slide
Presenting opportunity cost man confused between two options. This is a opportunity cost man confused between two options. This is a two stage process. The stages in this process are alternative cost, opportunity cost, alternative price, expected return.
-
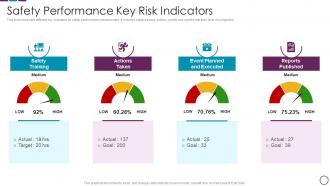 Safety Performance Key Risk Indicators
slide shows the different key indicators for safety performance measurement . It includes safety training, actions, events and reports with their level of completion. Introducing our Safety Performance Key Risk Indicators set of slides. The topics discussed in these slides are Safety Performance Key Risk Indicators. This is an immediately available PowerPoint presentation that can be conveniently customized. Download it and convince your audience.
-
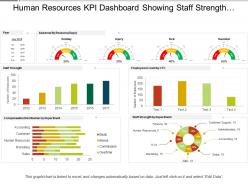 29565185 style essentials 2 financials 5 piece powerpoint presentation diagram infographic slide
SlideTeam presenting Human Resources Kpi Dashboard Showing Staff Strength Compensation Distribution PPT. It will not only help you in knowing the exact strength of the staff but also about actual staff required in the organization. This slideshow is entirely editable and you can edit it whenever you want. All the slides in this presentation are compatible with Google slides. You can enter thousands of relatable icons of your own choice. You can also change from 4:3 standard screen size to 16:9 widescreen size.
-
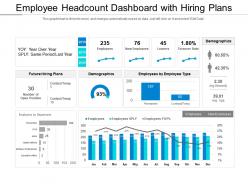 Employee headcount dashboard with hiring plans
Presenting this set of slides with name Employee Headcount Dashboard With Hiring Plans. The topics discussed in these slides are Employee, Headcount, Dashboard, Hiring Plans. This is a completely editable PowerPoint presentation and is available for immediate download. Download now and impress your audience.
-
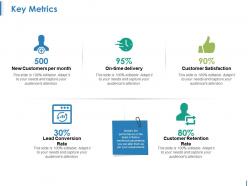 74178600 style essentials 2 financials 5 piece powerpoint presentation diagram infographic slide
Presenting this set of slides with name - Key Metrics Ppt Design Templates. This is a five stage process. The stages in this process are New Customers Per Month, On Time Delivery, Customer Satisfaction, Lead Conversion Rate, Customer Retention Rate.
-
 Talent Acquisition And Recruitment Analytics Dashboard
The slide highlights the talent acquisition and recruitment analytics dashboard depicting total application, experience, gender diversity, application type, salary preference, employee details and open positions by department. Introducing our Talent Acquisition And Recruitment Analytics Dashboard set of slides. The topics discussed in these slides are Salary Preference, Application Type, Inexperience Candidates. This is an immediately available PowerPoint presentation that can be conveniently customized. Download it and convince your audience.
-
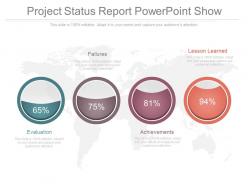 31542102 style essentials 2 financials 4 piece powerpoint presentation diagram infographic slide
Presenting project status report PowerPoint show. Change PowerPoint slide structure, font, text, color and design as per your requirements. Easy data entry options to put in company logo, brand or name. Ideal for marketing professionals, business managers, entrepreneurs and big organizations. This presentation theme is totally in sync with Google slide. Easy conversion to other software’s like JPG and PDF formats. Image quality remains the unchanged even when resize the image or portray on large screens.
-
 Financing forecasting process and methods powerpoint presentation slides
Presenting financing forecasting process and methods PowerPoint presentation slides. This presentation consists 74 professionally outlined PowerPoint slides, all of them being 100 percent changeable in PowerPoint. Content fonts dimension and type, colors and template background of the presentation slides are customizable. The presentation templates can be downloaded in both wide screen (16:9) and standard view (4:3) aspect ratio. The PPT templates are entirely adjustable with Google Slides and other online applications. PowerPoint slides can be saved in various formats such as JPG or PDF. You can add the organization name or logo to personalize the PowerPoint slides. Premium product support is provided.
-
 Financial ratio analysis and interpretation powerpoint presentation slides
100% editable slides let you edit them to the way you want. A total of 25 deeply researched slides. Instant download option lets you download with a click. Standard and widescreen mode compatibility. Can be viewed in Google Slides also. Suitable for financial department, analysts, business leaders and organisations. The stages in this process are accounting ratio, financial statement, financial ratio analysis and interpretation.
-
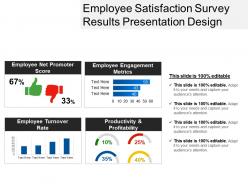 18984594 style essentials 2 financials 4 piece powerpoint presentation diagram infographic slide
Presenting Employee Satisfaction Survey Results Presentation Design. The slide is completely customizable and can be downloaded in various formats like JPG, PNG, and JPEG. It goes well with the Google Slides and the major Microsoft versions. Also, you are free to change the colors, font type and the font size of the slide. The background of the template can also be altered. The template can be viewed on two screen sizes i.e. standard screen (4:3) and widescreen (16:9).
-
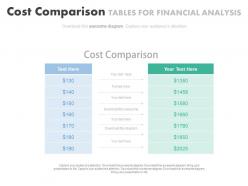 12710797 style essentials 2 financials 2 piece powerpoint presentation diagram template slide
Professionally designed Presentation slides. Useful combination of shapes and text using a circular. Compatible with number of software options. Colors, text and fonts. Can be easily changed as the PPT slide is completely editable. Personalize the presentation with individual company name and logo. Available in both Standard and Widescreen slide size. Flexible option for conversion in PDF or JPG formats. Fully adjustable with Google slides. Suitable for finance experts, accounts team professionals, education firms etc.
-
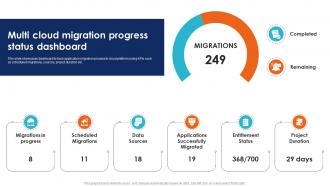 Multi Cloud Migration Progress Status Seamless Data Transition Through Cloud CRP DK SS
This slide showcases dashboard to track application migration process to cloud platform using KPIs such as scheduled migrations, sources, project duration etc. Present the topic in a bit more detail with this Multi Cloud Migration Progress Status Seamless Data Transition Through Cloud CRP DK SS. Use it as a tool for discussion and navigation on Migrations In Progress, Scheduled Migrations, Data Sources, Entitlement Status. This template is free to edit as deemed fit for your organization. Therefore download it now.
-
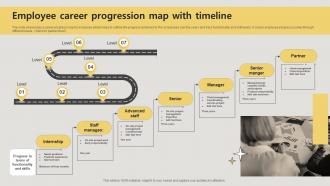 Employee Career Progression Map With Timeline
The slide showcases a career progress map for employee which helps to outline the progress achieved by the employees over the years and track functionality and skill levels. It covers employee progress journey through different levels intern to partner level. Introducing our premium set of slides with Employee Career Progression Map With Timeline Ellicudate the seven stages and present information using this PPT slide. This is a completely adaptable PowerPoint template design that can be used to interpret topics like Internship, Advanced Staff, Manager, Senior Manger . So download instantly and tailor it with your information.
-
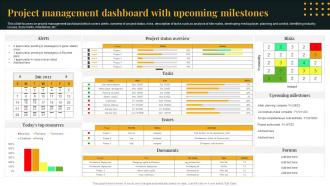 Project Management Dashboard With Upcoming Milestones
This slide focuses on project management dashboard which covers alerts, overview of project status, risks, description of tasks such as analysis of site matrix, developing media player, planning and control, identifying industry, issues, documents, milestones, etc. Presenting our well structured Project Management Dashboard With Upcoming Milestones. The topics discussed in this slide are Project Status Overview, Upcoming Milestones, Risks. This is an instantly available PowerPoint presentation that can be edited conveniently. Download it right away and captivate your audience.
-
 Accounting analysis and planning powerpoint presentation slide
Pixel friendly images and icons used here are available to download and be readily replaced. Downloading the slides gives you access to edit the background with the company name or brand logo and further personalization. Follow guidelines to make modifications in the template. Used by the business leaders, professional analysts, and the student fraternity learning business. Can be converted into JPG/JPEG/PDF format easily.
-
 2453731 style division donut 5 piece powerpoint presentation diagram template slide
Presenting business development statistics results slide powerpoint templates. This is a business development statistics results slide powerpoint templates. This is a five stage process. The stages in this process are results, output, deliverables, goals.
-
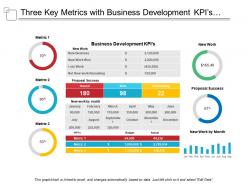 22987331 style division donut 3 piece powerpoint presentation diagram infographic slide
Presenting this set of slides with name - Three Key Metrics With Business Development Kpis And Proposal Success. This is a three stage process. The stages in this process are Key Metrics, Key Performance Indicator, Kpi.
-
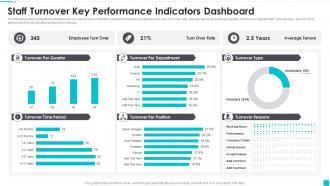 Staff Turnover Key Performance Indicators Dashboard
The following slide highlights the staff turnover key performance Indicators dashboard snapshot illustrating employee turn over, turn over rate, average tenure, turnover per quarter, turnover per department, turnover type, turnover time period, turnover per position and turnover reasons. Introducing our Staff Turnover Key Performance Indicators Dashboard set of slides. The topics discussed in these slides are Turnover Per Quarter, Turnover Time Period, Turnover Per Position. This is an immediately available PowerPoint presentation that can be conveniently customized. Download it and convince your audience.
-
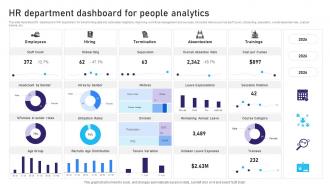 HR Department Dashboard For People Analytics
This slide illustrates KPI Dashboard of HR department for transforming data into actionable insights by improving workforce management and success. It includes metrics such as staff count, onboarding, separation, overall absentee rate, cost per trainee, etc. Introducing our HR Department Dashboard For People Analytics set of slides. The topics discussed in these slides are Employees, Hiring, Termination. This is an immediately available PowerPoint presentation that can be conveniently customized. Download it and convince your audience.
-
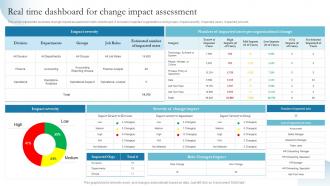 Real Time Dashboard For Change Impact Assessment
This slide represents business change impact assessment metric dashboard. It includes impacted organizations and groups, impact severity, impacted users, impacted jobs etc. Introducing our Real Time Dashboard For Change Impact Assessment set of slides. The topics discussed in these slides are Departments, Real Time Dashboard, Impact Assessment. This is an immediately available PowerPoint presentation that can be conveniently customized. Download it and convince your audience.
-
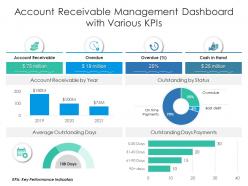 Account receivable management dashboard with various kpis
Introducing our Account Receivable Management Dashboard Snapshot With Various KPIs set of slides. The topics discussed in these slides are Account Receivable, Key Performance Indicators, Payments. This is an immediately available PowerPoint presentation that can be conveniently customized. Download it and convince your audience.
-
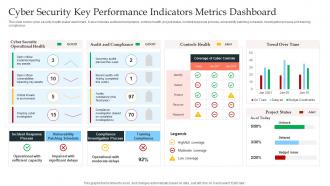 Cyber Security Key Performance Indicators Metrics Dashboard
This slide covers cyber security health status dashboard . It also includes audit and compliance, controls health, project status, incident response process, vulnerability patching schedule, investigation process and training compliance. Presenting our well-structured Cyber Security Key Performance Indicators Metrics Dashboard. The topics discussed in this slide are Cyber Security, Key Performance Indicators, Metrics Dashboard. This is an instantly available PowerPoint presentation that can be edited conveniently. Download it right away and captivate your audience.
-
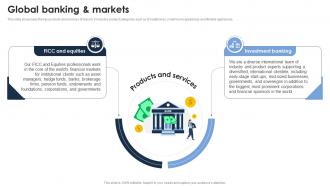 Global Banking And Markets Goldman Sach Company Profile CP SS
This slide showcases the key products and services of Xiaomi. It includes product categories such as Smartphones, smart home appliances and lifestyle appliances. Increase audience engagement and knowledge by dispensing information using Global Banking And Markets Goldman Sach Company Profile CP SS This template helps you present information on two stages. You can also present information on Investment Banking, FICC And Equities using this PPT design. This layout is completely editable so personaize it now to meet your audiences expectations.
-
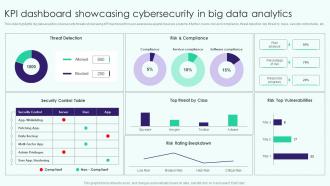 Kpi Dashboard Showcasing Cybersecurity In Big Data Analytics
This slide highlights big data analytics cybersecurity threats showcasing KPI dashboard for user awareness against insecure systems. It further covers risk and compliance, threat detection, top threat by class, security control table, etc. Presenting our well structured Kpi Dashboard Showcasing Cybersecurity In Big Data Analytics. The topics discussed in this slide are KPI Dashboard, Showcasing Cybersecurity, Big Data Analytics, Security Control Table. This is an instantly available PowerPoint presentation that can be edited conveniently. Download it right away and captivate your audience.
-
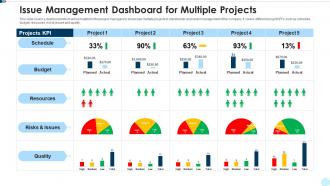 Issue management dashboard for multiple projects
Introducing our Issue Management Dashboard For Multiple Projects set of slides. The topics discussed in these slides are Issue Management Dashboard For Multiple Projects. This is an immediately available PowerPoint presentation that can be conveniently customized. Download it and convince your audience.
-
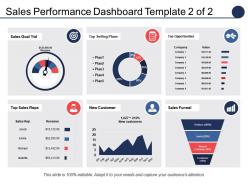 81906914 style essentials 2 financials 6 piece powerpoint presentation diagram infographic slide
Presenting sales performance dashboard top selling plans top opportunities PPT template. Completely amendable by any user at any point of time without any hassles. Error free performance to put an everlasting impression on the viewers. Great for incorporating business details such as name, logo and trademark. Can be utilized by students, entrepreneurs, investors and customers. Professionally designed presentation slides. Personalize the presentation with individual company name and logo. Available in both Standard and Widescreen slide size.
-
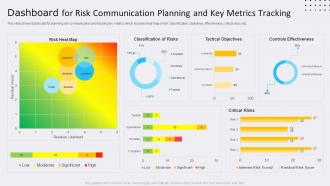 Dashboard For Risk Communication Planning And Key Metrics Tracking
This slide shows dashboard snapshot for planning risk communication and tracking key metrics which includes heat map of risk, classification, objectives, effectiveness, critical risks, etc. Presenting our well-structured Dashboard For Risk Communication Planning And Key Metrics Tracking. The topics discussed in this slide are Classification Risks, Tactical Objectives, Controls Effectiveness. This is an instantly available PowerPoint presentation that can be edited conveniently. Download it right away and captivate your audience.
-
 34879238 style essentials 2 financials 5 piece powerpoint presentation diagram infographic slide
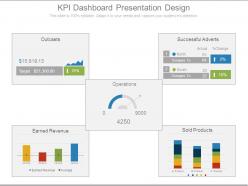
Presenting kpi dashboard presentation design. This is a kpi dashboard presentation design. This is a five stage process. The stages in this process are outcasts, operations, successful adverts, earned revenue, sold products.
-
 35658620 style division donut 3 piece powerpoint presentation diagram infographic slide
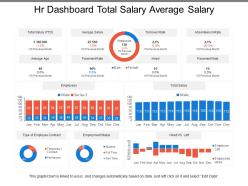
Presenting this set of slides with name - Hr Dashboard Total Salary Average Salary. This is a three stage process. The stages in this process are Hr Dashboard, Human Resource Dashboard, Hr Kpi.
-
 Project Status Summary Dashboard With Time And Resource Allocation
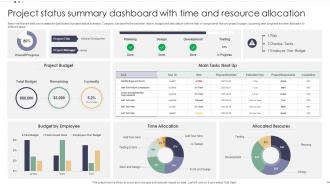
Below mentioned slide showcases the dashboard of project status summary. Company can identify the potential risks in budget and task status with the help of components that are project budget, upcoming task progress and time allocation to different tasks. Introducing our Project Status Summary Dashboard With Time And Resource Allocation set of slides. The topics discussed in these slides are Project Budget, Allocated Resoures, Time Allocation. This is an immediately available PowerPoint presentation that can be conveniently customized. Download it and convince your audience.
-
 Investor update newsletter powerpoint presentation slides
PowerPoint design contains pre-built 60 slides. Instant and risk-free downloading process. Customize presentation background to match specific needs. PPT template goes well with Google Slides. PowerPoint slides are accessible in both widescreen and standard formats. The stages in this process are product team, business model canvas, investment deals, investor scorecard, diversified global portfolio.
-
 Online banking powerpoint presentation slides
Introducing Online Banking PowerPoint Presentation Slides. Get access to 61 professionally designed slides by downloading this PPT complete deck. All the templates feature 100% customizability. You can make the required changes to all the design elements including, font, text, background, colors, and patterns. It is very easy to convert the PPT format into JPG, PDF, and PNG. You can even view this PowerPoint presentation on Google Slides. Owing to advanced accessibility features, this PPT slideshow works well on widescreen and standard resolutions.
-
 Most commonly used stock pitch deck powerpoint presentation ppt slide template
Our Most Commonly Used Stock Pitch Deck Powerpoint Presentation Ppt Slide Template is the perfect way to pitch your stock. We have researched thousands of stock pitches and designed the most impactful way to convince your investors to invest in your equity.
-
 70284488 style essentials 2 financials 5 piece powerpoint presentation diagram infographic slide
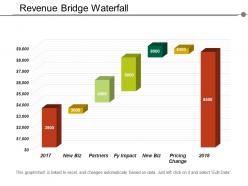
Presenting the waterfall presentation template for PowerPoint. This PPT template is fully modifiable and is professionally designed. You can personalize the objects in the slide like font color and font size without any hassle. This PPT slide is 100% compatible with Google Slide and can be saved in JPG or PDF file format easily. Click on the download button below.
-
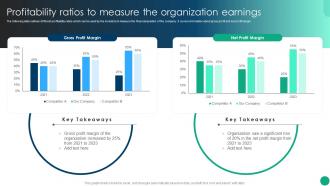 Profitability Ratios To Measure The Organization Financial Planning And Analysis Best Practices
The following slide outlines different profitability ratios which can be used by the investors to measure the financial position of the company. It covers information about gross profit and net profit margin. Deliver an outstanding presentation on the topic using this Forecasting The Revenue And Growth Of Organization Financial Planning And Analysis Best Practices. Dispense information and present a thorough explanation of Profitability Ratios To Measure, The Organization Earnings using the slides given. This template can be altered and personalized to fit your needs. It is also available for immediate download. So grab it now.
-
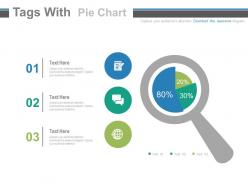 27510320 style essentials 2 financials 3 piece powerpoint presentation diagram infographic slide
Most appropriate for using the presentation slides for comparison purpose. Use of magnifier make the content appears specifically. Constructive for the users like business and finance professionals. Unique icons have been used for the purpose of making the content attractive. Prepared by professional experts keeping in mind feature of creativity. Crafted with crucial graphics and noticeable diagrams. Fitted with innovative images scheming three tags slides.
-
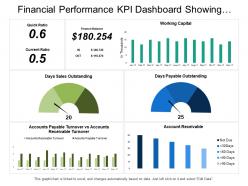 47966171 style essentials 2 dashboard 3 piece powerpoint presentation diagram infographic slide
Presenting this set of slides with name - Financial Performance Kpi Dashboard Showing Quick Ratio Current Ratio Working Capital. This is a three stage process. The stages in this process are Financial Performance, Financial Report, Financial Review.
-
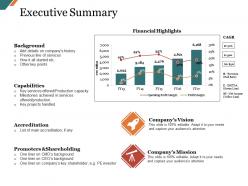 12440009 style essentials 2 financials 2 piece powerpoint presentation diagram infographic slide
Presenting this set of slides with name - Executive Summary Ppt Slide. This is a two stage process. The stages in this process are Background, Capabilities, Accreditation, Promoters And Shareholding, Company Vision.
-
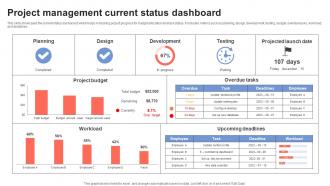 Project Management Current Status Dashboard
This slide showcases the current status dashboard, which helps in tracking project progress for budget allocation and task status. It includes metrics such as planning, design, development, testing, budget, overdue tasks, workload, and deadlines. Presenting our well structured Project Management Current Status Dashboard The topics discussed in this slide are Planning, Design, Development This is an instantly available PowerPoint presentation that can be edited conveniently. Download it right away and captivate your audience.
-
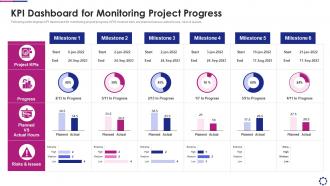 Kpi dashboard for monitoring project progress introducing devops pipeline within software
Following slide displays KPI dashboard for monitoring project progress. KPIS covered here are planned versus actual hours, risks and issues. Present the topic in a bit more detail with this KPI Dashboard For Monitoring Project Progress Introducing Devops Pipeline Within Software. Use it as a tool for discussion and navigation on KPI Dashboard For Monitoring Project Progress. This template is free to edit as deemed fit for your organization. Therefore download it now.
-
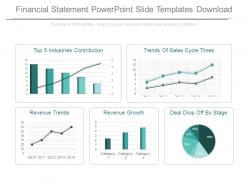 44966581 style essentials 2 financials 5 piece powerpoint presentation diagram infographic slide
Presenting financial statement powerpoint slide templates download. This is a financial statement powerpoint slide templates download. This is a five stage process. The stages in this process are top 5 industries contribution, trends of sales cycle times, revenue trends, revenue growth, deal drop off by stage.
-
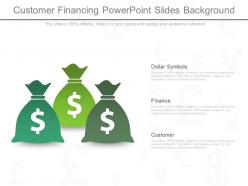 8807472 style essentials 2 financials 3 piece powerpoint presentation diagram infographic slide
Widescreen output without the problem of pixilation. Thoroughly editable content. Modify the colors, orientation and font as per preference. Add company name and logo for maximum personalization. Comfort of incorporation or exclusion of details in slide background. Ease of download and compatibility with varied software. Significantly useful PowerPoint slide design for all those in the field of loan management, retail management, organizational development, communication and sales. The stages in this process are dollar symbols, finance, customer.
-
 12592497 style essentials 2 financials 5 piece powerpoint presentation diagram infographic slide
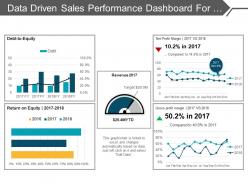
Presenting a PPT slide named Data driven sales performance dashboard for achieving sales target PPT slides. This PPT slide is Excel driven and easily customizable. The font style, the font color and the font size can be easily edited by a mere click. Access this presentation easily anywhere as it is compatible with Google slides. You can convert and save this slide in PDF or JPG formats. Add or delete content from the given slide as per your convenience. You can add icons to make it more impressive. You can choose from thousands of high quality icons. Download and enjoy the professionally designed PPT slide.
-
 Procurement kpi dashboard dashboards by function
Present the topic in a bit more detail with this Procurement Kpi Dashboard Dashboards By Function. Use it as a tool for discussion and navigation on Procurement Kpi Dashboard. This template is free to edit as deemed fit for your organization. Therefore download it now.
-
 Project Management Weekly Status Report Dashboard
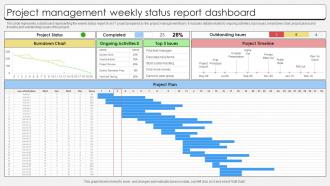
This slide represents a dashboard representing the weekly status report of an IT project prepared by the project management team. It includes details related to ongoing activities, top issues, breakdown chart, project plana and timeline and outstanding issues of the project. Presenting our well structured Project Management Weekly Status Report Dashboard. The topics discussed in this slide are Project Management, Weekly Status, Report Dashboard. This is an instantly available PowerPoint presentation that can be edited conveniently. Download it right away and captivate your audience.
-
 Project Activity Real Time Update And Monitoring
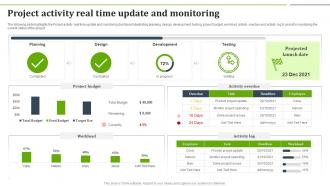
The following slide highlights the Project activity real time update and monitoring dashboard illustrating planning, design, development, testing, project budget, workload, activity overdue and activity log to assist in monitoring the current status of the project. Introducing our Project Activity Real Time Update And Monitoring set of slides. The topics discussed in these slides are Planning, Design, Development, Testing. This is an immediately available PowerPoint presentation that can be conveniently customized. Download it and convince your audience.
-
 Risk Management Commercial Development Project Construction Project Monitoring Time Delivery
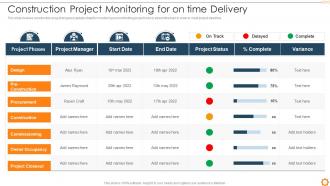
This slide involves construction project progress update sheet for monitoring and controlling project risks to streamline task in order to meet project deadline. Deliver an outstanding presentation on the topic using this Risk Management Commercial Development Project Construction Project Monitoring Time Delivery. Dispense information and present a thorough explanation of Construction, Commissioning, Owner Occupancy using the slides given. This template can be altered and personalized to fit your needs. It is also available for immediate download. So grab it now.
-
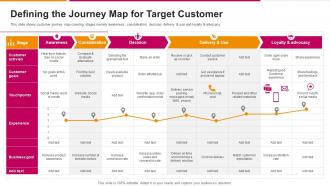 Defining The Journey Map For Target Customer Successful Sales Strategy To Launch
This slide shows customer journey map covering stages namely awareness, consideration, decision, delivery and use and loyalty and advocacy. Present the topic in a bit more detail with this Defining The Journey Map For Target Customer Successful Sales Strategy To Launch. Use it as a tool for discussion and navigation on Defining The Journey Map For Target Customer. This template is free to edit as deemed fit for your organization. Therefore download it now.
-
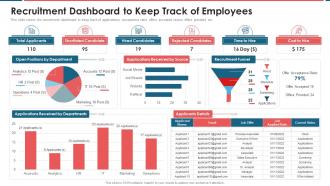 Recruitment Marketing Recruitment Dashboard To Keep Track Of Employees
This slide covers the recruitment dashboard to keep track of applications, acceptance ratio, offers accepted versus offers provided etc. Deliver an outstanding presentation on the topic using this Recruitment Marketing Recruitment Dashboard To Keep Track Of Employees. Dispense information and present a thorough explanation of Recruitment, Dashboard, Applications using the slides given. This template can be altered and personalized to fit your needs. It is also available for immediate download. So grab it now.
-
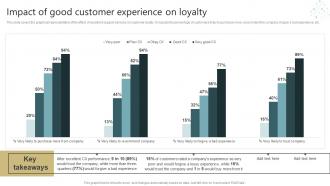 Conducting Successful Customer Impact Of Good Customer Experience On Loyalty
This slide covers the graphical representation of the effect of excellent support services on customer loyalty. It impacts the percentage of customers likely to purchase more, recommend the company, forgive a bad experience, etc. Present the topic in a bit more detail with this Conducting Successful Customer Impact Of Good Customer Experience On Loyalty. Use it as a tool for discussion and navigation on Performance, Experience. This template is free to edit as deemed fit for your organization. Therefore download it now.
-
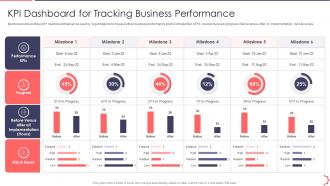 Kpi Dashboard For Tracking Business AI Playbook Accelerate Digital Transformation
Mentioned slide portrays KPI dashboard that can be used by organizations to measure their business performance post AI introduction. KPIS covered here are progress, Before versus After AI Implementation, risks and issues. Present the topic in a bit more detail with this Kpi Dashboard For Tracking Business AI Playbook Accelerate Digital Transformation . Use it as a tool for discussion and navigation on KPI Dashboard For Tracking Business Performance . This template is free to edit as deemed fit for your organization. Therefore download it now.
-
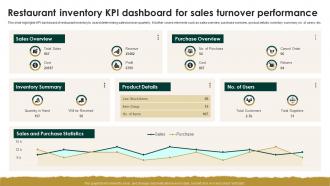 Restaurant Inventory KPI Dashboard For Sales Turnover Performance
This slide highlights KPI dashboard of restaurant inventory to assist determining sales turnover quarterly. It further covers elements such as sales overview, purchase overview, product details, inventory summary, no. of users, etc. Introducing our Restaurant Inventory KPI Dashboard For Sales Turnover Performance set of slides. The topics discussed in these slides are Inventory Summary, Sales Overview, Purchase Overview. This is an immediately available PowerPoint presentation that can be conveniently customized. Download it and convince your audience.
-
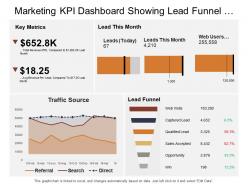 46346874 style essentials 2 financials 3 piece powerpoint presentation diagram infographic slide
Presenting this set of slides with name - Marketing Kpi Dashboard Snapshot Showing Lead Funnel Traffic Sources Key Metrics. This is a three stage process. The stages in this process are Marketing, Branding, Promoting.
-
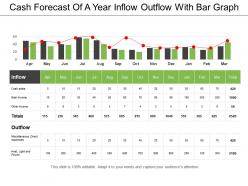 8479765 style essentials 2 financials 2 piece powerpoint presentation diagram infographic slide
Presenting cash forecast of a year inflow outflow with bar graph. This is a cash forecast of a year inflow outflow with bar graph. This is a two stage process. The stages in this process are cash forecast, cash flow, money forecast, fund forecast.


