All Business Slides Financials Powerpoint Diagram Slide
-
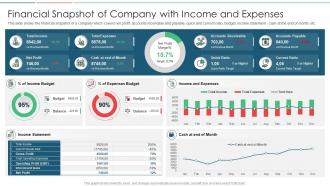 Financial snapshot of company with income and expenses
Presenting our well structured Financial Snapshot Of Company With Income And Expenses. The topics discussed in this slide are Income Budget, Expenses Budget, Income And Expenses. This is an instantly available PowerPoint presentation that can be edited conveniently. Download it right away and captivate your audience.
-
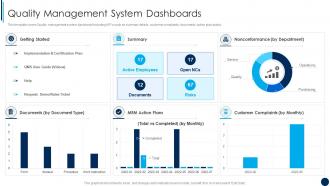 Quality Management System Dashboards ISO 9001 Quality Management Ppt Themes
This template covers Quality management system dashboard including KPIs such as summary details, customer complaints, documents, action plan status. Deliver an outstanding presentation on the topic using this Quality Management System Dashboards ISO 9001 Quality Management Ppt Themes. Dispense information and present a thorough explanation of Quality Management System Dashboards using the slides given. This template can be altered and personalized to fit your needs. It is also available for immediate download. So grab it now.
-
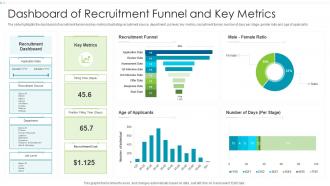 Dashboard Snapshot Of Recruitment Funnel And Key Metrics
The slide highlights the dashboard snapshot of recruitment funnel and key metrics illustrating recruitment source, department, job level, key metrics, recruitment funnel, number of days per stage, gender ratio and age of applicants. Presenting our well structured Dashboard Of Recruitment Funnel And Key Metrics. The topics discussed in this slide are Recruitment Funnel, Male Female Ratio, Recruitment Dashboard. This is an instantly available PowerPoint presentation that can be edited conveniently. Download it right away and captivate your audience.
-
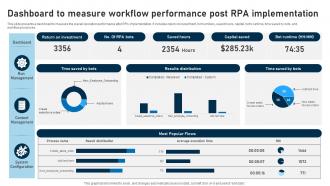 RPA Adoption Strategy Dashboard To Measure Workflow Performance Post RPA Implementation
The mentioned slide showcases the data and information sources required to execute automation and understand consumer behaviour.It includes internal and external sources, social media platforms, geographical factors to track data for implementing automation. Deliver an outstanding presentation on the topic using this RPA Adoption Strategy Dashboard To Measure Workflow Performance Post RPA Implementation Dispense information and present a thorough explanation of Measure Workflow, Performance Post using the slides given. This template can be altered and personalized to fit your needs. It is also available for immediate download. So grab it now.
-
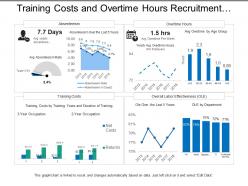 90454204 style essentials 2 financials 4 piece powerpoint presentation diagram infographic slide
Presenting this set of slides with name - Training Costs And Overtime Hours Recruitment Dashboard. This is a four stage process. The stages in this process are Staffing Plan, Recruitment, Staff Management.
-
 Revenue projection powerpoint presentation slides
Presenting this set of slides with name - Revenue Projection Powerpoint Presentation Slides. This deck consists of total of twenty slides. It has PPT slides highlighting important topics of Revenue Projection Powerpoint Presentation Slides. This deck comprises of amazing visuals with thoroughly researched content. The best part is that these templates are easily customizable. Download PowerPoint templates in both widescreen and standard screen. The presentation is fully supported by Google Slides. It can be easily converted into JPG or PDF format.
-
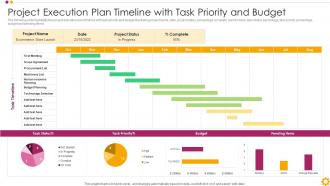 Project Execution Plan Timeline With Task Priority And Budget
The following slide highlights the project execution plan timeline with task priority and budget illustrating project name, date, project status, percentage complete, task timeline, task status percentage, task priority percentage, budget and pending items. Introducing our Project Execution Plan Timeline With Task Priority And Budget set of slides. The topics discussed in these slides are Human Resource Planning, Technology Selection, Machinery List. This is an immediately available PowerPoint presentation that can be conveniently customized. Download it and convince your audience.
-
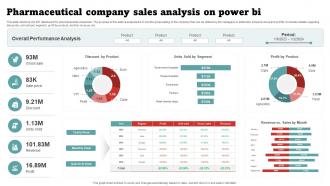 Pharmaceutical Company Sales Analysis On Power BI
This slide mentions the KPI dashboard for pharmaceutical companies. The purpose of this slide is analysis the 6 months gross selling of the company that can be utilized by the managers to determine actual revenue and profits. It includes details regarding discounts, unit sold per segment, profit by product, monthly revenue, etc.Presenting our well structured Pharmaceutical Company Sales Analysis On Power BI. The topics discussed in this slide are Discount Product, Overall Performance Analysis, Profit Product. This is an instantly available PowerPoint presentation that can be edited conveniently. Download it right away and captivate your audience.
-
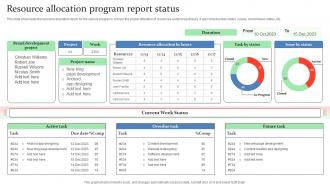 Resource Allocation Program Report Status
This slide showcases the resource allocation report for the various programs to track the proper utilization of resources under project tasks. It also inlcudes task status, issues, current week status, etc. Introducing our Resource Allocation Program Report Status set of slides. The topics discussed in these slides are Brand Development Project, Current Week Status. This is an immediately available PowerPoint presentation that can be conveniently customized. Download it and convince your audience.
-
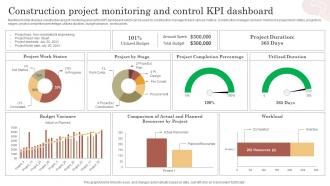 Construction Project Monitoring And Control Kpi Dashboard
Mentioned slide displays construction project monitoring and control KPI dashboard which can be used by construction manager to track various metrics. Construction manager can track metrics like project work status, projects by stages, project completion percentage, utilized duration, budget variance , workload etc. Introducing our Construction Project Monitoring And Control Kpi Dashboard set of slides. The topics discussed in these slides are Project Completion Percentage, Budget Variance, Project Work Status. This is an immediately available PowerPoint presentation that can be conveniently customized. Download it and convince your audience.
-
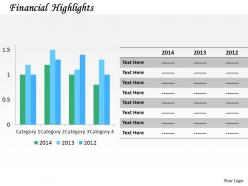 94847653 style essentials 2 financials 1 piece powerpoint presentation diagram infographic slide
Deploy slides in all compatible software evenly. Hassle-free download and usage of slide. Company logo, trademark or name can be inserted for extra customization. PowerPoint graphics do not pixelate upon projection on widescreen. All slides compatible with google slides for more online reach. Highly customized layout including font, text, color and design. Include titles and sub titles with zero space constraints.
-
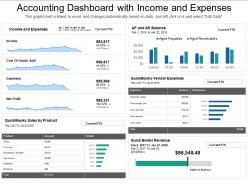 55369360 style essentials 2 financials 5 piece powerpoint presentation diagram infographic slide
Presenting accounting dashboard with income and expenses PPT slideshow. Loaded with incomparable benefits. Readymade PPT graphic helps in saving time and effort. Can be personalized by adding company trademark, logo, brand and symbols. Can be utilized for displaying both simple and complex information. Include or exclude slide content as per your individual need. Colors and text can be easily changed as the PPT slide is completely editable. Useful for every business leader and professional, project management team, business analysts, etc.
-
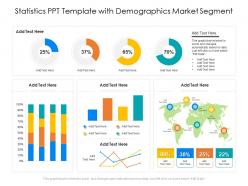 Statistics ppt template with demographics market segment
Presenting this set of slides with name Statistics PPT Template With Demographics Market Segment. The topics discussed in these slide is Statistics PPT Template With Demographics Market Segment. This is a completely editable PowerPoint presentation and is available for immediate download. Download now and impress your audience.
-
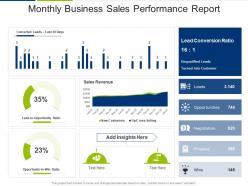 Monthly business sales performance report
Presenting our well structured Monthly Business Sales Performance Report. The topics discussed in this slide are lead opportunity ratio, sales revenue, lead conversion ratio. This is an instantly available PowerPoint presentation that can be edited conveniently. Download it right away and captivate your audience.
-
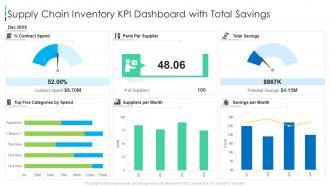 Supply chain inventory kpi dashboard with total savings
Presenting our well-structured Supply Chain Inventory KPI Dashboard With Total Savings. The topics discussed in this slide are Supply Chain Inventory KPI Dashboard With Total Savings. This is an instantly available PowerPoint presentation that can be edited conveniently. Download it right away and captivate your audience.
-
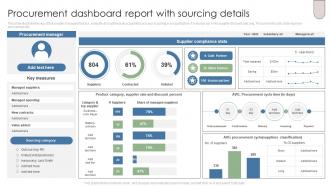 Procurement Dashboard Report With Sourcing Details
This slide illustrate the report that enable managers to track, evaluate and optimize all acquisition process occurring in a organization. It includes kpis like supplier discount rate, avg. Procurement cycle, total expense and savings etc. Introducing our Procurement Dashboard Report With Sourcing Details set of slides. The topics discussed in these slides are Procurement Manager, Sourcing Category, Supplier Compliance Stats. This is an immediately available PowerPoint presentation that can be conveniently customized. Download it and convince your audience.
-
 82990464 style essentials 2 financials 1 piece powerpoint presentation diagram infographic slide
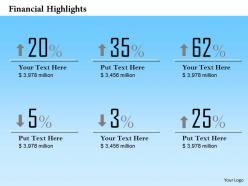
High resolution visuals. Splendid picture quality. No fear of image pixilation when projected on wide screen. Compatible with multiple number of software options like JPEG, JPG and PDF. Compatible with numerous software options available both online and offline. Ease of download. Ease of customization. Thoroughly editable slide design background. Freedom to personalize the slide content with company specific name, logo and trademark.
-
 97313982 style essentials 1 agenda 5 piece powerpoint presentation diagram infographic slide
Presenting Price List Icon template. The layout is designed according to your specific needs. It is customizable in PowerPoint and other office suites. Alter the font type, font size, colors of the diagram, etc. according to the requirements. The diagram is compatible with Google Slides and can be saved in multiple images and document formats such as JPG or PDF. High-quality images and icons ensure that distortion is prevented at any cost.
-
 Monthly revenue performance measure dashboard
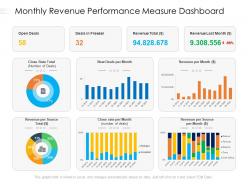
Presenting this set of slides with name Monthly Revenue Performance Measure Dashboard. The topics discussed in these slides are Revenue, Source, Deals. This is a completely editable PowerPoint presentation and is available for immediate download. Download now and impress your audience.
-
 Project Product Management Playbook Project Management Dashboard
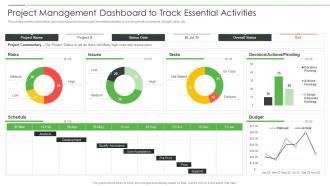
This slide provides information about dashboard to track project essential activities by tracking project schedule, budget, risks, etc. Deliver an outstanding presentation on the topic using this Project Product Management Playbook Project Management Dashboard. Dispense information and present a thorough explanation of Project Management Dashboard To Track Essential Activities using the slides given. This template can be altered and personalized to fit your needs. It is also available for immediate download. So grab it now.
-
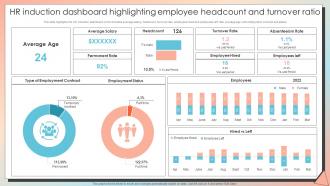 New Employee Induction HR Induction Dashboard Highlighting Employee
This slide highlights the HR induction dashboard which includes average salary, headcount, turnover rate, employees hired and employees left rate, average age with employment contract and status.Present the topic in a bit more detail with this New Employee Induction HR Induction Dashboard Highlighting Employee. Use it as a tool for discussion and navigation on Permanent Rate, Absenteeism Rate, Turnover Rate. This template is free to edit as deemed fit for your organization. Therefore download it now.
-
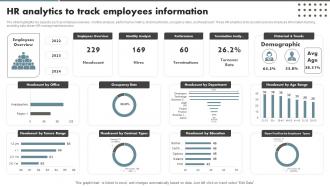 HR Analytics To Track Employees Information
The slide highlights key aspects such as employee overview, monthly analysis, performance metrics, historical trends, occupancy rates, and headcount. These HR analytics tools assist in precise employee information tracking, enabling data driven HR management decisions. Introducing our HR Analytics To Track Employees Information set of slides. The topics discussed in these slides are Headcount By Office, Headcount By Tenure Range, Headcount By Department. This is an immediately available PowerPoint presentation that can be conveniently customized. Download it and convince your audience.
-
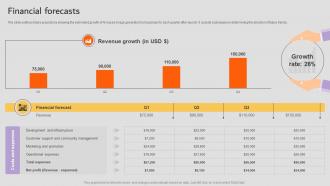 Financial Forecasts AI Startup Go To Market Strategy GTM SS
The slide outlines future projections showing the estimated growth of AI-based image generator tool business for each quarter after launch. It assists businesses in determining the direction of future trends. Deliver an outstanding presentation on the topic using this Financial Forecasts AI Startup Go To Market Strategy GTM SS. Dispense information and present a thorough explanation of Financial Forecasts using the slides given. This template can be altered and personalized to fit your needs. It is also available for immediate download. So grab it now.
-
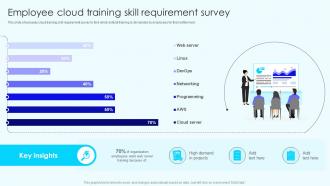 Employee Cloud Training Skill Development Cloud Training Program For Employees DTE SS
This slide showcases cloud training skill requirement survey to find which skillset training is demanded by employees for their betterment. Deliver an outstanding presentation on the topic using this Employee Cloud Training Skill Development Cloud Training Program For Employees DTE SS. Dispense information and present a thorough explanation of Key Insights, Projects, Organization using the slides given. This template can be altered and personalized to fit your needs. It is also available for immediate download. So grab it now.
-
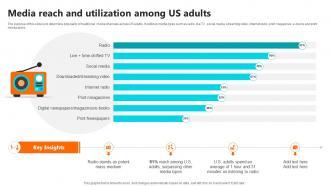 Media Reach And Utilization Among Setting Up An Own Internet Radio Station
The purpose of this slide is to determine popularity of traditional media channels across US adults. It outlines media types such as radio, live TV, social media, streaming video, internet radio, print magazines, e-books and print newspapers. Present the topic in a bit more detail with this Media Reach And Utilization Among Setting Up An Own Internet Radio Station. Use it as a tool for discussion and navigation on Mass Medium, Radio Stands, Media Reach. This template is free to edit as deemed fit for your organization. Therefore download it now.
-
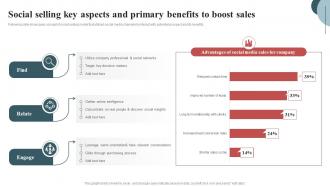 Social Selling Key Aspects And Inside Sales Techniques To Connect With Customers SA SS
Following slide showcases concept of social selling model that utilized social media channels to interact with potential prospect and its benefits. Present the topic in a bit more detail with this Social Selling Key Aspects And Inside Sales Techniques To Connect With Customers SA SS. Use it as a tool for discussion and navigation on Social Networks, Social Insights, Purchasing Process. This template is free to edit as deemed fit for your organization. Therefore download it now.
-
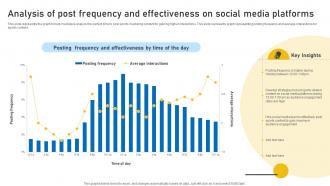 Analysis Of Post Frequency And Effectiveness Sports Event Marketing Plan Strategy SS V
This slide represents the graph to help marketers analyze the perfect time to post sports marketing content for gaining higher interactions. This slide represents graph representing posting frequency and average interactions for sports content. Deliver an outstanding presentation on the topic using this Analysis Of Post Frequency And Effectiveness Sports Event Marketing Plan Strategy SS V. Dispense information and present a thorough explanation of Posting Frequency, Key Insights, Audience Engagement using the slides given. This template can be altered and personalized to fit your needs. It is also available for immediate download. So grab it now.
-
 Marketing Management Planning For Financial Services Icon
Introducing our premium set of slides with Marketing Management Planning For Financial Services Icon. Ellicudate the three stages and present information using this PPT slide. This is a completely adaptable PowerPoint template design that can be used to interpret topics like Marketing Management Planning, Financial Services Icon.So download instantly and tailor it with your information.
-
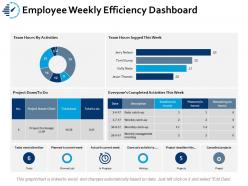 3616780 style essentials 2 financials 2 piece powerpoint presentation diagram infographic slide
Presenting this set of slides with name - Employee Weekly Efficiency Dashboard Snapshot Ppt Portfolio Brochure. This is a two stage process. The stages in this process are Business, Management, Strategy, Sales, Marketing.
-
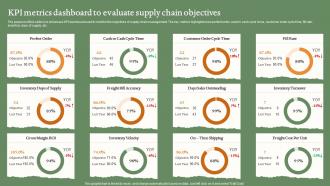 KPI Metrics Dashboard To Evaluate Supply Chain Objectives
The purpose of this slide is to showcase KPI dashboard used to monitor the objectives of supply chain management. The key metrics highlighted are perfect order, cash to cash cycle tome, customer order cycle time, fill rate, inventory days of supply, etc. Introducing our KPI Metrics Dashboard To Evaluate Supply Chain Objectives set of slides. The topics discussed in these slides are KPI Metrics Dashboard, Evaluate, Supply Chain Objectives. This is an immediately available PowerPoint presentation that can be conveniently customized. Download it and convince your audience.
-
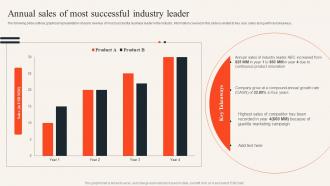 Annual Sales Of Most Successful Industry Leader Uncovering Consumer Trends Through Market Research Mkt Ss
The following slide outlines graphical representation of yearly revenue of most successful business leader in the industry. Information covered in this slide is related to four year sales along with key takeaways. Deliver an outstanding presentation on the topic using this Annual Sales Of Most Successful Industry Leader Uncovering Consumer Trends Through Market Research Mkt Ss. Dispense information and present a thorough explanation of Successful, Product, Innovation using the slides given. This template can be altered and personalized to fit your needs. It is also available for immediate download. So grab it now.
-
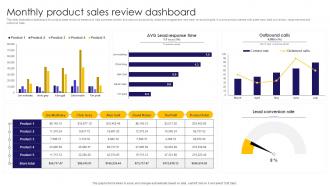 Monthly Product Sales Review Dashboard
This slide illustrates a dashboard for product sales review to measure to help business monitor and improve productivity, employee engagement and meet revenue targets. It covers product names with sales reps, lead conversion, response time and outbound calls. Presenting our well structured Monthly Product Sales Review Dashboard. The topics discussed in this slide are AVG Lead Response, Time, Outbound Calls, Lead Conversion Rate. This is an instantly available PowerPoint presentation that can be edited conveniently. Download it right away and captivate your audience.
-
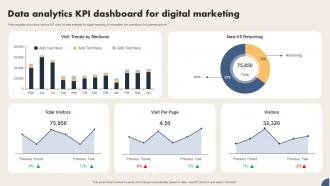 Data Analytics Kpi Dashboard For Digital Marketing
Following slide shows the various KPI used for data analysis for digital marketing to streamline the operations for business growth Introducing our Data Analytics Kpi Dashboard For Digital Marketing set of slides. The topics discussed in these slides are Visit Trends By Mediums, New Vs Returning This is an immediately available PowerPoint presentation that can be conveniently customized. Download it and convince your audience.
-
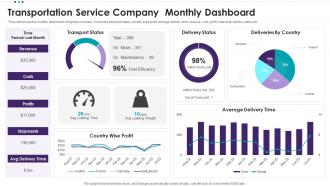 Transportation Service Company Monthly Dashboard
This slide shows the monthly dashboard of logistics company. It includes transport status, country wise profit, average delivery time, revenue, cost, profit, shipment, delivery status etc. Presenting our well structured Transportation Service Company Monthly Dashboard. The topics discussed in this slide are Transport Status, Delivery Status, Deliveries By Country, Average Delivery Time, Country Wise Profit. This is an instantly available PowerPoint presentation that can be edited conveniently. Download it right away and captivate your audience.
-
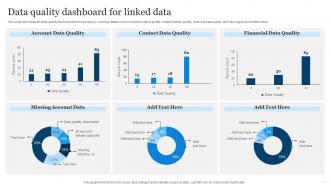 Linked Open Data Data Quality Dashboard For Linked Data Ppt Powerpoint Presentation Slides Tips
This slide describes the data quality dashboard for linked data by covering details of account information quality, contact details quality, financial data quality, and missing account information. Present the topic in a bit more detail with this Linked Open Data Data Quality Dashboard For Linked Data Ppt Powerpoint Presentation Slides Tips. Use it as a tool for discussion and navigation on Account Data Quality, Contact Data Quality, Financial Data Quality. This template is free to edit as deemed fit for your organization. Therefore download it now.
-
 Investment audit powerpoint presentation slides
Presenting investment audit presentation slides. This deck comprises of total of 76 slides. Each template consists of professional visuals with an appropriate content. These PPT slides have been designed keeping the customers requirement in mind. This complete presentation covers all the design elements such as layout, diagrams, icons, and more. This presentation deck has been crafted after an extensive research. You can easily edit each template. Customize colour, text, icon, and font size as per your requirement. Easy to download. Compatible with all screen types and monitors. Supports Google Slides. Premium Customer Support available.
-
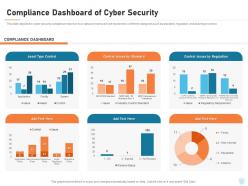 Cyber security it compliance dashboard of cyber security ppt powerpoint show gallery
This slide depicts the cyber security compliance report on how data and hardware are monitored in different categories such as standard, regulation, and asset type control. Deliver an outstanding presentation on the topic using this Cyber Security IT Compliance Dashboard Snapshot Of Cyber Security Ppt Powerpoint Show Gallery. Dispense information and present a thorough explanation of Asset Type Control, Control Issues By Standard, Control Issues By Regulation using the slides given. This template can be altered and personalized to fit your needs. It is also available for immediate download. So grab it now.
-
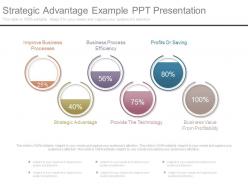 33208426 style essentials 2 financials 6 piece powerpoint presentation diagram infographic slide
Fast and simple to download without any hassles. Absolutely editable text boxes as per your need. Fully modifiable PPT images- alter the color scheme and contrast to your liking. Change the orientation and size of PPT icons as per requirement. No change in original resolution of PPT infographics after editing any number of times.The stages in this process are improve business processes, business process efficiency, profits or saving, strategic advantage, provide the technology, business value from profitability.
-
 15889594 style variety 2 currency 1 piece powerpoint presentation diagram infographic slide
Presenting Money Bag In Hand Cost Structure Icon template. . This is a completely customizable template that works on your command. You can freely alter the colors, the font type, and the font size as per your needs. It is made up of high-resolution graphics that do not infer the quality when you view it on a widescreen. You can convert this and save it in many formats. This is adaptable with Google Slides as well and can be downloaded on both the screen i.e. standard screen as well as widescreen.
-
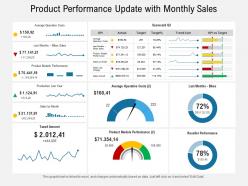 Product performance update with monthly sales
Presenting this set of slides with name Product Performance Update With Monthly Sales. The topics discussed in these slides are Costs, Sales, Performance. This is a completely editable PowerPoint presentation and is available for immediate download. Download now and impress your audience.
-
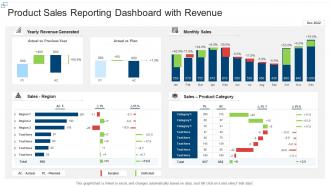 Product sales reporting dashboard with revenue
Presenting our well structured Product Sales Reporting Dashboard Snapshot With Revenue. The topics discussed in this slide are Revenue, Plan, Sales. This is an instantly available PowerPoint presentation that can be edited conveniently. Download it right away and captivate your audience.
-
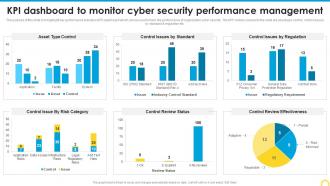 KPI Dashboard To Monitor Cyber Building A Security Awareness Program
The purpose of this slide is to highlight key performance indicator KPI dashboard which can be used to track the performance of organization cyber security. The KPI metrics covered in the slide are asset type control, control issues by standard and regulation etc. Deliver an outstanding presentation on the topic using this KPI Dashboard To Monitor Cyber Building A Security Awareness Program. Dispense information and present a thorough explanation of Control Review Effectiveness, Performance Management using the slides given. This template can be altered and personalized to fit your needs. It is also available for immediate download. So grab it now.
-
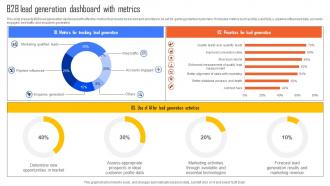 B2B Lead Generation Dashboard With Metrics
This slide presents B2B lead generation dashboard with effective metrics that should be tracked and priorities to be set for gaining potential customers. It includes metrics such as MQLs and SQLs, pipeline influenced data, accounts engaged, web traffic and enquiries generated. Introducing our B2B Lead Generation Dashboard With Metrics set of slides. The topics discussed in these slides are Metrics For Tracking, Lead Generation, Priorities For Lead Generation. This is an immediately available PowerPoint presentation that can be conveniently customized. Download it and convince your audience.
-
 Cash management techniques measurement accounting cashflow
It has PPT slides covering wide range of topics showcasing all the core areas of your business needs. This complete deck focuses on Cash Management Techniques Measurement Accounting Cashflow and consists of professionally designed templates with suitable graphics and appropriate content. This deck has total of ten slides. Our designers have created customizable templates for your convenience. You can make the required changes in the templates like colour, text and font size. Other than this, content can be added or deleted from the slide as per the requirement. Get access to this professionally designed complete deck PPT presentation by clicking the download button below.
-
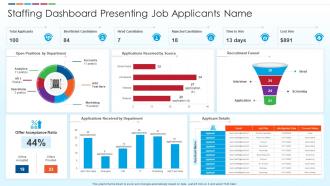 Staffing Dashboard Presenting Job Applicants Name
Introducing our Staffing Dashboard Presenting Job Applicants Name set of slides. The topics discussed in these slides are Recruitment Funnel, Source, Applications. This is an immediately available PowerPoint presentation that can be conveniently customized. Download it and convince your audience.
-
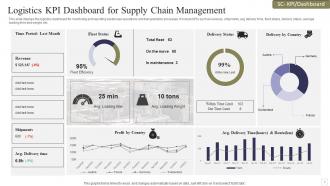 Logistics KPI Dashboard For Supply Chain Management
This slide displays the logistics dashboard for monitoring and reporting warehouse operations and transportation processes. It include KPIs such as revenue, shipments, avg delivery time, fleet status, delivery status, average loading time and weight, etc. Presenting our well structured Logistics KPI Dashboard Snapshot For Supply Chain Management. The topics discussed in this slide are Logistics KPI Dashboard, Supply Chain Management, Revenue. This is an instantly available PowerPoint presentation that can be edited conveniently. Download it right away and captivate your audience.
-
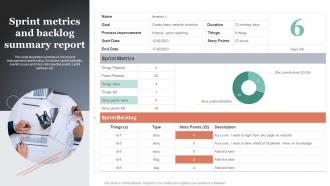 Sprint Metrics And Backlog Summary Report
This slide illustrates summary of Jira project management sprint testing. It includes sprint highlights, overall issues and risks, retrospective points, sprint spillover, etc. Introducing our Sprint Metrics And Backlog Summary Report set of slides. The topics discussed in these slides are Sprint Metrics, Summary Report. This is an immediately available PowerPoint presentation that can be conveniently customized. Download it and convince your audience.
-
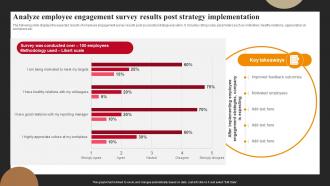 Analyze Employee Engagement Survey Results Post Successful Employee Engagement Action Planning
The following slide displays the expected results of employee engagement survey results post successful strategy execution. It includes rating scale, parameters such as motivation, healthy relations, appreciation at workplace etc. Present the topic in a bit more detail with this Analyze Employee Engagement Survey Results Post Successful Employee Engagement Action Planning. Use it as a tool for discussion and navigation on Strategy, Implementation, Engagement. This template is free to edit as deemed fit for your organization. Therefore download it now.
-
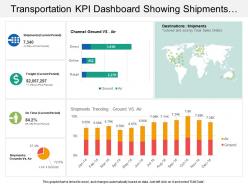 57251757 style essentials 2 financials 3 piece powerpoint presentation diagram infographic slide
Presenting our transportation KPI dashboard snapshot showing shipments ground vs. air channel PPT slide. This layout is compatible with Google slides and data can be updated with excel linked file. This template is Excel linked just right click to input your information. Images do no blur out even when they are projected on large screen.PPT template can be utilized by sales and marketing teams and business managers. Instantly downloadable slide and supports formats like JPEG and PDF.
-
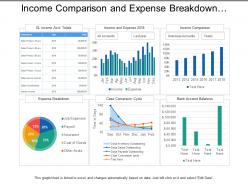 17980133 style division pie 6 piece powerpoint presentation diagram infographic slide
Presenting this set of slides with name - Income Comparison And Expense Breakdown Utilities Dashboard. This is a six stage process. The stages in this process are Utilities, Use, Advantage.
-
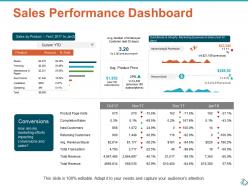 77086015 style essentials 2 financials 4 piece powerpoint presentation diagram infographic slide
Presenting this set of slides with name - Sales Performance Dashboard Ppt Show Infographic Template. This is a four stage process. The stages in this process are Business, Planning, Strategy, Marketing, Management.
-
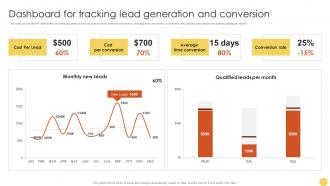 Dashboard For Tracking Lead Advanced Lead Generation Tactics Strategy SS V
This slide covers the KPI dashboard for analyzing metrics such as cost per lead, cost per conversion, average time conversion, conversion rate, monthly new leads, and qualified leads per month. Deliver an outstanding presentation on the topic using this Dashboard For Tracking Lead Advanced Lead Generation Tactics Strategy SS V. Dispense information and present a thorough explanation of Conversion, Average, Conversion using the slides given. This template can be altered and personalized to fit your needs. It is also available for immediate download. So grab it now.
-
 75151883 style essentials 2 financials 4 piece powerpoint presentation diagram infographic slide
Brimming with aesthetic appeal and professional parameters. Uncluttered and intense projection of relevant visuals. Harmonious use of PPT icons, colors, fonts and designs with respect to the subject. Freedom to execute changes in slide background as per individual’s preference. Flexibility to customize it with company specific elements like name, logo and trademark. Compatibility with multiple software and format options. High resolution and stupendous quality visuals. Used by several business strategists, stakeholders, managers, students, financiers, sales professionals and entrepreneurs.
-
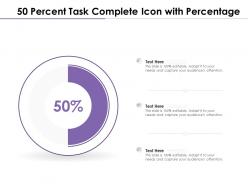 50 percent task complete icon with percentage
Presenting our set of slides with 50 Percent Task Complete Icon With Percentage. This exhibits information on three stages of the process. This is an easy to edit and innovatively designed PowerPoint template. So download immediately and highlight information on 50 Percent Task Complete Icon With Percentage.
-
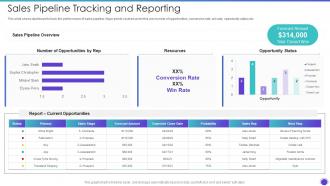 Sales Pipeline Tracking And Reporting Sales Pipeline Management Strategies
This slide shows dashboard to track the performance of sales pipeline. Major points covered under this are number of opportunities, conversion rate, win rate, opportunity status etc. Deliver an outstanding presentation on the topic using this Sales Pipeline Tracking And Reporting Sales Pipeline Management Strategies. Dispense information and present a thorough explanation of Sales Pipeline Overview, Resources, Opportunity using the slides given. This template can be altered and personalized to fit your needs. It is also available for immediate download. So grab it now.
-
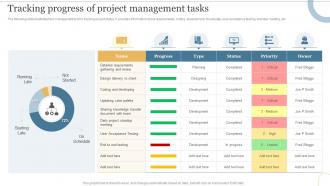 Tracking Progress Of Project Management Tasks Deploying Cloud To Manage
The following slide illustrates task management tool for tracking project status. It provides information about requirements, coding, development, knowledge, user acceptance testing, standup meeting, etc.Deliver an outstanding presentation on the topic using this Tracking Progress Of Project Management Tasks Deploying Cloud To Manage. Dispense information and present a thorough explanation of Detailed Requirements, Acceptance Testing, Development using the slides given. This template can be altered and personalized to fit your needs. It is also available for immediate download. So grab it now.
-
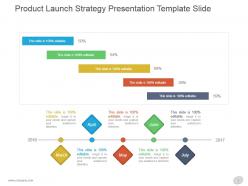 70338286 style essentials 1 roadmap 5 piece powerpoint presentation diagram infographic slide
Presenting product launch strategy presentation template slide. This is a product launch strategy presentation template slide. This is a five stage process. The stages in this process are april, june, march, may, july.
-
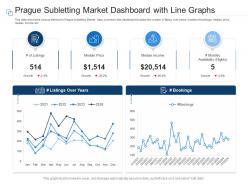 Prague subletting market dashboard with line graphs powerpoint template
This slide shows the various Metrics for Prague Subletting Market. Data covered in this dashboard includes the number of listing over years, number of bookings, median price, median income etc. This is a Prague Subletting Market Dashboard With Line Graphs Powerpoint Template drafted with a diverse set of graphics, that can be reformulated and edited as per your needs and requirements. Just download it in your system and make use of it in PowerPoint or Google Slides, depending upon your presentation preferences.
-
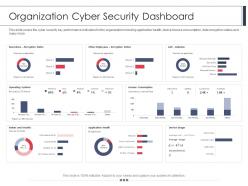 Employee security awareness training program organization cyber security dashboard ppt layout
This slide covers the cyber security key performance indicators for the organization including application health, device license consumption, data encryption status and many more. Deliver an outstanding presentation on the topic using this Employee Security Awareness Training Program Organization Cyber Security Dashboard Ppt Layout. Dispense information and present a thorough explanation of Operating Systems, Makes And Models, Application Health, Device Usage, Average Usage using the slides given. This template can be altered and personalized to fit your needs. It is also available for immediate download. So grab it now.
-
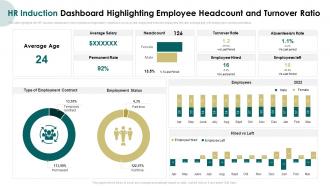 HR Induction Dashboard Highlighting Induction Program For New Employees
This slide highlights the HR induction dashboard which includes average salary, headcount, turnover rate, employees hired and employees left rate, average age with employment contract and status. Present the topic in a bit more detail with this HR Induction Dashboard Highlighting Induction Program For New Employees. Use it as a tool for discussion and navigation on Average Salary, Turnover Rate, Absenteeism Rate. This template is free to edit as deemed fit for your organization. Therefore download it now.


