All Business Slides Financials Powerpoint Diagram Slide
-
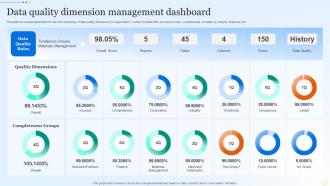 Data Quality Dimension Management Dashboard
This slide showcases dashboard for real time monitoring of data quality dimensions for organization. It further includes KPIs such as accuracy, completeness, consistency, integrity, timeliness, etc. Introducing our Data Quality Dimension Management Dashboard set of slides. The topics discussed in these slides are Data Quality Rules,Timeliness Groups,Materials Management,Quality Dimensions. This is an immediately available PowerPoint presentation that can be conveniently customized. Download it and convince your audience.
-
 6687541 style essentials 2 financials 3 piece powerpoint presentation diagram infographic slide
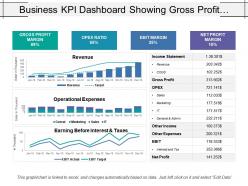
Presenting this set of slides with name - Business Kpi Dashboard Showing Gross Profit Margin Opex Ratio And Ebit Margin. This is a three stage process. The stages in this process are Business Dashboard, Business Kpi, Business Performance.
-
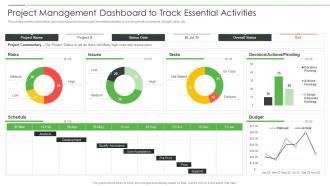 Project Product Management Playbook Project Management Dashboard
This slide provides information about dashboard to track project essential activities by tracking project schedule, budget, risks, etc. Deliver an outstanding presentation on the topic using this Project Product Management Playbook Project Management Dashboard. Dispense information and present a thorough explanation of Project Management Dashboard To Track Essential Activities using the slides given. This template can be altered and personalized to fit your needs. It is also available for immediate download. So grab it now.
-
 73113414 style essentials 2 financials 4 piece powerpoint presentation diagram infographic slide
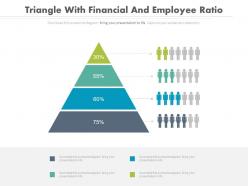
Presenting triangle with financial and employee ratio analysis powerpoint slides. This Power Point template diagram with graphic of triangle and finance icons diagram. This PPT diagram contains the concept of employee ratio analysis. Use this PPT diagram for business and finance related presentations.
-
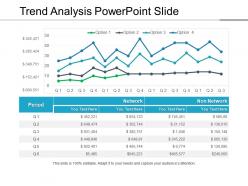 82729957 style essentials 2 financials 4 piece powerpoint presentation diagram infographic slide
Presenting trend analysis PowerPoint template. Access to edit the content, style, size and orientation of the PPT slides. Extremely spacious to cover all the aspects of the company profile. High resolution images do not pixelate when projected on wide screen. Personalize the PPT with your company name and logo. Modify the presentation elements as per the need of an hour. Compatible with numerous software and format options. Used by entrepreneurs, marketers, managerial department, stakeholders and students. Self-explanatory and intellectual slide charts.
-
 Actual vs budget variance powerpoint presentation slides
Our Actual Vs Budget Variance Powerpoint Presentation Slides presentation deck is a helpful tool to plan & prepare the topic with a clear approach. This PPT deck displays twentyone slides with in-depth research. We provide a ready to use deck with all sorts of relevant topics subtopics templates, charts and graphs, overviews, analysis templates. It showcases all kinds of editable templates. Edit the color, text, font style at your ease. Download PowerPoint templates in both widescreen and standard screen. The presentation is fully supported by Google Slides. It can be easily converted into JPG or PDF format.
-
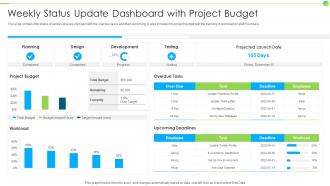 Weekly Status Update Dashboard With Project Budget
This slide contains the status of various phases of project with the overdue tasks and their upcoming. It also includes the project budget with the tracking of workload on staff members. Introducing our Weekly Status Update Dashboard With Project Budget set of slides. The topics discussed in these slides are Planning, Development, Projected Launch Date, Overdue Tasks. This is an immediately available PowerPoint presentation that can be conveniently customized. Download it and convince your audience.
-
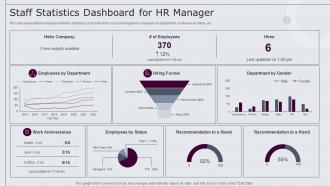 Staff Statistics Dashboard For Hr Manager
This slide represents the employee statistics dashboard. It includes KPIs such as hiring funnel, employees by department, employees by status, etc. Presenting our well structured Staff Statistics Dashboard For Hr Manager. The topics discussed in this slide are Statistics, Dashboard, Department. This is an instantly available PowerPoint presentation that can be edited conveniently. Download it right away and captivate your audience.
-
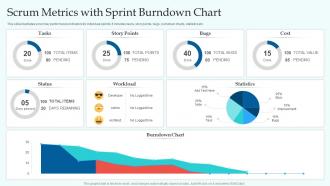 Scrum Metrics With Sprint Burndown Chart
This slide illustrates scrum key performance indicators for individual sprints. It includes tasks, story points, bugs, burndown charts, statistics etc. Presenting our well structured Scrum Metrics With Sprint Burndown Chart. The topics discussed in this slide are Story Points, Statistics, Workload, Burndown Chart. This is an instantly available PowerPoint presentation that can be edited conveniently. Download it right away and captivate your audience.
-
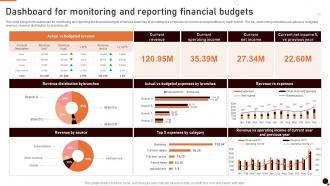 Dashboard For Monitoring And Reporting Financial Budgets
This slide brings forth dashboard for monitoring and reporting the financial budgets of various branches of an enterprise emphasis on income and expenditure by each branch. The key performing indicators are actual vs budgeted revenue, revenue distribution by branches etc. Introducing our Dashboard For Monitoring And Reporting Financial Budgets set of slides. The topics discussed in these slides are Current Revenue, Current Operating Income This is an immediately available PowerPoint presentation that can be conveniently customized. Download it and convince your audience.
-
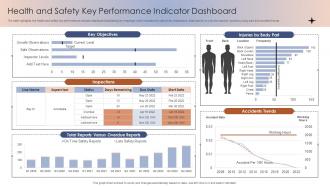 Health And Safety Key Performance Indicator Dashboard
The slide highlights the health and safety key performance indicator dashboard illustrating key headings which includes key objectives, inspections, total reports vs over due reports, injuries by body part and accident trends Introducing our Health And Safety Key Performance Indicator Dashboard set of slides. The topics discussed in these slides are Key Objectives, Inspections, Overdue Reports, Accidents Trends. This is an immediately available PowerPoint presentation that can be conveniently customized. Download it and convince your audience.
-
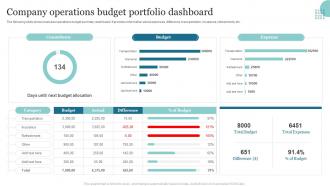 Company Operations Budget Portfolio Dashboard
The following slide shows business operations budget summary dashboard. It provides information about expenses, difference, transportation, insurance, refreshment, etc. Presenting our well structured Company Operations Budget Portfolio Dashboard. The topics discussed in this slide are Transportation, Refreshment, Insurance. This is an instantly available PowerPoint presentation that can be edited conveniently. Download it right away and captivate your audience.
-
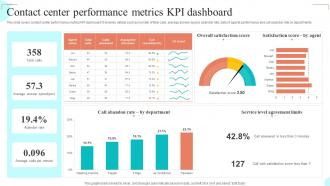 Contact Center Performance Metrics KPI Dashboard
This slide covers contact center performance metrics KPI dashboard. It involves details such as number of total calls, average answer speed, abandon rate, data of agents performance and call abandon rate by departments. Presenting our well structured Contact Center Performance Metrics KPI Dashboard The topics discussed in this slide are Call Abandon Rate, Overall Satisfaction Score, Satisfaction Score This is an instantly available PowerPoint presentation that can be edited conveniently. Download it right away and captivate your audience.
-
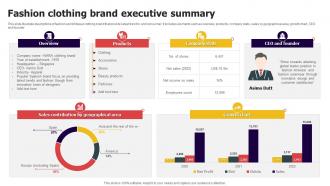 Fashion Clothing Brand Executive Summary
This slide illustrate descriptions of fashion and knitwear clothing brand that provide latest trend to end consumer. It includes elements such as overview, products, company stats, sales by geographical area, growth chart, CEO and founder Presenting our well structured Fashion Clothing Brand Executive Summary. The topics discussed in this slide are Products, Company Stats, Growth Chart. This is an instantly available PowerPoint presentation that can be edited conveniently. Download it right away and captivate your audience.
-
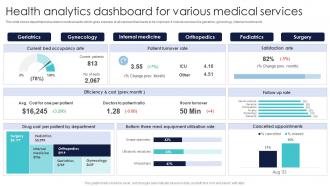 Health Analytics Dashboard For Various Medical Services
This slide shows department wise data in medical sector which gives overview of all services that needs to be improved. It include services like geriatrics, gynecology, internal medicine etc. Presenting our well structured Health Analytics Dashboard For Various Medical Services. The topics discussed in this slide are Geriatrics, Gynecology, Internal Medicine, Orthopedics. This is an instantly available PowerPoint presentation that can be edited conveniently. Download it right away and captivate your audience.
-
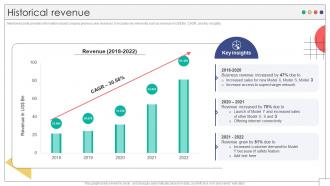 Historical Revenue Electrical Engineering Company Profile CP SS V
Mentioned slide provides information about company previous year revenues. It includes key elements such as revenue in USDoller Bn, CAGR, and key insights. Deliver an outstanding presentation on the topic using this Historical Revenue Electrical Engineering Company Profile CP SS V Dispense information and present a thorough explanation of Revenue, Business Revenue, Supercharger Network using the slides given. This template can be altered and personalized to fit your needs. It is also available for immediate download. So grab it now.
-
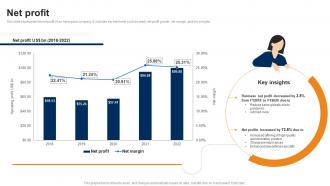 Net Profit Manufacturing Company Profile CP SS
This slide showcases the net profit of an Aerospace company. It includes key elements such as yearly net profit growth, net margin, and key insights. Present the topic in a bit more detail with this Net Profit Manufacturing Company Profile CP SS. Use it as a tool for discussion and navigation on Net Profit. This template is free to edit as deemed fit for your organization. Therefore download it now.
-
 Revenue Split By Geography Vacation Rental Solution Company Profile CP SS V
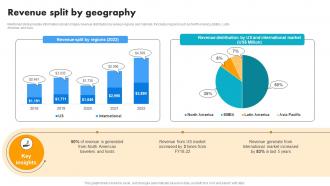
Mentioned slide provides information about company revenue distribution by various regions and markets. It includes regions such as North America, EMEA, Latin America, and Asia. Deliver an outstanding presentation on the topic using this Revenue Split By Geography Vacation Rental Solution Company Profile CP SS V Dispense information and present a thorough explanation of North American Travelers And Hosts, Revenue From US Market using the slides given. This template can be altered and personalized to fit your needs. It is also available for immediate download. So grab it now.
-
 Revenue Streams Data Warehousing Investor Funding Elevator Pitch Deck
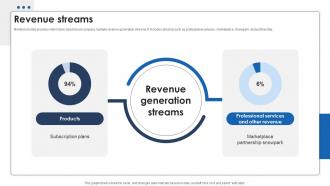
Mentioned slide provides information about cloud company multiple revenue generation streams. It includes streams such as professional services, marketplace, Snowpark, and partnership.Present the topic in a bit more detail with this Revenue Streams Data Warehousing Investor Funding Elevator Pitch Deck. Use it as a tool for discussion and navigation on Revenue Streams This template is free to edit as deemed fit for your organization. Therefore download it now.
-
 Top Asset Tokenization Platforms Polymath Revolutionizing Investments With Asset BCT SS
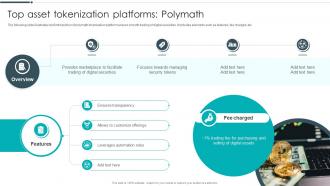
The following slide illustrates brief introduction of polymath tokenization platform ensure smooth trading of digital securities. It includes elements such as features, fee charged, etc. Increase audience engagement and knowledge by dispensing information using Top Asset Tokenization Platforms Polymath Revolutionizing Investments With Asset BCT SS. This template helps you present information on four stages. You can also present information on Ensures Transparency, Allows To Customize Offerings, Leverages Automation Rules using this PPT design. This layout is completely editable so personaize it now to meet your audiences expectations.
-
 Types Of Tokens On The Basis Of Nature Revolutionizing Investments With Asset BCT SS
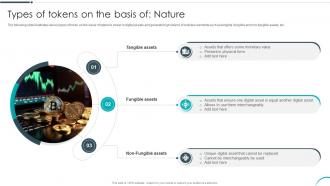
The following slide illustrates various types of token on the basis of nature to invest in digital assets and generate high returns. It includes elements such as tangible, fungible and non-fungible assets, etc. Introducing Types Of Tokens On The Basis Of Nature Revolutionizing Investments With Asset BCT SS to increase your presentation threshold. Encompassed with three stages, this template is a great option to educate and entice your audience. Dispence information on Tangible Assets, Fungible Assets, Non-Fungible Assets, using this template. Grab it now to reap its full benefits.
-
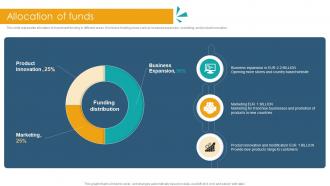 Allocation Of Funds House Accessories Investor Funding Elevator Pitch Deck
This slide represents allocation of investment funding in different areas. It includes funding areas such as business expansion, marketing, and product innovation. Present the topic in a bit more detail with this Allocation Of Funds House Accessories Investor Funding Elevator Pitch Deck. Use it as a tool for discussion and navigation on Product Innovation, Business Expansion, Marketing. This template is free to edit as deemed fit for your organization. Therefore download it now.
-
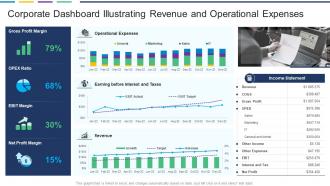 Corporate Dashboard Illustrating Revenue And Operational Expenses
This graph or chart is linked to excel, and changes automatically based on data. Just left click on it and select edit data. Introducing our Corporate Dashboard Illustrating Revenue And Operational Expenses set of slides. The topics discussed in these slides are Gross Profit Margin, PEX Ratio, EBIT Margin, Net Profit Margin. This is an immediately available PowerPoint presentation that can be conveniently customized. Download it and convince your audience.
-
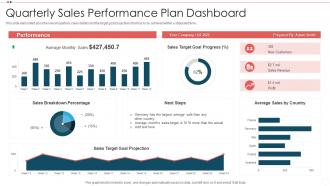 Quarterly Sales Performance Plan Dashboard
This slide elaborated about he overall quarterly sales details and the target goal projections that has to be achieved within a stipulated time. Presenting our well-structured Quarterly Sales Performance Plan Dashboard. The topics discussed in this slide are Sales Target Goal Progress, Sales Breakdown Percentage, Sales Target Goal Projection. This is an instantly available PowerPoint presentation that can be edited conveniently. Download it right away and captivate your audience.
-
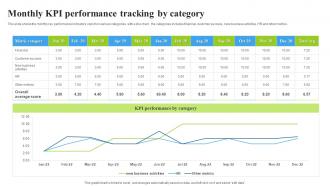 Monthly KPI Performance Tracking By Category
This slide shows the monthly key performance indicators report on various categories with a line chart. the categories includes financial, customer success, new business activities, HR and other metrics. Presenting our well structured Monthly KPI Performance Tracking By Category. The topics discussed in this slide are Performance Category, Tracking Category, Average Score. This is an instantly available PowerPoint presentation that can be edited conveniently. Download it right away and captivate your audience.
-
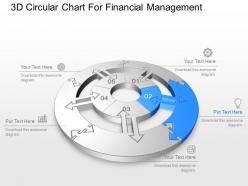 33921298 style circular loop 5 piece powerpoint presentation diagram template slide
Extremely promising and reliable PPT presentation backgrounds. Can be completely tailored by simply following some predefined instructions. Can be utilised by numerous organisations and users to represent their data effectively. Stuffed with top-notch quality patterns and images. Enables easy understanding with their well-organised patterns. Well matched framework with google. Performs error-error free to provide you and the audience outstanding presentation experience.
-
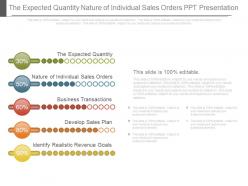 52250883 style essentials 2 financials 5 piece powerpoint presentation diagram infographic slide
Simple and swift to download without unnecessary steps. Fully modifiable color and contrasts of presentation graphics. Change orientation, size and outlines of PPT images to your liking. Undiminished high resolution graphics post editing. Insert company name, logo, brand name, tagline etc. to personalize. Incorporate this slide anywhere in your own presentation.The stages in this process are finance, business, management.
-
 Dashboards by function finance profit and loss dashboard
Present the topic in a bit more detail with this Dashboards By Function Finance Profit And Loss Dashboard. Use it as a tool for discussion and navigation on Finance Profit And Loss Dashboard. This template is free to edit as deemed fit for your organization. Therefore download it now.
-
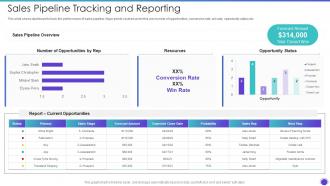 Sales Pipeline Tracking And Reporting Sales Pipeline Management Strategies
This slide shows dashboard to track the performance of sales pipeline. Major points covered under this are number of opportunities, conversion rate, win rate, opportunity status etc. Deliver an outstanding presentation on the topic using this Sales Pipeline Tracking And Reporting Sales Pipeline Management Strategies. Dispense information and present a thorough explanation of Sales Pipeline Overview, Resources, Opportunity using the slides given. This template can be altered and personalized to fit your needs. It is also available for immediate download. So grab it now.
-
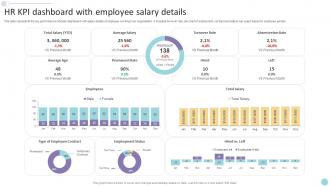 HR KPI Dashboard With Employee Salary Details
This slide represents the key performance indicator dashboard snapshot with salary details of employee working in an organisation. It includes turnover rate, pie chart of employment contract and status, bar graph based on employee gender Introducing our HR KPI Dashboard With Employee Salary Details set of slides. The topics discussed in these slides are HR KPI Dashboard Snapshot Employee Salary Details. This is an immediately available PowerPoint presentation that can be conveniently customized. Download it and convince your audience.
-
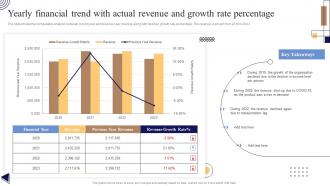 Yearly Financial Trend With Actual Revenue And Growth Rate Percentage
The slide shows the comparative analysis between current year and previous year revenue along with revenue growth rate percentage. The revenue is shown from 2019 to 2023. Introducing our Yearly Financial Trend With Actual Revenue And Growth Rate Percentage set of slides. The topics discussed in these slides are Yearly Financial Trend, Actual Revenue, Growth Rate Percentage. This is an immediately available PowerPoint presentation that can be conveniently customized. Download it and convince your audience.
-
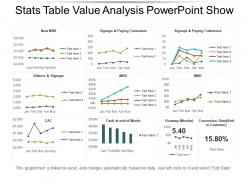 45829420 style essentials 2 financials 9 piece powerpoint presentation diagram infographic slide
Presenting stats table value analysis PowerPoint show. This layout offers you plenty of space to put in titles and sub titles. High resolution-based layout, does not change the image even after resizing. This presentation icon is fully compatible with Google slides. Quick downloading speed and simple editing options in color text and fonts.PPT icons can easily be changed into JPEG and PDF applications. This diagram has been designed for entrepreneurs, corporate and business managers. Easy to use, edit and you can design attractive slides within few minutes.
-
 Asset allocation management powerpoint presentation slides
Presenting this set of slides with name - Asset Allocation Management Powerpoint Presentation Slides. This PPT deck displays seventy slides with in-depth research. Our topic oriented Asset Allocation Management Powerpoint Presentation Slides presentation deck is a helpful tool to plan, prepare, document and analyze the topic with a clear approach. We provide a ready to use deck with all sorts of relevant topics subtopics templates, charts and graphs, overviews, analysis templates. It showcases of all kind of editable templates. You can make changes to colors, data, and fonts if you need to. Download PowerPoint templates in both widescreen and standard screen. The presentation is fully supported by Google Slides. It can be easily converted into JPG or PDF format.
-
 Investment management analysis powerpoint presentation slides
Presenting this set of slides with name - Investment Management Analysis Powerpoint Presentation Slides. Our creatively crafted slides come with apt research and planning. This exclusive deck with seventy slides is here to help you to strategize, plan, analyze, or segment the topic. Utilize ready to use presentation slides on Investment Management Analysis Powerpoint Presentation Slides with all sorts of editable templates, charts and graphs, overviews, analysis templates. you can make changes to colors, data, and fonts if you need to. Download PowerPoint templates in both widescreen and standard screen. The presentation is fully supported by Google Slides. It can be easily converted into JPG or PDF format.
-
 Papa johns company profile overview financials and statistics from 2014-2018
This report is an extensively researched profile on company Papa Johns Company Profile Overview Financials And Statistics From 2014 To 2018 in industry Consumer Goods And FMCG and Retail and Trade and E-Commerce and has been prepared by SlideTeam industry experts after extensively researching through hundreds of data sources. This is part of our Company Profiles products selection, and you will need a Paid account to download the actual report with accurate data and sources for each statistic and fact. Downloaded report will be in Powerpoint and will contain the actual editable slides with the actual data and sources for each data where applicable. Download it immediately and use it for your business.
-
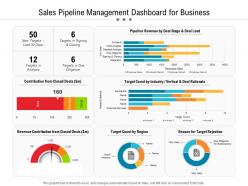 Sales pipeline management dashboard for business
Presenting this set of slides with name Sales Pipeline Management Dashboard For Business. The topics discussed in these slides are Revenue, Target, Diligence. This is a completely editable PowerPoint presentation and is available for immediate download. Download now and impress your audience.
-
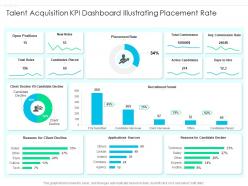 Talent acquisition kpi dashboard illustrating placement rate
Presenting our well structured Talent Acquisition KPI Dashboard Illustrating Placement Rate. The topics discussed in this slide are Funnel, Sources, Commission. This is an instantly available PowerPoint presentation that can be edited conveniently. Download it right away and captivate your audience.
-
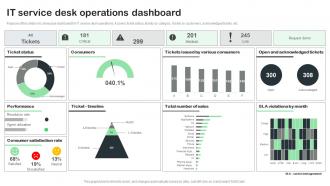 IT Service Desk Operations Dashboard
Purpose of this slide is to showcase dashboard for IT service desk operations. It covers ticket status, tickets by category, tickets by customers, acknowledged tickets, etc. Presenting our well structured IT Service Desk Operations Dashboard. The topics discussed in this slide are Ticket Status, Consumers, Performance, Consumer Satisfaction Rate. This is an instantly available PowerPoint presentation that can be edited conveniently. Download it right away and captivate your audience.
-
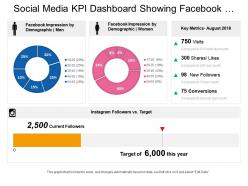 33914793 style essentials 2 financials 4 piece powerpoint presentation diagram infographic slide
Presenting this set of slides with name - Social Media Kpi Dashboard Showing Facebook Impression By Demographic Instagram Key Metrics. This is a four stage process. The stages in this process are Social Media, Digital Marketing, Social Marketing.
-
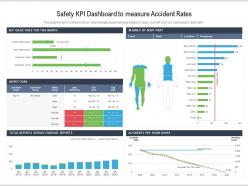 Safety kpi dashboard to measure accident rates
Presenting this set of slides with name Safety KPI Dashboard To Measure Accident Rates. The topics discussed in these slide is Safety KPI Dashboard To Measure Accident Rates. This is a completely editable PowerPoint presentation and is available for immediate download. Download now and impress your audience.
-
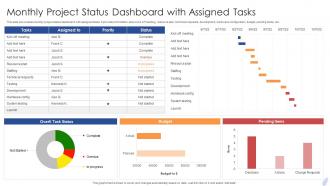 Monthly Project Status Dashboard With Assigned Tasks
This slide showcases monthly project status dashboard with assigned tasks. It provides information about kick off meeting, resource plan, technical requests, development, hardware configuration, budget, pending items, etc. Introducing our Monthly Project Status Dashboard With Assigned Tasks set of slides. The topics discussed in these slides are Monthly Project Status, Dashboard, Assigned Tasks. This is an immediately available PowerPoint presentation that can be conveniently customized. Download it and convince your audience.
-
 Monthly Project Status With Total Budget
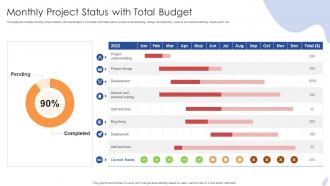
This slide showcases monthly project status with total budget. It provides information about project understanding, design, development, internal and external testing, deployment, etc. Introducing our Monthly Project Status With Total Budget set of slides. The topics discussed in these slides are Monthly Project Status, Total Budget. This is an immediately available PowerPoint presentation that can be conveniently customized. Download it and convince your audience.
-
 KPI Dashboard For Compliance Audit Governance Insights
Following slide showcases compliance audit governance insights measuring KPI dashboard for gaining advantage in process. It further covers quarter audit observations, internal audit plan status, people involved, time spent in internal audit, etc. Introducing our KPI Dashboard For Compliance Audit Governance Insights set of slides. The topics discussed in these slides are Quarter Audit Observations, Internal Audit Plan Status, Weekly Audit Report Cycle. This is an immediately available PowerPoint presentation that can be conveniently customized. Download it and convince your audience.
-
 Working Metrics Dashboard Working Capital Management Excellence Handbook For Managers Fin SS
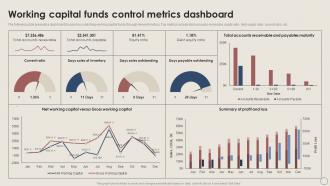
The following slide presents a dashboard focused on controlling working capital funds through relevant metrics. Top metrics include total accounts receivable, equity ratio, debt-equity ratio, current ratio, etc. Deliver an outstanding presentation on the topic using this Working Metrics Dashboard Working Capital Management Excellence Handbook For Managers Fin SS. Dispense information and present a thorough explanation of Dashboard, Controlling, Relevant Metrics using the slides given. This template can be altered and personalized to fit your needs. It is also available for immediate download. So grab it now.
-
 Overdue accounts receivable aging report
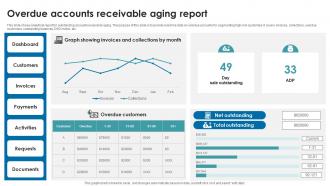
This slide shows analytical report for outstanding accounts receivable aging. The purpose of this slide is to provide real time data on overdue accounts for segmenting high risk customers. It covers invoices, collections, overdue customers, outstanding balances, DSO metric, etc.Presenting our well structured Overdue accounts receivable aging report. The topics discussed in this slide are Net Outstanding, Total Outstanding, Showing Invoices. This is an instantly available PowerPoint presentation that can be edited conveniently. Download it right away and captivate your audience.
-
 85594847 style essentials 2 financials 3 piece powerpoint presentation diagram infographic slide
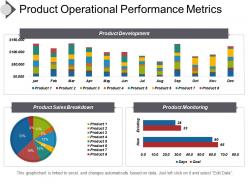
Easily editable as color, text and layout are editable as required. Presentation template is accessible in similar designs with different nodes and stages. PowerPoint slide is attainable in standard and widescreen view. Precise download and can be easily integrate in the presentation. PPT design is downloadable with different nodes and stages. Presentation graphic is designed with high quality resolution design. Presentation diagram is well familiar with Google slides and can be merged with them.
-
 56399320 style essentials 2 financials 3 piece powerpoint presentation diagram infographic slide
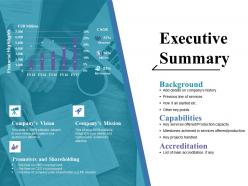
Presenting this set of slides with name - Executive Summary Ppt Pictures. This is a three stage process. The stages in this process are Background, Capabilities, Accreditation, Promoters And Shareholding, Business.
-
 Monthly Product Sales Review Dashboard
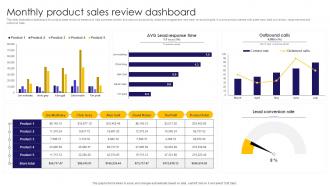
This slide illustrates a dashboard for product sales review to measure to help business monitor and improve productivity, employee engagement and meet revenue targets. It covers product names with sales reps, lead conversion, response time and outbound calls. Presenting our well structured Monthly Product Sales Review Dashboard. The topics discussed in this slide are AVG Lead Response, Time, Outbound Calls, Lead Conversion Rate. This is an instantly available PowerPoint presentation that can be edited conveniently. Download it right away and captivate your audience.
-
 53868423 style essentials 2 financials 3 piece powerpoint presentation diagram infographic slide
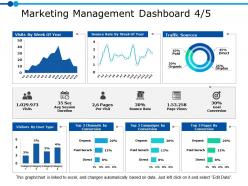
Presenting this set of slides with name - Marketing Management Dashboard 4 5 Ppt Powerpoint Presentation Gallery Example. This is a three stage process. The stages in this process are Business, Management, Strategy, Analysis, Marketing.
-
 Operational risk management kpi dashboard establishing operational risk framework organization
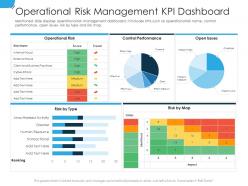
Present the topic in a bit more detail with this Operational Risk Management Kpi Dashboard Establishing Operational Risk Framework Organization. Use it as a tool for discussion and navigation on Internal Fraud, External Fraud, Client And Business Practices. This template is free to edit as deemed fit for your organization. Therefore download it now.
-
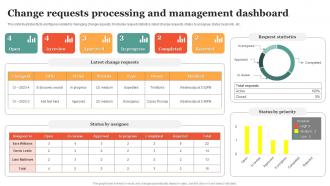 Change Requests Processing And Management Dashboard
This slide illustrates facts and figures related to managing change requests. It includes request statistics, latest change requests, status by assignee, status by priority, etc. Presenting our well structured Change Requests Processing And Management Dashboard. The topics discussed in this slide are Progress, Rejected, Review, Management Dashboard. This is an instantly available PowerPoint presentation that can be edited conveniently. Download it right away and captivate your audience.
-
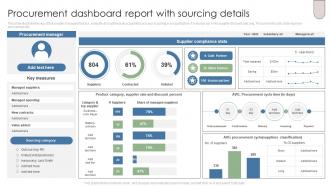 Procurement Dashboard Report With Sourcing Details
This slide illustrate the report that enable managers to track, evaluate and optimize all acquisition process occurring in a organization. It includes kpis like supplier discount rate, avg. Procurement cycle, total expense and savings etc. Introducing our Procurement Dashboard Report With Sourcing Details set of slides. The topics discussed in these slides are Procurement Manager, Sourcing Category, Supplier Compliance Stats. This is an immediately available PowerPoint presentation that can be conveniently customized. Download it and convince your audience.
-
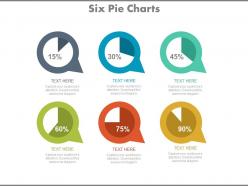 18275156 style essentials 2 financials 6 piece powerpoint presentation diagram infographic slide
Six pie charts for financial percentage analysis PowerPoint Slide. Editable shapes, colors and text. Presentable and easy to comprehend info graphic format. Presentation designs accessible in standard and widescreen view. The presentation template can be downloaded and saved in any desired format. Privilege of insertion of logo and trademarks for more personalization. Fully adaptable PPT slides with Google slides. Easy to edit and customize as per your needs.
-
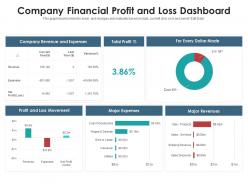 Company financial profit and loss dashboard
Presenting our well-structured Company Financial Profit And Loss Dashboard. The topics discussed in this slide are Revenue And Expenses, Profit And Loss Movement, Profit. This is an instantly available PowerPoint presentation that can be edited conveniently. Download it right away and captivate your audience.
-
 Project Tracker Dashboard With Multiple Metrics
The following slide highlights the KPI of project management to avoid deviations. It includes elements such as schedule, tasks, issue assessment, budget and risk analysis etc. Introducing our Project Tracker Dashboard With Multiple Metrics set of slides. The topics discussed in these slides areProjected Budget Analysis, Risk Analysis, Issue Assessment. This is an immediately available PowerPoint presentation that can be conveniently customized. Download it and convince your audience.
-
 71097059 style essentials 2 financials 4 piece powerpoint presentation diagram infographic slide
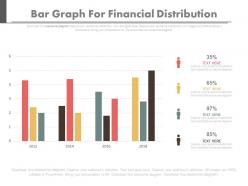
Amendable PowerPoint presentation backgrounds. Technology and action oriented diagrams. Clearly describes the business and finance related information without creating any doubts. Performs remarkably and wraps up the entire presentation on time. Enhances the image of the organisation with their impressive layout. Offers orientation and ungrouping the objects. Can be conveniently modified without any specific training.
-
 46927926 style division non-circular 5 piece powerpoint presentation diagram infographic slide
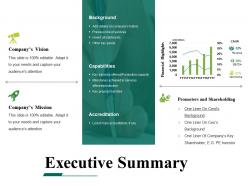
Presenting executive summary powerpoint templates microsoft. This is a executive summary powerpoint templates microsoft. This is a four stage process. The stages in this process are accreditation, capabilities, background, promoters and shareholding.
-
 6510982 style essentials 2 financials 3 piece powerpoint presentation diagram infographic slide
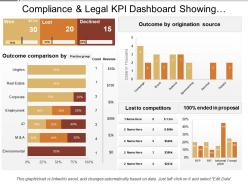
Presenting this set of slides with name - Compliance And Legal Kpi Dashboard Showing Outcome Comparison. This is a three stage process. The stages in this process are Compliance And Legal, Legal Governance, Risk Management.
-
 60356460 style essentials 2 financials 6 piece powerpoint presentation diagram infographic slide
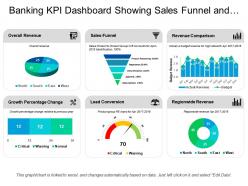
Presenting this set of slides with name - Banking Kpi Dashboard Showing Sales Funnel And Overall Revenue. This is a six stage process. The stages in this process are Banking, Finance, Money.
-
 Percentage circle illustration for sales revenue forecast infographic template
This is our Percentage Circle Illustration For Sales Revenue Forecast Infographic Template designed in PowerPoint, however, you can also access it in Google Slides. It comes in two aspect ratios standard and widescreen, with fully editable visual content.


