All Business Slides Financials Powerpoint Diagram Slide
-
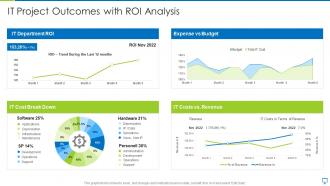 It project outcomes with roi analysis
Introducing our It Project Outcomes With Roi Analysis set of slides. The topics discussed in these slides are Expense, Budget, Revenue. This is an immediately available PowerPoint presentation that can be conveniently customized. Download it and convince your audience.
-
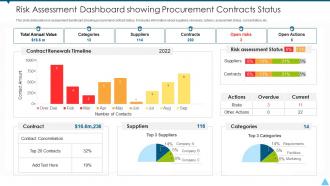 Risk assessment dashboard showing procurement contracts status
Presenting our well structured Risk Assessment Dashboard Showing Procurement Contracts Status. The topics discussed in this slide are Suppliers, Risks, Value. This is an instantly available PowerPoint presentation that can be edited conveniently. Download it right away and captivate your audience.
-
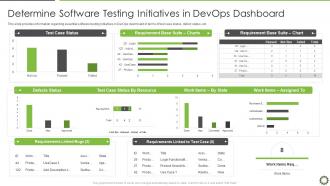 End to end qa and testing devops it determine software testing initiatives devops
This slide provides information regarding essential software testing initiatives in DevOps dashboard in terms of test case status, defect status, etc. Present the topic in a bit more detail with this End To End QA And Testing DevOps IT Determine Software Testing Initiatives DevOps. Use it as a tool for discussion and navigation on Test Case Status, Requirement Base Suite Charts, Defects Status, Requirements Linked Bugs. This template is free to edit as deemed fit for your organization. Therefore download it now.
-
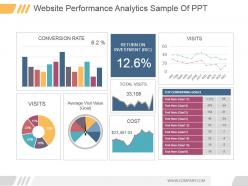 97152031 style essentials 2 financials 3 piece powerpoint presentation diagram infographic slide
Presenting website performance analytics sample of ppt. This is a website performance analytics sample of ppt. This is a three stage process. The stages in this process are conversion rate, visits, average visit value goal, return on investment ric, total visits, cost, visits, top converting goals, jan, feb, mar, apr, may, jun, jul, aug, sep, oct, nov, dec, goal.
-
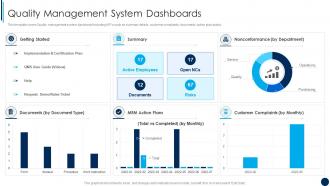 Quality Management System Dashboards ISO 9001 Quality Management Ppt Themes
This template covers Quality management system dashboard including KPIs such as summary details, customer complaints, documents, action plan status. Deliver an outstanding presentation on the topic using this Quality Management System Dashboards ISO 9001 Quality Management Ppt Themes. Dispense information and present a thorough explanation of Quality Management System Dashboards using the slides given. This template can be altered and personalized to fit your needs. It is also available for immediate download. So grab it now.
-
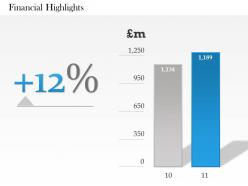 43874460 style essentials 2 financials 1 piece powerpoint presentation diagram infographic slide
We are proud to present our 0414 profit and financial analysis diagram. Our profit and fianacial analysis diagram Powerpoint Templates provide the skeleton of your presentation. Flesh them out with your weighty ideas. Our profit and fianacial analysis diagram Powerpoint Templates are the sinews of your lecture. Give them the muscle of your vibrant thoughts.
-
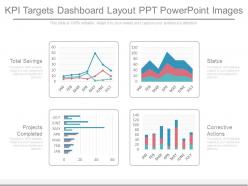 34140691 style essentials 2 financials 4 piece powerpoint presentation diagram infographic slide
Presenting kpi targets dashboard layout ppt powerpoint images. This is a kpi targets dashboard layout ppt powerpoint images. This is a four stage process. The stages in this process are total savings, projects completed, status, corrective actions.
-
 27459295 style essentials 2 financials 4 piece powerpoint presentation diagram infographic slide
Introducing information technology KPI dashboard showing overdue tasks deadlines PowerPoint template. PPT slides offer a thorough editable customization of font, color, and orientation of high powered info-graphics. Quick and easy downloading process. Suitable for business managers and professionals. Sufficient space is available for the easy placement of desired content. Templates are compatible with wide range of software such as pdf/jpeg/Jpg. PPT design can be access in standard and widescreen view. Editing instructions are explained step by step.
-
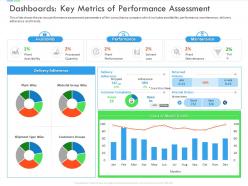 Dashboards key metrics of performance assessment inefficient business
This slide shows the various performance assessment parameters of the consultancy company which includes availability, performance, maintenance, delivery adherence and trends.Present the topic in a bit more detail with this Dashboards Key Metrics Of Performance Assessment Inefficient Business. Use it as a tool for discussion and navigation on Dashboards Key Metrics Of Performance Assessment. This template is free to edit as deemed fit for your organization. Therefore download it now.
-
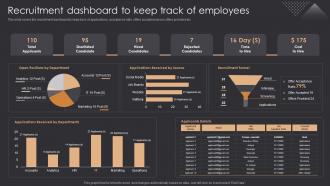 Inbound Recruiting Recruitment Dashboard To Keep Track Of Employees Ppt Slides Microsoft
This slide covers the recruitment dashboard to keep track of applications, acceptance ratio, offers accepted versus offers provided etc. Deliver an outstanding presentation on the topic using this Inbound Recruiting Recruitment Dashboard To Keep Track Of Employees Ppt Slides Microsoft. Dispense information and present a thorough explanation of Recruitment, Dashboard, Employees using the slides given. This template can be altered and personalized to fit your needs. It is also available for immediate download. So grab it now.
-
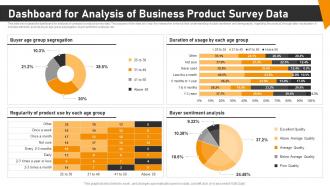 Dashboard For Analysis Of Business Product Survey Data
This slide showcases the dashboard for analysis of companys product survey data. The purpose of this slide is to help the researcher enhance their understanding of public sentiment and demography, regarding the product, through data visualization. It includes elements such as buyer age group segregation, buyer sentiment analysis, etc. Introducing our Dashboard For Analysis Of Business Product Survey Data set of slides. The topics discussed in these slides are Group Segregation, Regularity Product, Buyer Sentiment Analysis. This is an immediately available PowerPoint presentation that can be conveniently customized. Download it and convince your audience.
-
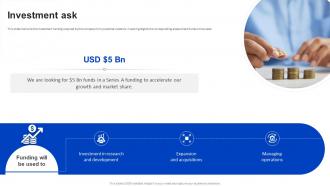 Investment Ask Panasonic Investor Funding Elevator Pitch Deck
This slide mentions the investment funding required by the company from potential investors. It also highlights the corresponding areas where funds will be used. Increase audience engagement and knowledge by dispensing information using Investment Ask Panasonic Investor Funding Elevator Pitch Deck. This template helps you present information on three stages. You can also present information on Investment Ask, Investment Funding, Potential Investors using this PPT design. This layout is completely editable so personaize it now to meet your audiences expectations.
-
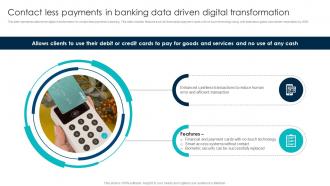 Contact Less Payments In Banking Data Driven Digital Transformation
This slide represents data driven digital transformation for contact less payments in banking. This slide includes features such as financial and payment cards with no touch technology along with stats about global card market expectation by 2026. Presenting our set of slides with Contact Less Payments In Banking Data Driven Digital Transformation This exhibits information on Twostages of the process. This is an easy to edit and innovatively designed PowerPoint template. So download immediately and highlight information on Efficient Transaction, Successfully Replaced
-
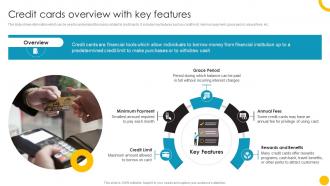 Credit Cards Overview Guide To Use And Manage Credit Cards Effectively Fin SS
This slide shows information which can be used to understand the basics related to credit cards. It includes key features such as credit limit, minimum payment, grace period, annual fees, etc. Increase audience engagement and knowledge by dispensing information using Credit Cards Overview Guide To Use And Manage Credit Cards Effectively Fin SS. This template helps you present information on five stages. You can also present information on Overview, Grace Period, Rewards And Benefits using this PPT design. This layout is completely editable so personaize it now to meet your audiences expectations.
-
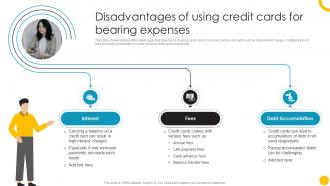 Disadvantages Of Using Credit Guide To Use And Manage Credit Cards Effectively Fin SS
This slide shows detailed information regarding drawbacks of using credit cards. It includes various demerits such as high interest charges, multiple types of fees and debt accumulation in case of using credit card irresponsibly. Increase audience engagement and knowledge by dispensing information using Disadvantages Of Using Credit Guide To Use And Manage Credit Cards Effectively Fin SS. This template helps you present information on three stages. You can also present information on Debt Accumulation, Fees, Interest using this PPT design. This layout is completely editable so personaize it now to meet your audiences expectations.
-
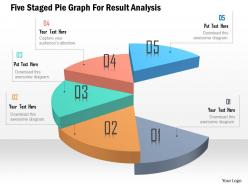 23707509 style division pie 5 piece powerpoint presentation diagram infographic slide
We are proud to present our five staged pie graph for resul analysis powerpoint template. Five staged pie graph has been used to craft this power point template diagram. This PPT diagram contains the concept of result analysis. Use this PPT diagram for business and marketing related presentations.
-
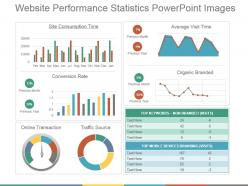 64816763 style essentials 2 financials 2 piece powerpoint presentation diagram infographic slide
We present to you our website performance statistics PowerPoint images. You can change the placement, the size or the color of the graphical images used in the template. You can make numerous changes by following the instructions given in sample slides, as this PPT is fully editable. This template can be saved in either PDF or JPG format. You can view the presentation in widescreen display ratio of 16:9 or standard size display ratio of 4:3. So download, edit and present it.
-
 Valuation of shares powerpoint presentation slides
Presenting this set of slides with name - Valuation Of Shares Powerpoint Presentation Slides. The stages in this process are Valuation Of Shares, Companys Shares, Shares Analysis.
-
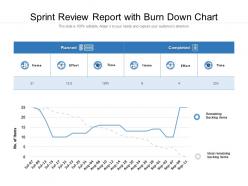 Sprint review report with burn down chart
Presenting this set of slides with name Sprint Review Report With Burn Down Chart. The topics discussed in these slides are Planned, Completed, Remaining Backlog Items, Ideal Remaining Backlog Items. This is a completely editable PowerPoint presentation and is available for immediate download. Download now and impress your audience.
-
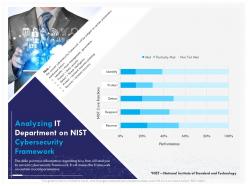 Analyzing it department on nist cybersecurity framework respond ppt gridlines
This slide portrays information regarding how firm will analyze its current cybersecurity framework. It will assess the framework on certain crucial parameters. Presenting this set of slides with name Analyzing IT Department On Nist Cybersecurity Framework Respond Ppt Gridlines. The topics discussed in these slides are Analyzing IT Department On NIST Cybersecurity Framework. This is a completely editable PowerPoint presentation and is available for immediate download. Download now and impress your audience.
-
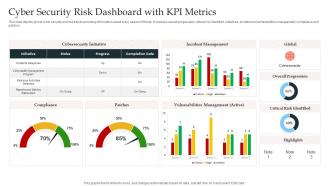 Cyber Security Risk Dashboard With KPI Metrics
This slide depicts global cyber security and risk trends providing information about every aspect of threat. It includes overall progression, critical risk identified, initiatives, incident and vulnerabilities management, compliance and patches. Introducing our Cyber Security Risk Dashboard Snapshot With KPI Metrics set of slides. The topics discussed in these slides are Incident Management, Global, Cybersecurity, Vulnerabilities Management. This is an immediately available PowerPoint presentation that can be conveniently customized. Download it and convince your audience.
-
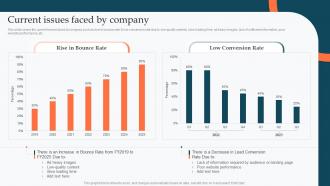 Current Issues Faced By Company Enhance Product Sales Using Different Branding Strategies
This slide covers the current issues faced by company such as rise in bounce rate and low conversion rate due to low quality content, slow loading time, ad heavy images, lack of sufficient information, poor website performance, etc. Present the topic in a bit more detail with this Current Issues Faced By Company Enhance Product Sales Using Different Branding Strategies. Use it as a tool for discussion and navigation on Rise Bounce Rate, Low Conversion Rate. This template is free to edit as deemed fit for your organization. Therefore download it now.
-
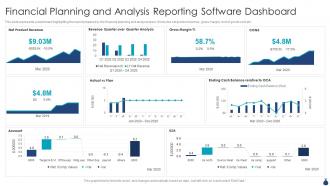 Financial Planning And Analysis Reporting Software Dashboard
This slide represents a dashboard highlighting the report prepared by the financial planning and analysis team. It includes net product revenue, gross margin, cost of goods sold etc. Introducing our Financial Planning And Analysis Reporting Software Dashboard set of slides. The topics discussed in these slides are Financial Planning Analysis, Reporting Software Dashboard. This is an immediately available PowerPoint presentation that can be conveniently customized. Download it and convince your audience.
-
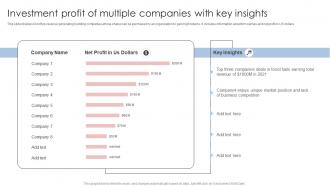 Investment Profit Of Multiple Companies With Key Insights
This slide displays list of top revenue generating budding companies whose shares can be purchased by an organization to gain high returns. It includes information about firm names and net profit in US dollars. Introducing our Investment Profit Of Multiple Companies With Key Insights set of slides. The topics discussed in these slides are Investment Profit, Multiple Companies, Key Insights. This is an immediately available PowerPoint presentation that can be conveniently customized. Download it and convince your audience.
-
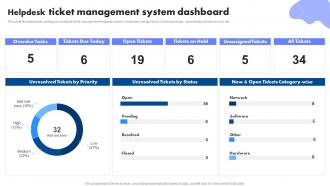 Helpdesk Ticket Management System Dashboard
This slide illustrates facts and figures related to ticket management helpdesk system. It includes overdue tasks, tickets due today, open tickets, tickets on hold, etc. Presenting our well structured Helpdesk Ticket Management System Dashboard. The topics discussed in this slide are Overdue Tasks, Tickets On Hold, System Dashboard. This is an instantly available PowerPoint presentation that can be edited conveniently. Download it right away and captivate your audience.
-
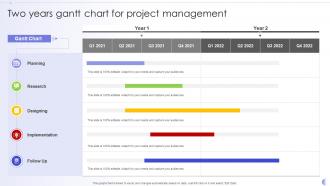 Two Years Gantt Chart For Project Management
Design a highly optimized project management report using this well-researched Two Years Gantt Chart For Project Management. This layout can be used to present the professional details of a task or activity. Showcase the activities allocated to the business executives with this Gantt Chart PowerPoint theme. List down the column tasks in various timeframes and allocate time for each. In addition, also monitor the actual time and make comparisons to interpret the final progress using this innovative Gantt Chart Template. Showcase the work breakdown structure to attract your audience. Download and share it using Google Slides, if it suits your requirement.
-
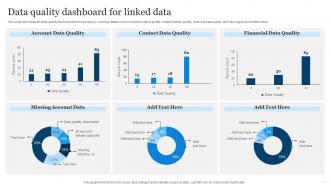 Linked Open Data Data Quality Dashboard For Linked Data Ppt Powerpoint Presentation Slides Tips
This slide describes the data quality dashboard for linked data by covering details of account information quality, contact details quality, financial data quality, and missing account information. Present the topic in a bit more detail with this Linked Open Data Data Quality Dashboard For Linked Data Ppt Powerpoint Presentation Slides Tips. Use it as a tool for discussion and navigation on Account Data Quality, Contact Data Quality, Financial Data Quality. This template is free to edit as deemed fit for your organization. Therefore download it now.
-
 Coca cola company profile overview financials and statistics from 2014-2018
This report is an extensively researched profile on company Coca Cola Company Profile Overview Financials And Statistics From 2014 to 2018 in industry Consumer Goods And FMCG and Retail and Trade and E-Commerce and has been prepared by SlideTeam industry experts after extensively researching through hundreds of data sources. This is part of our Company Profiles products selection, and you will need a Paid account to download the actual report with accurate data and sources for each statistic and fact. Downloaded report will be in Powerpoint and will contain the actual editable slides with the actual data and sources for each data where applicable. Download it immediately and use it for your business.
-
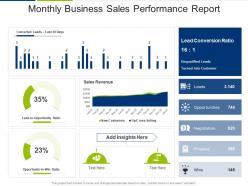 Monthly business sales performance report
Presenting our well structured Monthly Business Sales Performance Report. The topics discussed in this slide are lead opportunity ratio, sales revenue, lead conversion ratio. This is an instantly available PowerPoint presentation that can be edited conveniently. Download it right away and captivate your audience.
-
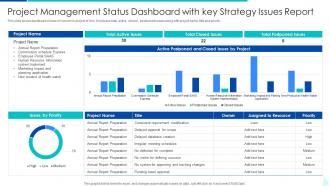 Project Management Status Dashboard With Key Strategy Issues Report
This slide shows dashboard of area of concern in project of firm. It includes total, active, closed , postponed issues along with project name, title and priority. Presenting our well-structured Project Management Status Dashboard Agile sprint dashboard with defected project status With Key Strategy Issues Report. The topics discussed in this slide are Management, Dashboard, Strategy. This is an instantly available PowerPoint presentation that can be edited conveniently. Download it right away and captivate your audience.
-
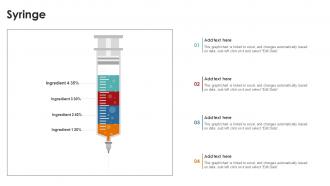 Syringe PU Chart SS
Introducing our Syringe PU Chart SS set of slides. The topics discussed in these slides are Syringe. This is an immediately available PowerPoint presentation that can be conveniently customized. Download it and convince your audience.
-
 Investment valuation ratios powerpoint presentation slides
These templates are 100% editable. Our PowerPoint presentation slides are quickly downloadable. These slide consists of 29 slides and comprises all the necessary information. High-resolution template designs. These slides have compatible presentation layout. Our PPT visuals can be easily converted to PDF and JPG formats. Our presentation visuals can be used by investors, promoters, marketers, business professionals, sales and many more. We have used standardized colors which contrast and compliment.The stages in this process are investment valuation ratios, investment potential, pe ratio.
-
 Capital asset expenditure powerpoint presentation slides
Introducing Capital Asset Expenditure Powerpoint Presentation Slides. This presentation includes 41 professionally designed PPT templates. These PPT Slides are 100 % editable. Users can change the fonts, colors, and slide background as per their need. On downloading the presentation, you get the templates in both widescreen and standard screen. The presentation is compatible with Google Slides and can be saved in JPG or PDF format.
-
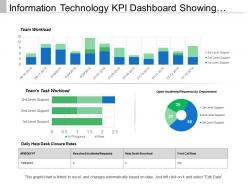 90643141 style essentials 2 financials 3 piece powerpoint presentation diagram infographic slide
Presenting this set of slides with name - Information Technology Kpi Dashboard Showing Team Task Workload. This is a three stage process. The stages in this process are Information Technology, It, Iot.
-
 Income forecast powerpoint presentation slides
Enhance your audiences knowledge with this well researched complete deck. Showcase all the important features of the deck with perfect visuals. This deck comprises of total of ninteen slides with each slide explained in detail. Each template comprises of professional diagrams and layouts. Our professional PowerPoint experts have also included icons, graphs and charts for your convenience. All you have to do is DOWNLOAD the deck. Make changes as per the requirement. Yes, these PPT slides are completely customizable. Edit the colour, text and font size. Add or delete the content from the slide. And leave your audience awestruck with the professionally designed Income Forecast Power Point Presentation Slides complete deck.
-
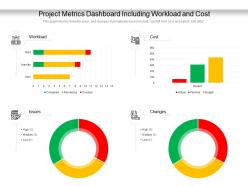 Project metrics dashboard including workload and cost
Presenting this set of slides with name Project Metrics Dashboard Including Workload And Cost. The topics discussed in these slides are Cost, Workload, Issues. This is a completely editable PowerPoint presentation and is available for immediate download. Download now and impress your audience.
-
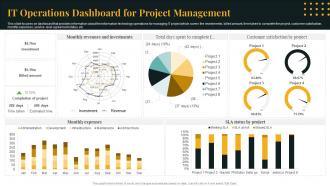 IT Operations Dashboard For Project Management
This slide focuses on dashboard that provides information about the information technology operations for managing IT project which covers the investments, billed amount, time taken to complete the project, customer satisfaction, monthly expenses, service level agreement status, etc. Presenting our well structured IT Operations Dashboard For Project Management. The topics discussed in this slide are IT Operations Dashboard, For Project Management. This is an instantly available PowerPoint presentation that can be edited conveniently. Download it right away and captivate your audience.
-
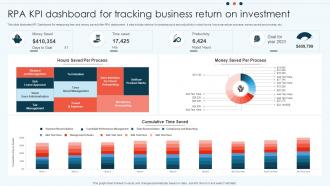 RPA KPI Dashboard For Tracking Business Return On Investment
This slide illustrates KPI Dashboard for measuring time and money saved after RPA deployment. It also include metrics for analysis such as productivity in robot hours, hours saved per process, money saved per process, etc. Presenting our well structured RPA KPI Dashboard For Tracking Business Return On Investment. The topics discussed in this slide are Termination, Client Onboarding, Workforce Forecasting. This is an instantly available PowerPoint presentation that can be edited conveniently. Download it right away and captivate your audience.
-
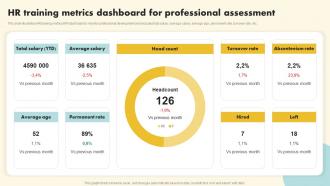 HR Training Metrics Dashboard For Professional Assessment
This slide illustrates HR training metrics KPI dashboard to monitor professional development and includes total salary, average salary, average age, permanent rate, turnover rate, etc. Presenting our well structured HR Training Metrics Dashboard For Professional Assessment The topics discussed in this slide are Total Salary, Average Salary, Head Count This is an instantly available PowerPoint presentation that can be edited conveniently. Download it right away and captivate your audience.
-
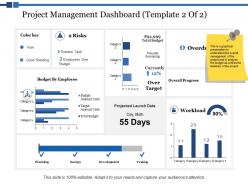 95857217 style essentials 2 financials 3 piece powerpoint presentation diagram infographic slide
This is a threee stages process. The stages in this process are Finance, Marketing, Management, Investment, Analysis.
-
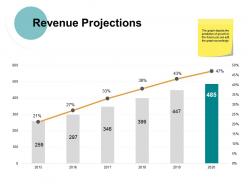 80531286 style essentials 2 financials 2 piece powerpoint presentation diagram infographic slide
Presenting this set of slides with name - Revenue Projections Ppt Powerpoint Presentation File Designs Download. This is a two stage process. The stages in this process are Finance, Management, Strategy, Business, Marketing.
-
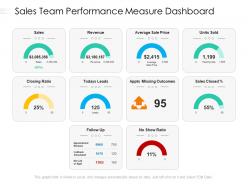 Sales team performance measure dashboard
Presenting this set of slides with name Sales Team Performance Measure Dashboard. The topics discussed in these slides are Sales, Revenue, Average. This is a completely editable PowerPoint presentation and is available for immediate download. Download now and impress your audience.
-
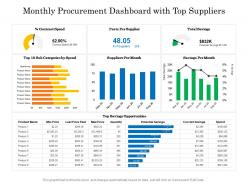 Monthly procurement dashboard with top suppliers
Presenting this set of slides with name Monthly Procurement Dashboard With Top Suppliers. The topics discussed in these slides are Opportunities, Supplier, Price. This is a completely editable PowerPoint presentation and is available for immediate download. Download now and impress your audience.
-
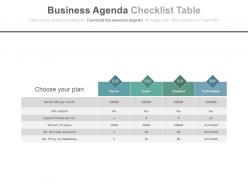 57360572 style essentials 2 financials 1 piece powerpoint presentation diagram infographic slide
This PPT Template can be used by any organization’s executives for representing business agenda related presentations. All these images are 100% edited in terms of color, size, and orientation of the elements mentioned in the slides. These PPT slides are compatible with Google slides and can be edited in any PowerPoint software.
-
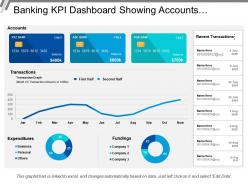 89540797 style essentials 2 financials 3 piece powerpoint presentation diagram infographic slide
Presenting this set of slides with name - Banking Kpi Dashboard Showing Accounts Expenditures Fundings. This is a three stage process. The stages in this process are Banking, Finance, Money.
-
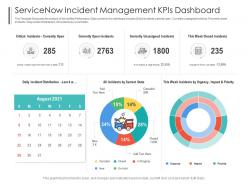 Servicenow incident management kpis dashboard powerpoint template
This Template Showcases the analysis of ServiceNow Performance. Data covered in this dashboard includes-Critical incidents-currently open , Currently unassigned incidents, This week closed incidents. Daily incident Distribution, All incidents by current state. This is a Servicenow Incident Management Kpis Dashboard Snapshot Powerpoint Template featuring in built editable components to add your personal touches. Tailor this template as per your liking and display it on a widescreen or standard screen, the choice is yours.
-
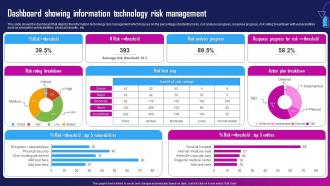 Dashboard Showing Information Technology Risk Management
This slide shows the dashboard that depicts the information technology risk management which focuses on the percentage of potential risks, risk analysis progress, response progress, risk rating breakdown with vulnerabilities such as encryption vulnerabilities, physical security , etc. Deliver an outstanding presentation on the topic using this Dashboard Showing Information Technology Risk Management. Dispense information and present a thorough explanation of Risk Rating Breakdown, Risk Heat Map, Action Plan Breakdown using the slides given. This template can be altered and personalized to fit your needs. It is also available for immediate download. So grab it now.
-
 Private capital powerpoint presentation slides
Presenting this set of slides with name - Private Capital Powerpoint Presentation Slides. The stages in this process are Private Capital, Private Equity, Venture Capital.
-
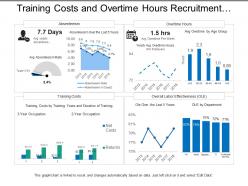 90454204 style essentials 2 financials 4 piece powerpoint presentation diagram infographic slide
Presenting this set of slides with name - Training Costs And Overtime Hours Recruitment Dashboard. This is a four stage process. The stages in this process are Staffing Plan, Recruitment, Staff Management.
-
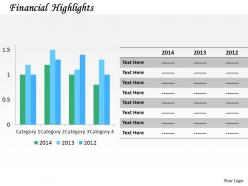 94847653 style essentials 2 financials 1 piece powerpoint presentation diagram infographic slide
Deploy slides in all compatible software evenly. Hassle-free download and usage of slide. Company logo, trademark or name can be inserted for extra customization. PowerPoint graphics do not pixelate upon projection on widescreen. All slides compatible with google slides for more online reach. Highly customized layout including font, text, color and design. Include titles and sub titles with zero space constraints.
-
 Revenue projection powerpoint presentation slides
Presenting this set of slides with name - Revenue Projection Powerpoint Presentation Slides. This deck consists of total of twenty slides. It has PPT slides highlighting important topics of Revenue Projection Powerpoint Presentation Slides. This deck comprises of amazing visuals with thoroughly researched content. The best part is that these templates are easily customizable. Download PowerPoint templates in both widescreen and standard screen. The presentation is fully supported by Google Slides. It can be easily converted into JPG or PDF format.
-
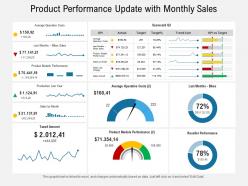 Product performance update with monthly sales
Presenting this set of slides with name Product Performance Update With Monthly Sales. The topics discussed in these slides are Costs, Sales, Performance. This is a completely editable PowerPoint presentation and is available for immediate download. Download now and impress your audience.
-
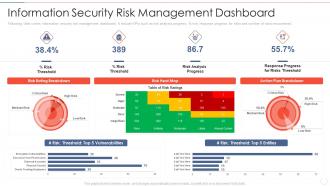 Information security dashboard effective information security risk management process
Following slide covers information security risk management dashboard. It include KPIs such as risk analysis progress, persent risk, response progress for risks and number of risks encountered.Present the topic in a bit more detail with this Information Security Dashboard Effective Information Security Risk Management Process. Use it as a tool for discussion and navigation on Risk Rating Breakdown, Risk Analysis Progress Action Plan Breakdown. This template is free to edit as deemed fit for your organization. Therefore download it now.
-
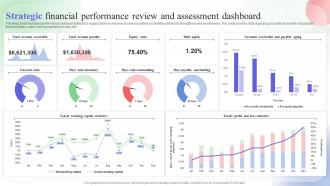 Strategic Financial Performance Review And Assessment Dashboard
Following slide illustrates performance dashboard utilized by organizations to improve business position by identifying financial strengthens and weaknesses. This slide provides data regarding accounts receivable and payable, financial ratios, yearly working capital summary, etc. Introducing our Strategic Financial Performance Review And Assessment Dashboard set of slides. The topics discussed in these slides are Equity Ratio, Debt Equity, Current Ratio. This is an immediately available PowerPoint presentation that can be conveniently customized. Download it and convince your audience.
-
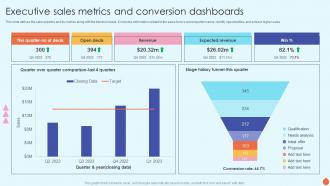 Executive Sales Metrics And Conversion Dashboards
This slide defines the sales pipeline and its metrics along with the trends in leads. It includes information related to the sales forces current performance, identify opportunities, and achieve higher sales. Deliver an outstanding presentation on the topic using this Executive Sales Metrics And Conversion Dashboards. Dispense information and present a thorough explanation of Open Deals, Revenue, Expected Revenue using the slides given. This template can be altered and personalized to fit your needs. It is also available for immediate download. So grab it now.
-
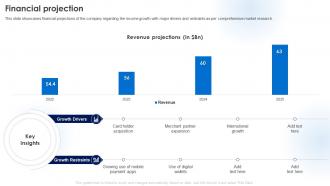 Financial Projection Business Model Of American Express BMC SS
This slide showcases financial projections of the company regarding the income growth with major drivers and restraints as per comprehensive market research. Present the topic in a bit more detail with this Financial Projection Business Model Of American Express BMC SS. Use it as a tool for discussion and navigation on Financial Projection, Comprehensive Market Research, International Growth. This template is free to edit as deemed fit for your organization. Therefore download it now.
-
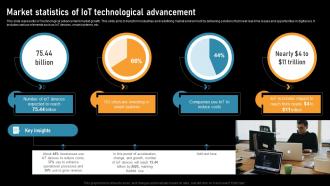 Market Statistics Of IoT Technological Advancement
This slide represents IoT technological advancement market growth. This slide aims to transform industries and redefining market environment by delivering solutions that meet real-time issues and opportunities in digital era. It includes various elements such as IoT devices, smart systems, etc. Introducing our Market Statistics Of IoT Technological Advancement set of slides. The topics discussed in these slides are Investing In Smart Systems, Iot To Reduce Costs, Key Insights. This is an immediately available PowerPoint presentation that can be conveniently customized. Download it and convince your audience.
-
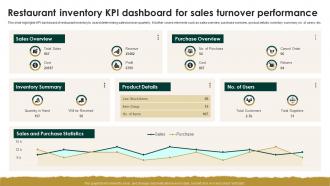 Restaurant Inventory KPI Dashboard For Sales Turnover Performance
This slide highlights KPI dashboard of restaurant inventory to assist determining sales turnover quarterly. It further covers elements such as sales overview, purchase overview, product details, inventory summary, no. of users, etc. Introducing our Restaurant Inventory KPI Dashboard For Sales Turnover Performance set of slides. The topics discussed in these slides are Inventory Summary, Sales Overview, Purchase Overview. This is an immediately available PowerPoint presentation that can be conveniently customized. Download it and convince your audience.
-
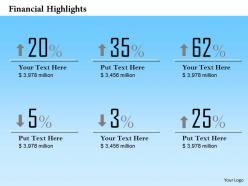 82990464 style essentials 2 financials 1 piece powerpoint presentation diagram infographic slide
High resolution visuals. Splendid picture quality. No fear of image pixilation when projected on wide screen. Compatible with multiple number of software options like JPEG, JPG and PDF. Compatible with numerous software options available both online and offline. Ease of download. Ease of customization. Thoroughly editable slide design background. Freedom to personalize the slide content with company specific name, logo and trademark.
-
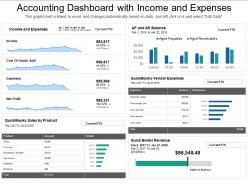 55369360 style essentials 2 financials 5 piece powerpoint presentation diagram infographic slide
Presenting accounting dashboard with income and expenses PPT slideshow. Loaded with incomparable benefits. Readymade PPT graphic helps in saving time and effort. Can be personalized by adding company trademark, logo, brand and symbols. Can be utilized for displaying both simple and complex information. Include or exclude slide content as per your individual need. Colors and text can be easily changed as the PPT slide is completely editable. Useful for every business leader and professional, project management team, business analysts, etc.


