All Business Slides Financials Powerpoint Diagram Slide
-
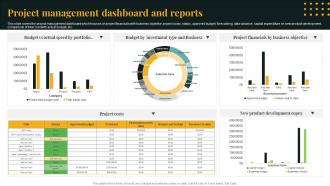 Project Management Dashboard And Reports
This slide covers the project management dashboard which focuses on project financials with business objective, project costs, status, approved budget, forecasting, data variance, capital expenditure on new product development, comparison of total cost with actual budget, etc. Presenting our well structured Project Management Dashboard Snapshot And Reports. The topics discussed in this slide are Budget Vs Actual Speed By Portfolio, Project Financials By Business Objective, Budget By Investment Type And Business . This is an instantly available PowerPoint presentation that can be edited conveniently. Download it right away and captivate your audience.
-
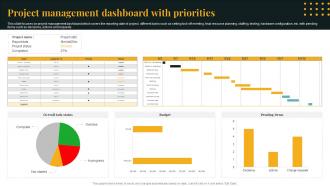 Project Management Dashboard With Priorities
This slide focuses on project management dashboard which covers the reporting date of project, different tasks such as setting kick off meeting, final resource planning, staffing, testing, hardware configuration, etc. with pending items such as decisions, actions and requests. Presenting our well structured Project Management Dashboard With Priorities. The topics discussed in this slide are Project Management, Dashboard With Priorities. This is an instantly available PowerPoint presentation that can be edited conveniently. Download it right away and captivate your audience.
-
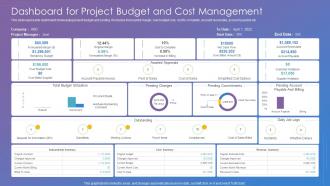 Dashboard For Project Budget And Cost Management
This slide represents dashboard showcasing project budget and costing. It includes forecasted margin, over budget cost, cost to complete, account receivable, account payable etc. Introducing our Dashboard For Project Budget And Cost Management set of slides. The topics discussed in these slides are Dashboard, Project Budget, Cost Management. This is an immediately available PowerPoint presentation that can be conveniently customized. Download it and convince your audience.
-
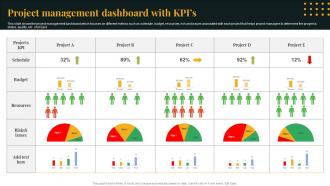 Project Management Dashboard With KPIs
This slide shows the project management dashboard which focuses on different metrics such as schedule, budget, resources, risk and issues associated with each project that helps project managers to determine the progress, status, quality, etc. of project. Introducing our Project Management Dashboard With KPIs set of slides. The topics discussed in these slides are Project Management, Dashboard With KPIs. This is an immediately available PowerPoint presentation that can be conveniently customized. Download it and convince your audience.
-
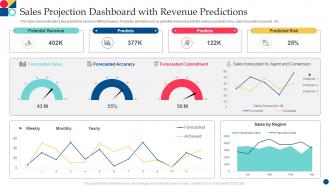 Sales Projection Dashboard With Revenue Predictions
Presenting our well structured Sales Projection Dashboard With Revenue Predictions. The topics discussed in this slide are Forecasted Value, Forecasted Accuracy, Forecasted Commitment. This is an instantly available PowerPoint presentation that can be edited conveniently. Download it right away and captivate your audience.
-
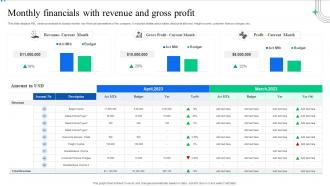 Monthly Financials With Revenue And Gross Profit
This slide displays P and L variance analysis to closely monitor key financial parameters of the company. It includes details about sales, discounts allowed, freight income, customer finance charges, etc. Introducing our Monthly Financials With Revenue And Gross Profit set of slides. The topics discussed in these slides are Financials, Revenue, Analysis. This is an immediately available PowerPoint presentation that can be conveniently customized. Download it and convince your audience.
-
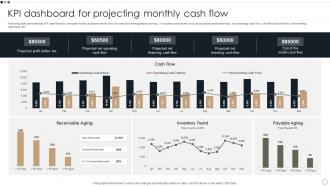 KPI Dashboard For Projecting Monthly Cash Flow
Following slide demonstrates KPI dashboard to forecast monthly business money flow for cash flow management planning. It includes components such as projected profit before tax, net operating cash flow, net financial cash flow, net investing cash flow, etc.Introducing our KPI Dashboard For Projecting Monthly Cash Flow set of slides. The topics discussed in these slides are Projected Profit, Receivable Aging, Financing Cash. This is an immediately available PowerPoint presentation that can be conveniently customized. Download it and convince your audience.
-
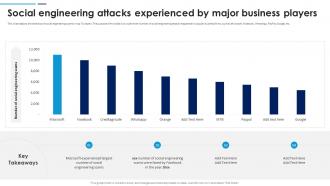 Social Engineering Attacks Prevention Social Engineering Attacks Experienced By Major Business
This slide depicts the statistics of social engineering scams in top IT players. The purpose of this slide is to outline the number of social engineering attacks happened in popular business firms, such as Microsoft, Facebook, WhatsApp, PayPal, Google, etc. Present the topic in a bit more detail with this Social Engineering Attacks Prevention Social Engineering Attacks Experienced By Major Business. Use it as a tool for discussion and navigation on Social Engineering Attacks Experienced, Social Engineering Scams, Major Business Players. This template is free to edit as deemed fit for your organization. Therefore download it now.
-
 Customer Satisfaction Dashboard With Business Growth Plan To Increase Strategy SS V
The following slide outlines visual representation of customer satisfaction dashboard that can be used to measure customer loyalty. It covers key performance indicators KPIs such as average response time, customer satisfaction score, customer effort score CES, net promote score NPS, etc. Deliver an outstanding presentation on the topic using this Customer Satisfaction Dashboard With Business Growth Plan To Increase Strategy SS V. Dispense information and present a thorough explanation of Customer, Promoter, Satisfaction using the slides given. This template can be altered and personalized to fit your needs. It is also available for immediate download. So grab it now.
-
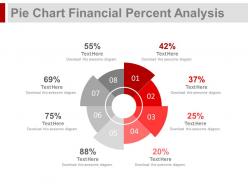 29509029 style essentials 2 financials 8 piece powerpoint presentation diagram infographic slide
Good combination of icons and text using a circular diagram. Compatible with number of software options. Colors and text can be easily changed as the PPT slide is completely editable. Personalize the presentation with individual company name and logo. Available in both Standard and Widescreen slide size. Easy and quick downloading process. Flexible option for conversion in PDF or JPG formats. Completely adaptable with Google slides. Useful for finance professionals, accounts team, education firms etc.
-
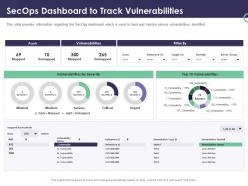 Enterprise security operations secops dashboard to track vulnerabilities ppt powerpoint templates
This slide provides information regarding the SecOps dashboard which is used to track and monitor various vulnerabilities identified. Present the topic in a bit more detail with this Enterprise Security Operations Secops Dashboard To Track Vulnerabilities Ppt Powerpoint Templates. Use it as a tool for discussion and navigation on Assets, Vulnerabilities, Severity. This template is free to edit as deemed fit for your organization. Therefore download it now.
-
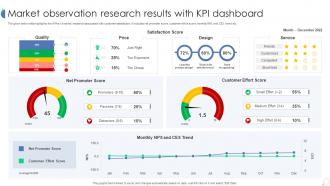 Market Observation Research Results With KPI Dashboard
The given below slide highlights the KPAs of market research associated with customer satisfaction. It includes net promoter score, customer effort score, monthly NPS and CES trend etc. Introducing our Market Observation Research Results With KPI Dashboard set of slides. The topics discussed in these slides are Satisfaction Score, Net Promoter Score, Customer Effort Score. This is an immediately available PowerPoint presentation that can be conveniently customized. Download it and convince your audience.
-
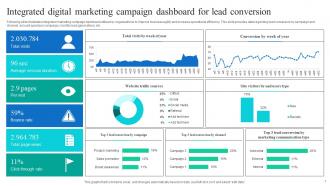 Integrated Digital Marketing Campaign Dashboard For Lead Conversion
Following slide illustrates integrated marketing campaign dashboard utilized by organizations to improve business agility and increase operational efficiency. This slide provides data regarding lead conversion by campaign and channel, amount spent per campaign, monthly lead generations, etc. Presenting our well structured Integrated Digital Marketing Campaign Dashboard For Lead Conversion. The topics discussed in this slide are Digital Marketing, Campaign Dashboard, Lead Conversion. This is an instantly available PowerPoint presentation that can be edited conveniently. Download it right away and captivate your audience.
-
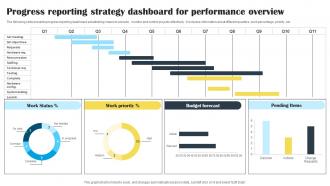 Progress Reporting Strategy Dashboard For Performance Overview
The following slide presents progress reporting dashboard establishing means to execute , monitor and control projects effectively. It includes information about different quarters, work percentage, priority, etc. Presenting our well structured Progress Reporting Strategy Dashboard For Performance Overview. The topics discussed in this slide are Progress Reporting, Strategy Dashboard, Performance Overview. This is an instantly available PowerPoint presentation that can be edited conveniently. Download it right away and captivate your audience.
-
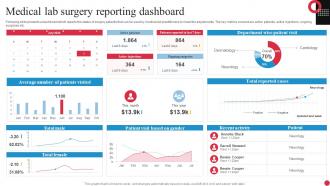 Medical Lab Surgery Reporting Dashboard
Following slide presents a dashboard which reports the status of surgery patients that can be used by medical lab practitioners to make the adjustments. The key metrics covered are active patients, active injections, ongoing surgeries etc. Introducing our Medical Lab Surgery Reporting Dashboard set of slides. The topics discussed in these slides are Active Patients, Department. This is an immediately available PowerPoint presentation that can be conveniently customized. Download it and convince your audience.
-
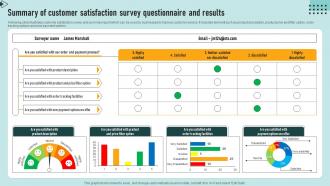 Summary Of Customer Satisfaction Survey Questionnaire And Results Survey SS
Following slide illustrates customer satisfaction survey and summary report which can be used by businesses to improve customer service. It included element such as product description, product price and filter option, order tracking options and new payment options Introducing our Summary Of Customer Satisfaction Survey Questionnaire And Results Survey SS set of slides. The topics discussed in these slides are Customer, Satisfaction, Survey. This is an immediately available PowerPoint presentation that can be conveniently customized. Download it and convince your audience.
-
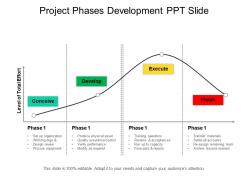 11231651 style essentials 2 financials 4 piece powerpoint presentation diagram infographic slide
Presenting project phases development ppt slide. This is a project phases development ppt slide. This is a four stage process. The stages in this process are project phases templates, project steps, project methods.
-
 31800942 style essentials 2 financials 2 piece powerpoint presentation diagram infographic slide
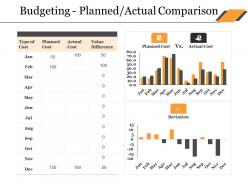
Presenting this set of slides with name - Budgeting Planned Actual Comparison Ppt Deck. This is a two stage process. The stages in this process are Bar Chart, Finance, Marketing, Analysis, Comparison.
-
 31901535 style division donut 3 piece powerpoint presentation diagram infographic slide
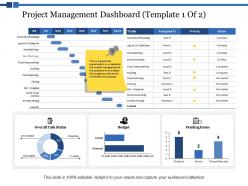
This is a three stages process. The stages in this process are Finance, Marketing, Management, Investment, Analysis.
-
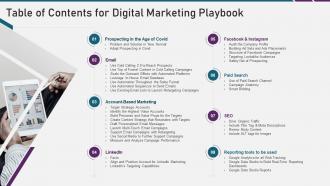 Table of contents for digital marketing playbook
Introducing Table Of Contents For Digital Marketing Playbook to increase your presentation threshold. Encompassed with eight stages, this template is a great option to educate and entice your audience. Dispence information on Prospecting Age Covid, Account-Based Marketing, SEO, Paid Search, Facebook And Instagram, using this template. Grab it now to reap its full benefits.
-
 Project Status And Performance Analytics Dashboard
This slide covers project progress and task status along with timeline. It also includes details such project manager, status, budget allocations for different activities, risks involved, pending actions involved and open change requests. Introducing our Project Status And Performance Analytics Dashboard set of slides. The topics discussed in these slides are Analysis, Design, Development, Testing, Implement. This is an immediately available PowerPoint presentation that can be conveniently customized. Download it and convince your audience.
-
 Business Revenue Bar Graph With OPEX Details
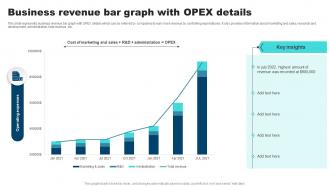
This slide represents business revenue bar graph with OPEX details which can be referred by companies to earn more revenue by controlling expenditures. It also provides information about marketing and sales, research and development, administration, total revenue, etc. Presenting our well-structured Business Revenue Bar Graph With OPEX Details. The topics discussed in this slide are Business Revenue, Bar Graph, OPEX Details. This is an instantly available PowerPoint presentation that can be edited conveniently. Download it right away and captivate your audience.
-
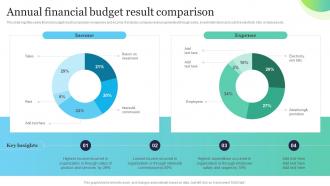 Annual Financial Budget Result Comparison
This slide signifies yearly financial budget result comparison on expense and income. It includes company revenue generated through sales, investment return and cost like electricity bills, employees etc. Introducing our Annual Financial Budget Result Comparison set of slides. The topics discussed in these slides are Annual Financial, Budget, Result Comparison. This is an immediately available PowerPoint presentation that can be conveniently customized. Download it and convince your audience.
-
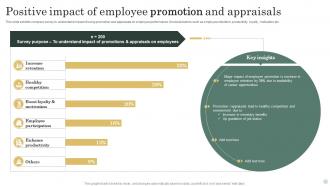 Positive Impact Of Employee Promotion And Appraisals
This slide exhibits company survey to understand impact of using promotion and appraisals on employee performance. It include factors such as employee retention, productivity, loyalty, motivation etc. Introducing our Positive Impact Of Employee Promotion And Appraisals set of slides. The topics discussed in these slides are Increase Retention, Healthy Competition, Employee Participation. This is an immediately available PowerPoint presentation that can be conveniently customized. Download it and convince your audience.
-
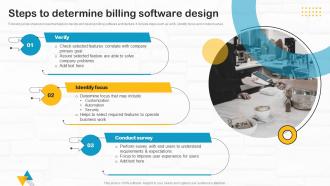 Developing Utility Billing Steps To Determine Billing Software Design
Following slide shows process that helps to decide and develop billing software architecture. It include steps such as verify, identify focus and conduct survey. Introducing Developing Utility Billing Steps To Determine Billing Software Design to increase your presentation threshold. Encompassed with three stages, this template is a great option to educate and entice your audience. Dispence information on Customization, Automation, Security, Requirements And Expectations, using this template. Grab it now to reap its full benefits.
-
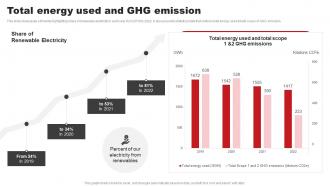 Total Energy Used And Ghg Emission ABB Company Profile CP SS
This slide showcases a timeline highlighting share of renewable electricity in each year from 2019 to 2022. It also presents statistical data that outlines total energy used and total scope of GHG emission. Present the topic in a bit more detail with this Total Energy Used And Ghg Emission ABB Company Profile CP SS. Use it as a tool for discussion and navigation on Share Renewable Electricity, Percent Our, Electricity Renewables. This template is free to edit as deemed fit for your organization. Therefore download it now.
-
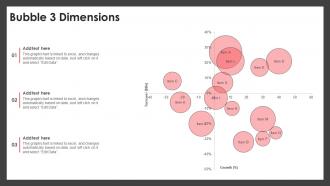 Bubble 3 Dimensions PU CHART SS
Introducing our Bubble 3 Dimensions PU CHART SS set of slides. The topics discussed in these slides are Bubbles 4 Dimensions. This is an immediately available PowerPoint presentation that can be conveniently customized. Download it and convince your audience.
-
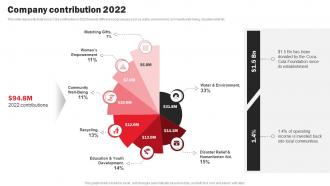 Coca Cola Company Profile Company Contribution 2022 CP SS
This slide represents total Coca Cola contribution in 2022 towards different social causes such as water, environment, community well being, disaster relief etc. Present the topic in a bit more detail with this Coca Cola Company Profile Company Contribution 2022 CP SS Use it as a tool for discussion and navigation on Matching Gifts, Water And Environment, Disaster Relief And Humanitarian This template is free to edit as deemed fit for your organization. Therefore download it now.
-
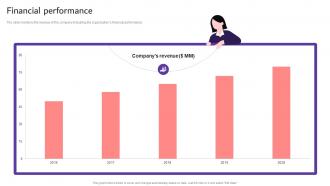 Financial Performance Predictive Index Investor Funding Elevator Pitch Deck
The slide mentions the revenue of the company indicating the organizations financial performance Present the topic in a bit more detail with this Financial Performance Predictive Index Investor Funding Elevator Pitch Deck Use it as a tool for discussion and navigation on Financial Performance This template is free to edit as deemed fit for your organization. Therefore download it now.
-
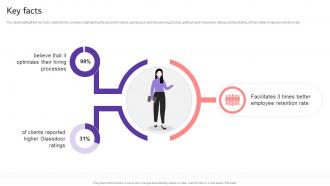 Key Facts Predictive Index Investor Funding Elevator Pitch Deck
The slide highlight the key facts related to the company highlighting the percent of clients agreeing on optimizing hiring process, getting higher Glassdoor ratings and facilitating 3 times better employee retention rate Deliver an outstanding presentation on the topic using this Key Facts Predictive Index Investor Funding Elevator Pitch Deck Dispense information and present a thorough explanation of Processes, Glassdoor Ratings, Employee using the slides given. This template can be altered and personalized to fit your needs. It is also available for immediate download. So grab it now.
-
 Customer Segments Music And Entertainment Company Profile CP SS V
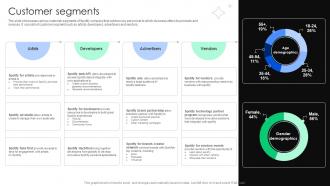
The slide showcases various customer segments of Spotify company that outlines key personnel to which business offers its products and services. It consists of customer segment such as artists, developers, advertisers and vendors. Deliver an outstanding presentation on the topic using this Customer Segments Music And Entertainment Company Profile CP SS V. Dispense information and present a thorough explanation of Customer Segments using the slides given. This template can be altered and personalized to fit your needs. It is also available for immediate download. So grab it now.
-
 Financial Performance Talkable Investor Funding Elevator Pitch Deck
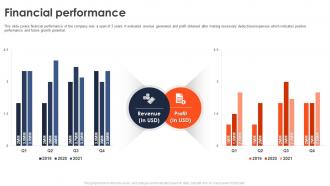
This slide covers financial performance of the company over a span of 3 years. It evaluates revenue generated and profit obtained after making necessary deductions expenses which indicates positive performance and future growth potential. Deliver an outstanding presentation on the topic using this Financial Performance Talkable Investor Funding Elevator Pitch Deck. Dispense information and present a thorough explanation of Financial Performance, Future Growth Potential, Positive Performance using the slides given. This template can be altered and personalized to fit your needs. It is also available for immediate download. So grab it now.
-
 Market Potential Talkable Investor Funding Elevator Pitch Deck
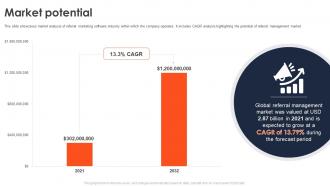
This slide showcases market analysis of referral marketing software industry within which the company operates. It includes CAGR analysis highlighting the potential of referral management market. Deliver an outstanding presentation on the topic using this Market Potential Talkable Investor Funding Elevator Pitch Deck. Dispense information and present a thorough explanation of Market Potential, Management Market, Marketing Software Industry using the slides given. This template can be altered and personalized to fit your needs. It is also available for immediate download. So grab it now.
-
 Market Potential Fundraising Pitch Deck For Mobile Video Editing
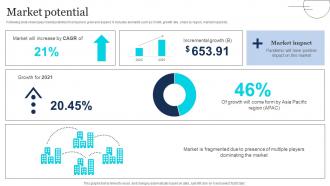
Following slide showcases market potential of company to grow and expand. It includes elements such as CAGR, growth rate, share by region, market impact etc. Present the topic in a bit more detail with this Market Potential Fundraising Pitch Deck For Mobile Video Editing. Use it as a tool for discussion and navigation on Market Potential, Market Impact, Incremental Growth. This template is free to edit as deemed fit for your organization. Therefore download it now.
-
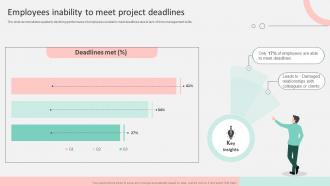 Employees Inability To Meet Project Deadlines Optimizing Operational Efficiency By Time DTE SS
The slide demonstrates quarterly declining performance of employees unable to meet deadlines due to lack of time management skills. Deliver an outstanding presentation on the topic using this Employees Inability To Meet Project Deadlines Optimizing Operational Efficiency By Time DTE SS. Dispense information and present a thorough explanation of Deadlines Met, Key Insights, Clients using the slides given. This template can be altered and personalized to fit your needs. It is also available for immediate download. So grab it now.
-
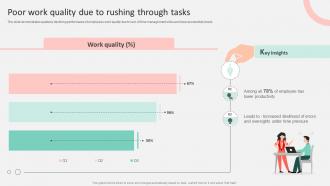 Poor Work Quality Due To Rushing Through Tasks Optimizing Operational Efficiency By Time DTE SS
The slide demonstrates quarterly declining performance of employees work quality due to lack of time management skills and lower productivity levels. Deliver an outstanding presentation on the topic using this Poor Work Quality Due To Rushing Through Tasks Optimizing Operational Efficiency By Time DTE SS. Dispense information and present a thorough explanation of Work Quality, Key Insights using the slides given. This template can be altered and personalized to fit your needs. It is also available for immediate download. So grab it now.
-
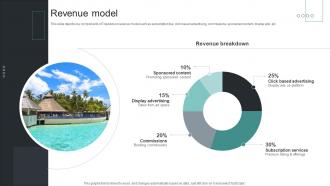 Revenue Model Hotel Booking Company Business Model BMC SS V
This slide depicts key components of TripAdvisor revenue model such as subscription fee, click based advertising, commissions, sponsored content, display ads, etc. Present the topic in a bit more detail with this Revenue Model Hotel Booking Company Business Model BMC SS V. Use it as a tool for discussion and navigation on Click Based Advertising, Subscription Services, Commissions. This template is free to edit as deemed fit for your organization. Therefore download it now.
-
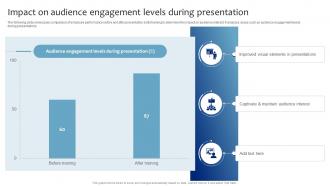 Impact On Audience Engagement Levels During Strategic Presentation Skills Enhancement DTE SS
The following slide showcases comparison of employee performance before and after presentation skills training to determine the impact on audience interest. It analyzes areas such as audience engagement levels during presentations. Present the topic in a bit more detail with this Impact On Audience Engagement Levels During Strategic Presentation Skills Enhancement DTE SS. Use it as a tool for discussion and navigation on Audience Engagement Levels, Improved Visual Elements In Presentations, Captivate And Maintain Audience Interest. This template is free to edit as deemed fit for your organization. Therefore download it now.
-
 49310273 style linear single 2 piece powerpoint presentation diagram infographic slide
Presenting credit card payment icon template PPT slide examples PPT slide. This PPT is widely applicable by a team of managers and business analyst who foresee the business in light of change. It has impressive picture quality with high resolution. 100 percent editable slide design. There is freedom to execute the changes in color, font, text and more as per one’s personal choice. Ease of personalization with your company name and logo. It is compatible with a wide variety of format options and also harmonious with a set of software options, available both online and offline.
-
 80177971 style essentials 2 compare 2 piece powerpoint presentation diagram infographic slide
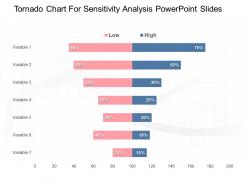
Presenting tornado chart for sensitivity analysis PowerPoint slides PPT slide. This plethora of professionally crafted slides is thoroughly editable. You may modify the content at your personal comfort and need. Personalize it with your company name and logo. You may download and save the presentation in the desired format. PPT is compatible with a wide variety of online and offline software options.
-
 17035707 style essentials 2 compare 5 piece powerpoint presentation diagram infographic slide
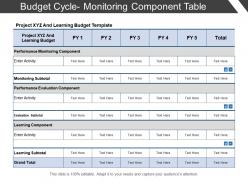
Presenting budget cycle monitoring component table. This is a budget cycle monitoring component table. This is a five stage process. The stages in this process are budget cycle, budget circle, budget process.
-
 38693896 style essentials 2 compare 4 piece powerpoint presentation diagram infographic slide
Presenting this set of slides with name - Project Cost Task Design Development Delivery Management Labor Material. This is a four stage process. The stages in this process are Project Budgeting, Project Financing, Project Cost.
-
 89610198 style essentials 2 financials 4 piece powerpoint presentation diagram infographic slide
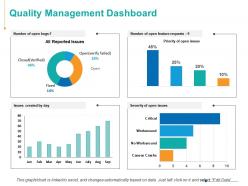
Presenting this set of slides with name - Quality Management Dashboard Marketing Ppt Powerpoint Presentation Infographics Skills. This is a four stage process. The stages in this process are Finance, Analysis, Business, Investment, Marketing.
-
 61862592 style essentials 2 financials 7 piece powerpoint presentation diagram infographic slide
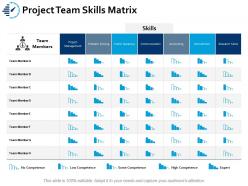
Presenting this set of slides with name - Project Team Skills Matrix Ppt Portfolio Gridlines. This is a seven stage process. The stages in this process are Business, Management, Strategy, Sales, Marketing.
-
 Progress bar dashboard with percentage and numbers
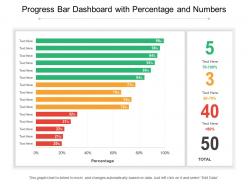
Presenting this set of slides with name Progress Bar Dashboard With Percentage And Numbers. The topics discussed in these slides are Progress Dashboard, Chart And Graph, Finance, Marketing. This is a completely editable PowerPoint presentation and is available for immediate download. Download now and impress your audience.
-
 Business case summary with graph and key findings
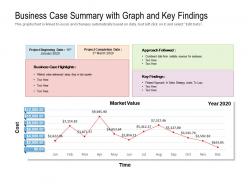
Presenting this set of slides with name Business Case Summary With Graph And Key Findings. The topics discussed in these slides are Business Case Highlights, Approach Followed, Key Findings, Market Value, Cost. This is a completely editable PowerPoint presentation and is available for immediate download. Download now and impress your audience.
-
 Bar graph segmentation showing data bars for market analysis
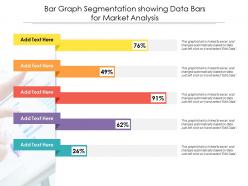
Presenting this set of slides with name Bar Graph Segmentation Showing Data Bars For Market Analysis. The topics discussed in these slide is Bar Graph Segmentation Showing Data Bars For Market Analysis. This is a completely editable PowerPoint presentation and is available for immediate download. Download now and impress your audience.
-
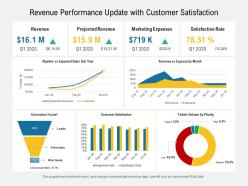 Revenue performance update with customer satisfaction
Presenting this set of slides with name Revenue Performance Update With Customer Satisfaction. The topics discussed in these slides are Revenue, Marketing, Sales. This is a completely editable PowerPoint presentation and is available for immediate download. Download now and impress your audience.
-
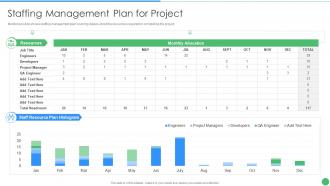 Pmp toolkit it staffing management plan for project
Mentioned slide shows staffing management plan covering details about the resources required for completing the project. Deliver an outstanding presentation on the topic using this Pmp Toolkit It Staffing Management Plan For Project. Dispense information and present a thorough explanation of Staffing Management Plan For Project using the slides given. This template can be altered and personalized to fit your needs. It is also available for immediate download. So grab it now.
-
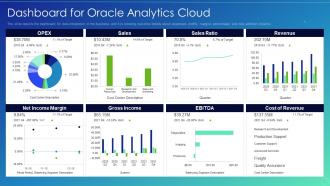 Oracle analytics cloud it dashboard for oracle analytics cloud
This slide depicts the dashboard snapshot for data integration in the business, and it is showing real time details about expenses, profits, margins percentage, and new addition projects. Deliver an outstanding presentation on the topic using this Oracle Analytics Cloud It Dashboard For Oracle Analytics Cloud. Dispense information and present a thorough explanation of Dashboard For Oracle Analytics Cloud using the slides given. This template can be altered and personalized to fit your needs. It is also available for immediate download. So grab it now.
-
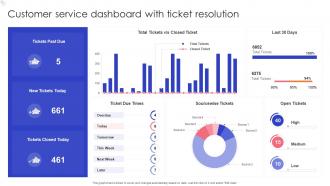 Customer Service Dashboard With Ticket Resolution
Presenting our well structured Customer Service Dashboard With Ticket Resolution. The topics discussed in this slide are Ticket Due Times, Sourcewise Tickets, Open Tickets. This is an instantly available PowerPoint presentation that can be edited conveniently. Download it right away and captivate your audience.
-
 6 Month Content Project Plan Analysis Dashboard
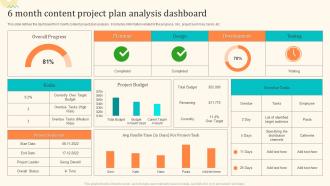
This slide defines the dashboard for 6 month content project plan analysis . it includes information related to the progress, risk , project summary, tasks, etc. Introducing our 6 Month Content Project Plan Analysis Dashboard set of slides. The topics discussed in these slides are Planning, Design, Development, Testing. This is an immediately available PowerPoint presentation that can be conveniently customized. Download it and convince your audience.
-
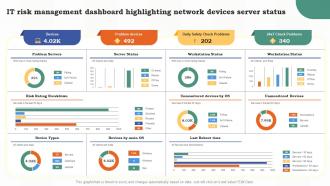 F630 It Risk Management Dashboard Highlighting Network Devices Server Status Risk Assessment Of It Systems
Present the topic in a bit more detail with this F630 It Risk Management Dashboard Highlighting Network Devices Server Status Risk Assessment Of It Systems. Use it as a tool for discussion and navigation on Management, Dashboard, Highlighting. This template is free to edit as deemed fit for your organization. Therefore download it now.
-
 99246640 style essentials 2 financials 4 piece powerpoint presentation diagram infographic slide
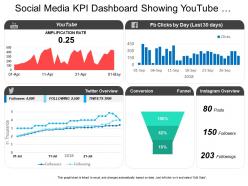
We introduces to you its new Social media KPI dashboard showing YouTube amplification rate conversion PowerPoint template. You can download the business template, edit the data in the excel sheet and the graph changes dynamically. You can add backgrounds to all of the slides. This presentation is available for free download in JPG and PDF format. All the slides in this presentation are fully compatible with Google slides. You can view this document in widescreen size and standard screen size.
-
 Market entry report for transformation of payment solutions through digital mediums complete deck
It has PPT slides covering wide range of topics showcasing all the core areas of your business needs. This complete deck focuses on Market Entry Report For Transformation Of Payment Solutions Through Digital Mediums Complete Deck and consists of professionally designed templates with suitable graphics and appropriate content. This deck has total of fifty eight slides. Our designers have created customizable templates for your convenience. You can make the required changes in the templates like colour, text and font size. Other than this, content can be added or deleted from the slide as per the requirement. Get access to this professionally designed complete deck PPT presentation by clicking the download button below.
-
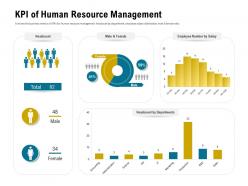 Kpi of human resource management headcount ppt powerpoint layouts example
It shows the business metrics and KPIs for human resource management headcount by department, employee salary distribution, male and female ratio. Presenting this set of slides with name KPI Of Human Resource Management Headcount Ppt Powerpoint Layouts Example. The topics discussed in these slides are Accounting, Administration, Finance, Marketing, Sales. This is a completely editable PowerPoint presentation and is available for immediate download. Download now and impress your audience.
-
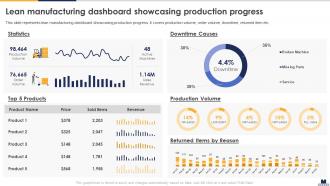 Lean Manufacturing Dashboard Showcasing Production Progress Implementing Lean Production
This slide represents lean manufacturing dashboard showcasing production progress. It covers production volume, order volume, downtime, returned item etc. Present the topic in a bit more detail with this Lean Manufacturing Dashboard Showcasing Production Progress Implementing Lean Production. Use it as a tool for discussion and navigation on Statistics, Downtime Causes, Production Volume. This template is free to edit as deemed fit for your organization. Therefore download it now.
-
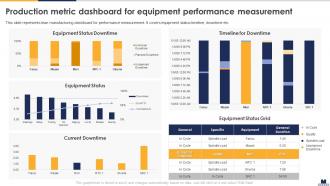 Production Metric Dashboard Implementing Lean Production
This slide represents lean manufacturing dashboard for performance measurement. It covers equipment status timeline, downtime etc. Deliver an outstanding presentation on the topic using this Production Metric Dashboard Implementing Lean Production. Dispense information and present a thorough explanation of Equipment Status Downtime, Equipment Status Grid, Timeline For Downtime using the slides given. This template can be altered and personalized to fit your needs. It is also available for immediate download. So grab it now.
-
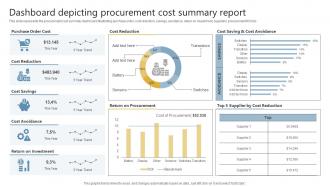 Dashboard Depicting Procurement Cost Summary Report
This slide represents the procurement cost summary dashboard illustrating purchase order, cost reduction, savings, avoidance, return on investment, suppliers, procurement ROI etc. Presenting our well structured Dashboard Snapshot Depicting Procurement Cost Summary Report. The topics discussed in this slide are Purchase Order Cost, Cost Reduction, Cost Savings. This is an instantly available PowerPoint presentation that can be edited conveniently. Download it right away and captivate your audience.
-
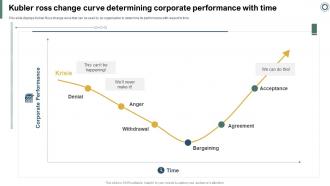 Effectively Handling Crisis To Restore Kubler Ross Change Curve Determining Corporate
This slide displays Kubler Ross change curve that can be used by an organization to determine its performance with respect to time. Present the topic in a bit more detail with this Effectively Handling Crisis To Restore Kubler Ross Change Curve Determining Corporate. Use it as a tool for discussion and navigation on Bargaining, Acceptance, Withdrawal, Corporate Performance. This template is free to edit as deemed fit for your organization. Therefore download it now.


