8374040 style essentials 2 financials 2 piece powerpoint presentation diagram infographic slide
Continue giving your absolute best with our Absenteeism Rate By Days Data Driven Bar Graph Powerpoint Show. They help you carry the baton forward.
Continue giving your absolute best with our Absenteeism Rate By Days Data Driven Bar Graph Powerpoint Show. They help you c..
- Google Slides is a new FREE Presentation software from Google.
- All our content is 100% compatible with Google Slides.
- Just download our designs, and upload them to Google Slides and they will work automatically.
- Amaze your audience with SlideTeam and Google Slides.
-
Want Changes to This PPT Slide? Check out our Presentation Design Services
- WideScreen Aspect ratio is becoming a very popular format. When you download this product, the downloaded ZIP will contain this product in both standard and widescreen format.
-

- Some older products that we have may only be in standard format, but they can easily be converted to widescreen.
- To do this, please open the SlideTeam product in Powerpoint, and go to
- Design ( On the top bar) -> Page Setup -> and select "On-screen Show (16:9)” in the drop down for "Slides Sized for".
- The slide or theme will change to widescreen, and all graphics will adjust automatically. You can similarly convert our content to any other desired screen aspect ratio.
Compatible With Google Slides

Get This In WideScreen
You must be logged in to download this presentation.
PowerPoint presentation slides
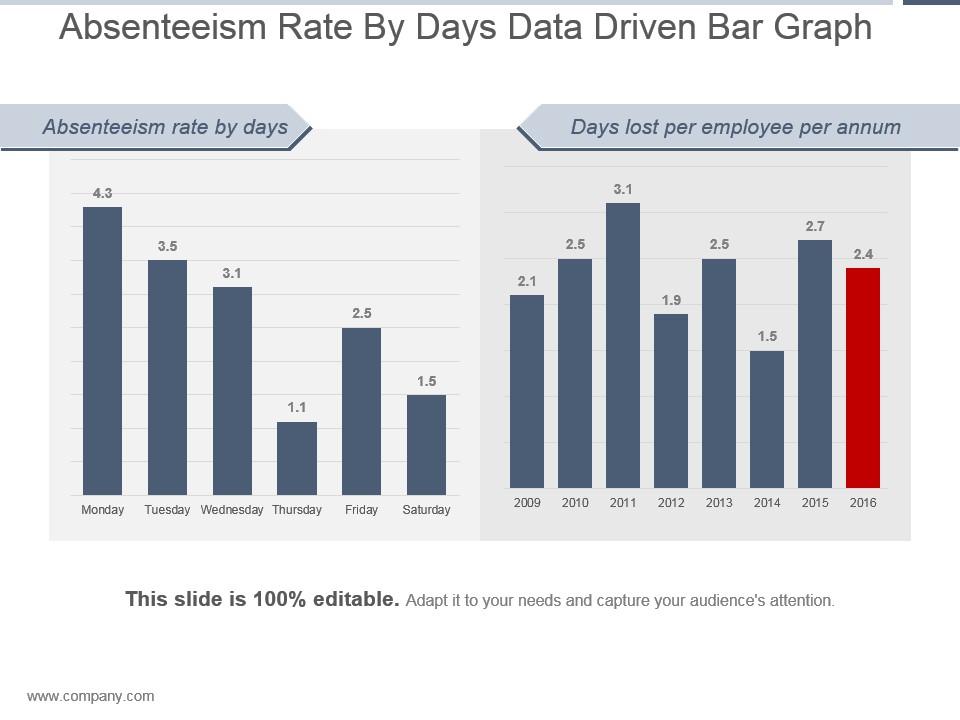
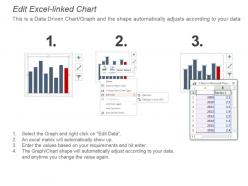
Presenting absenteeism rate by days data driven bar graph powerpoint show. This is a absenteeism rate by days data driven bar graph powerpoint show. This is a two stage process. The stages in this process are absenteeism rate by days, days lost per employee per annum, monday, tuesday, wednesday, thursday, friday, saturday.
8374040 style essentials 2 financials 2 piece powerpoint presentation diagram infographic slide with all 5 slides:
Convince folks to discard any bias with our Absenteeism Rate By Days Data Driven Bar Graph Powerpoint Show. It helps identify acts of discrimination.
-
Commendable slides with attractive designs. Extremely pleased with the fact that they are easy to modify. Great work!
-
Amazing product with appealing content and design.


