Impressive All Essential 3 step financial PPT Templates
-
 43839871 style essentials 2 financials 3 piece powerpoint presentation diagram template slide
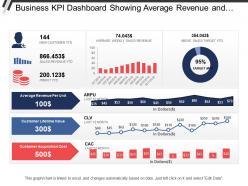
Presenting this set of slides with name - Business Kpi Dashboard Showing Average Revenue And Clv. This is a three stage process. The stages in this process are Business Dashboard, Business Kpi, Business Performance.
-
 Technological Advancement For Unlocking Digital Wallets All You Need Fin SS
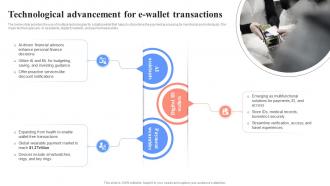
The below slide provides the use of multiple technologies for a digital wallet that helps to streamline the payment processing for merchants and individuals. The major technologies are AI assistants, digital ID wallets, and payment wearables. Increase audience engagement and knowledge by dispensing information using Technological Advancement For Unlocking Digital Wallets All You Need Fin SS. This template helps you present information on three stages. You can also present information on AI Assistants, Digital Id Wallets, Payment Wearables using this PPT design. This layout is completely editable so personaize it now to meet your audiences expectations.
-
 28908029 style concepts 1 growth 3 piece powerpoint presentation diagram infographic slide
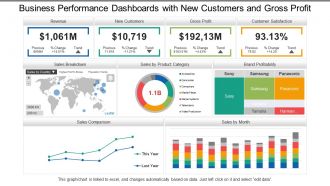
Presenting, business performance dashboards Snapshot with new customers and gross profit PowerPoint ideas for your ease. Information based slides, creating an impact on the viewer, can be used by specialists from any background, entrepreneurs, and scholars. Engaging and editable font style, type, text design and the content of the icons or the PPT slides. Full-screen view choice available and can be transformed into the desired format. Compatible with Google Slides. Open in widescreen size 16:9 after downloading.
-
 23296329 style essentials 2 financials 3 piece powerpoint presentation diagram infographic slide
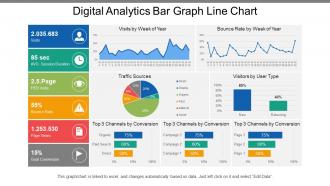
Presenting this set of slides with name - Digital Analytics Bar Graph Line Chart. This is a five stage process. The stages in this process are Digital Analytics, Digital Dashboard, Digital Kpis.
-
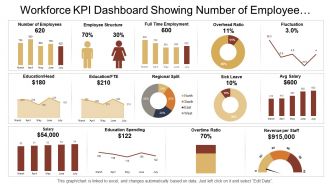 10954454 style essentials 2 financials 3 piece powerpoint presentation diagram infographic slide
Presenting this set of slides with name - Workforce Kpi Dashboard Showing Number Of Employee Overhead Ratio And Salary. This is a three stage process. The stages in this process are Staff, Personnel, Workforce.
-
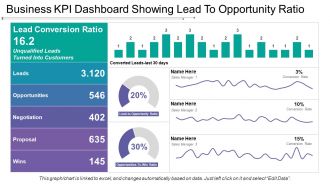 48662031 style essentials 2 financials 3 piece powerpoint presentation diagram infographic slide
Presenting this set of slides with name - Business Kpi Dashboard Showing Lead To Opportunity Ratio. This is a three stage process. The stages in this process are Business Dashboard, Business Kpi, Business Performance.
-
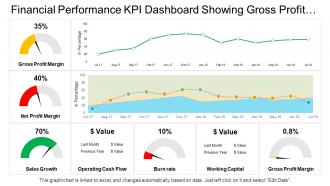 65012062 style essentials 2 dashboard 3 piece powerpoint presentation diagram infographic slide
Presenting this set of slides with name - Financial Performance Kpi Dashboard Showing Gross Profit Margin Sales Growth Operating Cash Flow. This is a three stage process. The stages in this process are Financial Performance, Financial Report, Financial Review.
-
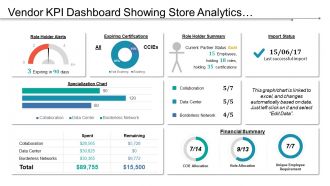 56892716 style essentials 2 financials 3 piece powerpoint presentation diagram infographic slide
Presenting Vendor KPI Dashboard Showing Role Holder Alerts And Specialization Chart Pictures PPT slide. This presentation design has been professionally designed, is fully editable in PowerPoint and is compatible with Google slides as well. The font type, font size, colors of the diagrams, background color are customizable and the company logo can be added too. High quality graphs, charts, tables and icons ensure that there is no deteriorating in quality on enlarging their size. Fast download at click of a button.
-
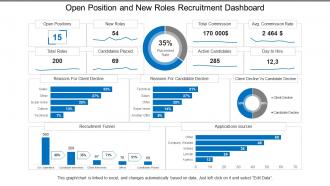 91742764 style essentials 2 financials 3 piece powerpoint presentation diagram infographic slide
Presenting this set of slides with name - Open Position And New Roles Recruitment Dashboard. This is a three stage process. The stages in this process are Staffing Plan, Recruitment, Staff Management.
-
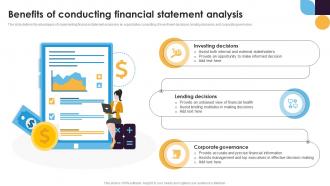 Benefits Of Conducting Financial Statement Analysis For Improving Business Fin SS
This slide defines the advantages of implementing financial statement analysis in an organization consisting of investment decisions, lending decisions, and corporate governance. Increase audience engagement and knowledge by dispensing information using Benefits Of Conducting Financial Statement Analysis For Improving Business Fin SS. This template helps you present information on three stages. You can also present information on Investing Decisions, Lending Decisions, Corporate Governance using this PPT design. This layout is completely editable so personaize it now to meet your audiences expectations.
-
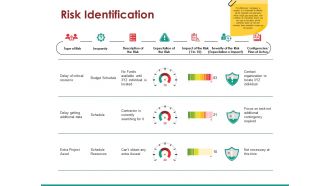 70481860 style essentials 2 financials 3 piece powerpoint presentation diagram infographic slide
Presenting this set of slides with name - Risk Identification Ppt Examples. This is a three stage process. The stages in this process are Type Of Risk, Jeopardy, Description Of The Risk, Expectation Of The Risk.
-
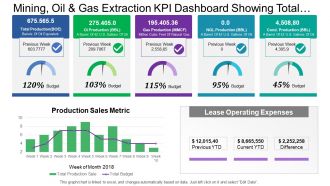 69223260 style essentials 2 financials 3 piece powerpoint presentation diagram infographic slide
Presenting this set of slides with name - Mining Oil And Gas Extraction Kpi Dashboard Showing Total Production And Budget. This is a three stage process. The stages in this process are Mining, Oil And Gas Extraction, Refinery, Natural Gas.
-
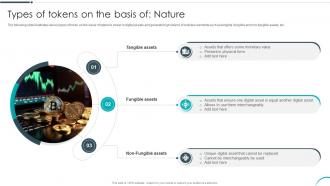 Types Of Tokens On The Basis Of Nature Revolutionizing Investments With Asset BCT SS
The following slide illustrates various types of token on the basis of nature to invest in digital assets and generate high returns. It includes elements such as tangible, fungible and non-fungible assets, etc. Introducing Types Of Tokens On The Basis Of Nature Revolutionizing Investments With Asset BCT SS to increase your presentation threshold. Encompassed with three stages, this template is a great option to educate and entice your audience. Dispence information on Tangible Assets, Fungible Assets, Non-Fungible Assets, using this template. Grab it now to reap its full benefits.
-
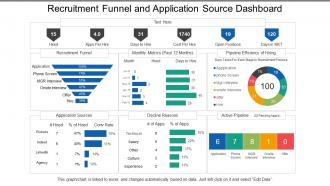 70650808 style division donut 3 piece powerpoint presentation diagram infographic slide
Presenting this set of slides with name - Recruitment Funnel And Application Source Dashboard. This is a three stage process. The stages in this process are Staffing Plan, Recruitment, Staff Management.
-
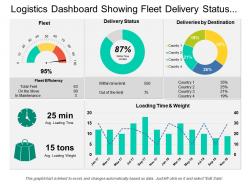 181595 style essentials 2 financials 3 piece powerpoint presentation diagram infographic slide
Presenting this set of slides with name - Logistics Dashboard Showing Fleet Delivery Status And Delivery By Destination. This is a three stage process. The stages in this process are Logistics Dashboard, Logistics Kpis, Logistics Performance.
-
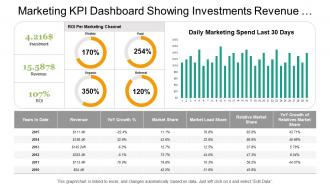 2166426 style division donut 3 piece powerpoint presentation diagram infographic slide
Presenting marketing kpi dashboard showing investments revenue metrics details presentation template slide. The PPT template is very user friendly as it allows you to make numerous changes to the editable slides. You can amend the font size, font style and also the font color as per your requirements. Template slide can be downloaded quickly and cab be saved in format of PDF or JPG easily. The template slide after being downloaded can be viewed in large screen display ratio of 16:9 or standard size display ratio of 4:3.
-
 68619290 style essentials 2 financials 3 piece powerpoint presentation diagram template slide
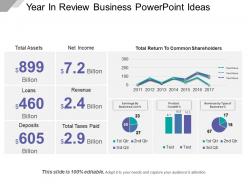
Presenting Year In Review Business PowerPoint Ideas. Get this Excel linked PPT slide and deliver quality presentations to your audience. You are free to make changes in any part of the slide. Modify the colors as per your choice, change the font type and font size and save this in JPG and PDF formats. This is entirely compatible with Google Slides and can be viewed on the standard screen and widescreen.
-
 52378135 style essentials 2 financials 3 piece powerpoint presentation diagram infographic slide
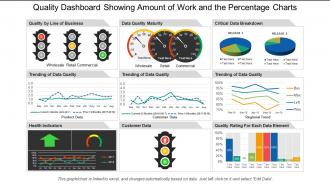
SlideTeam feels immense pleasure in presenting to you its 100% customizable and user-friendly quality dashboard snapshot showing customer data with data quality. The business slides can be viewed in widescreen display ratio of 16:9 or standard size display ratio of 4:3 after being downloaded. The PPT presentation lets you insert or remove any given feature from the redesigned set of slides. You can also save the slideshow in format of PDF or JPG and also it is compatible with Google Slides. So hit download, edit it and present it.
-
 1840576 style division pie 3 piece powerpoint presentation diagram infographic slide
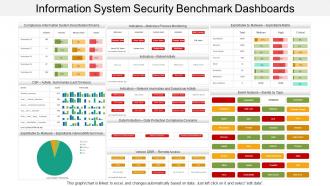
Presenting this set of slides with name - Information System Security Benchmark Dashboards. This is a three stage process. The stages in this process are Information Security Strategy, Information Security Plan, Information Protection Strategy.
-
 19875835 style essentials 2 financials 3 piece powerpoint presentation diagram infographic slide
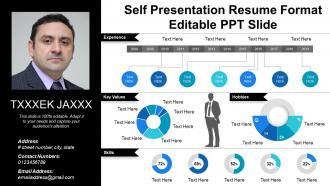
Presenting self presentation resume format editable PPT slide which is thoroughly editable, data driven i.e. excel linked and fast to download. The presenter can customize and personalize this PPT slide it to meet his / her own specifications. This presentation has been designed by plethora of professional expertise. This PowerPoint shape is fully compatible with Google Slides, multiple software and format options. This slideshow can be saved as JPG and / or in PDF. For your kind assistance, editing instructions are also provided.
-
 45331976 style essentials 2 financials 3 piece powerpoint presentation diagram infographic slide
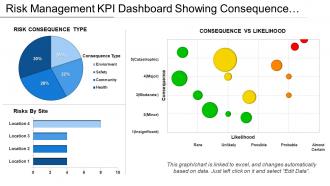
Presenting this set of slides with name - Risk Management Kpi Dashboard Showing Consequence Vs Likelihood. This is a three stage process. The stages in this process are Risk Management, Risk Assessment, Project Risk.
-
 47708867 style division donut 3 piece powerpoint presentation diagram infographic slide
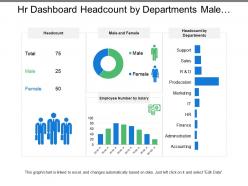
Presenting this set of slides with name - Hr Dashboard Headcount By Departments Male And Female. This is a three stage process. The stages in this process are Hr Dashboard, Human Resource Dashboard, Hr Kpi.
-
 41575495 style division donut 3 piece powerpoint presentation diagram infographic slide
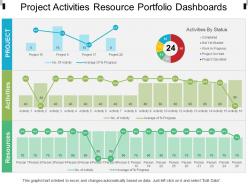
Pre-designed project activities resource portfolio dashboards PPT template. Beneficial for managers, professors, marketers, etc. Flexible option for conversion in PDF or JPG formats. Available in Widescreen format also. Useful for making business plan and strategies. Can also be used with Google slides. Replace the images, text and the content in the slide design. Change the size, style and orientation of the slides. Use your company’s name or brand name to make it your own presentation template.
-
 66212918 style essentials 2 financials 3 piece powerpoint presentation diagram infographic slide
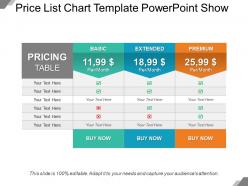
Presenting price list chart template PowerPoint show slideshow which is 100% editable. This PPT template is crafted with attractive display and unique components. This PPT slide is easy to customize and enables you to personalize it as per your own criteria. The presentation slide is fully compatible with Google slides, multiple format and software options. In case of any assistance, kindly take instructions from our presentation design services and it is easy to download in a very short span of time. The images, layouts, designs are of high quality and ensures quality in widescreen.
-
 22987331 style division donut 3 piece powerpoint presentation diagram infographic slide
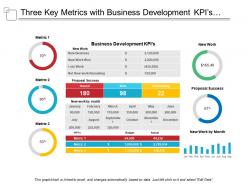
Presenting this set of slides with name - Three Key Metrics With Business Development Kpis And Proposal Success. This is a three stage process. The stages in this process are Key Metrics, Key Performance Indicator, Kpi.
-
 88663825 style essentials 2 financials 3 piece powerpoint presentation diagram infographic slide
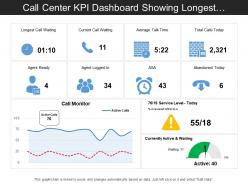
Presenting this set of slides with name - Call Center Kpi Dashboard Showing Longest Call Waiting And Average Talk Time. This is a three stage process. The stages in this process are Call Center Agent, Customer Care, Client Support.
-
 5033807 style essentials 2 financials 3 piece powerpoint presentation diagram infographic slide
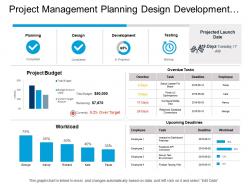
Easy get with different nodes and stages as required. Amendable presentation design comes with amazing picture quality. Modification is possible with color, text, font and shape. Prompt download and can be changed in JPEG and PDF format. Gives specialized effect to your Presentation template. PowerPoint slide exhibited in standard and widescreen view. Alternate to customize the design by adding business name, icon and symbol. PPT slide can be shared with Google slides as works merge well with them.
-
 35658620 style division donut 3 piece powerpoint presentation diagram infographic slide
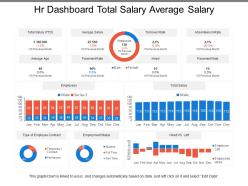
Presenting this set of slides with name - Hr Dashboard Total Salary Average Salary. This is a three stage process. The stages in this process are Hr Dashboard, Human Resource Dashboard, Hr Kpi.
-
 47966171 style essentials 2 dashboard 3 piece powerpoint presentation diagram infographic slide
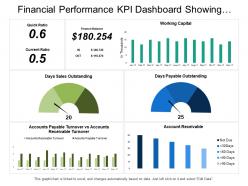
Presenting this set of slides with name - Financial Performance Kpi Dashboard Showing Quick Ratio Current Ratio Working Capital. This is a three stage process. The stages in this process are Financial Performance, Financial Report, Financial Review.
-
 27510320 style essentials 2 financials 3 piece powerpoint presentation diagram infographic slide
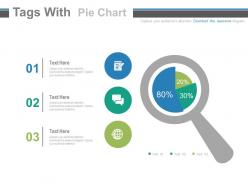
Most appropriate for using the presentation slides for comparison purpose. Use of magnifier make the content appears specifically. Constructive for the users like business and finance professionals. Unique icons have been used for the purpose of making the content attractive. Prepared by professional experts keeping in mind feature of creativity. Crafted with crucial graphics and noticeable diagrams. Fitted with innovative images scheming three tags slides.
-
 20839668 style essentials 2 financials 3 piece powerpoint presentation diagram infographic slide
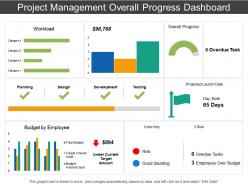
Preference to amend and personalize the PPT slide by adding business details i.e. name, logo, image or even tag line. Quick download and can be shared with large audience. Staggering balance colors, font and shape. Comparable Presentation design comes with different nodes and stages. Familiar with Google slides and easy to alter into JPEG and PDF.PPT diagram can be shared in both standard and widescreen view depending upon your requirement. High resolution and tremendous quality PowerPoint template
-
 8807472 style essentials 2 financials 3 piece powerpoint presentation diagram infographic slide
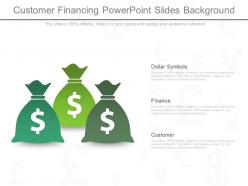
Widescreen output without the problem of pixilation. Thoroughly editable content. Modify the colors, orientation and font as per preference. Add company name and logo for maximum personalization. Comfort of incorporation or exclusion of details in slide background. Ease of download and compatibility with varied software. Significantly useful PowerPoint slide design for all those in the field of loan management, retail management, organizational development, communication and sales. The stages in this process are dollar symbols, finance, customer.
-
 46346874 style essentials 2 financials 3 piece powerpoint presentation diagram infographic slide
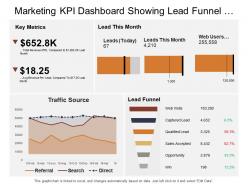
Presenting this set of slides with name - Marketing Kpi Dashboard Snapshot Showing Lead Funnel Traffic Sources Key Metrics. This is a three stage process. The stages in this process are Marketing, Branding, Promoting.
-
 33831915 style essentials 2 financials 3 piece powerpoint presentation diagram infographic slide
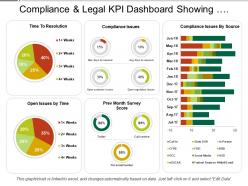
Presenting this set of slides with name - Compliance And Legal Kpi Dashboard Showing Compliance Issues And Resolution Time. This is a three stage process. The stages in this process are Compliance And Legal, Legal Governance, Risk Management.
-
 39194419 style essentials 2 financials 3 piece powerpoint presentation diagram infographic slide
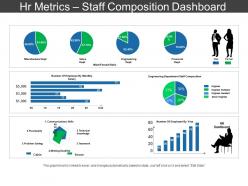
Presenting HR Metrics Staff Composition Dashboard Sample PPT Files which is completely editable. You can open and save your presentation in various formats like PDF, JPG, and PNG. Freely access this template in both 4:3 and 16:9 aspect ratio. Change the color, font, font size, and font type of the slides as per your requirements. This template is adaptable with Google Slides which makes it easily accessible at once.
-
 58857034 style essentials 2 financials 3 piece powerpoint presentation diagram infographic slide
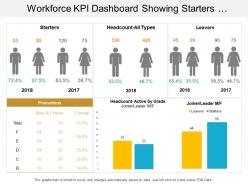
Presenting this set of slides with name - Workforce Kpi Dashboard Showing Starters Headcount Leavers Promotions And Joiners. This is a three stage process. The stages in this process are Staff, Personnel, Workforce.
-
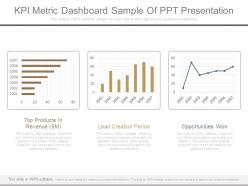 71552935 style essentials 2 financials 3 piece powerpoint presentation diagram template slide
Presenting kpi metric dashboard sample of ppt presentation. This is a kpi metric dashboard sample of ppt presentation. This is a three stage process. The stages in this process are top products in revenue, lead creation period, opportunities won.
-
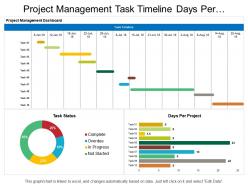 50011220 style division donut 3 piece powerpoint presentation diagram infographic slide
Introducing project management task timeline days per project dashboard PPT template. Access to convert the presentation design into JPG and PDF. Offer 100% access to change the values, size and style of the slides once downloaded and saved in the desired format. High quality charts, images and visuals used in the designing process. Choice to get presentation slide in standard or in widescreen view. Easy to convert in JPEG and PDF document. Compatible with Google slides. Easy and hassle-free downloading process.
-
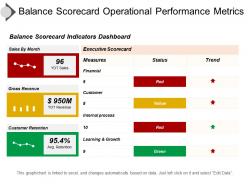 91369835 style essentials 2 financials 3 piece powerpoint presentation diagram template slide
Presenting Balance Scorecard Operational Performance Metrics Ppt Icon. You can save it into other formats like JPG & PDF after downloading this slide. You can easily represent the design in the standard or widescreen view. The template is compatible with Google Slides and editable in PowerPoint too. You can do modification in the color, text, font size, font type, diagram and aspect ratio of this slide. Sharing the template with a large segment become easy because of its splendid pixel quality. A user can easily add the related information in text placeholder of this slide.
-
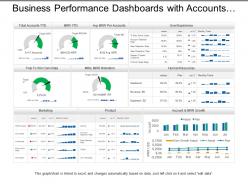 99854468 style essentials 2 dashboard 3 piece powerpoint presentation diagram infographic slide
Presenting, our business performance dashboards snapshot with accounts and mr growth PPT layout. High pixel resolution of the designs. Easy to edit and save using google slides. 100% modification of the slides granted. Apply your company name, replacing the official trademark in the slides. Valuable for the Marketing Professionals, business managers, and the directors. Includes extensive text spaces to include a title and can be easily projected to a widescreen.
-
 51719270 style essentials 2 dashboard 3 piece powerpoint presentation diagram infographic slide
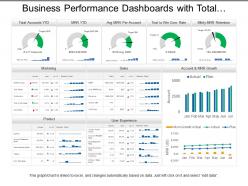
Presenting, business performance dashboards with total accounts marketing and product PowerPoint template. High-resolution PPT slide to reflect on business performance. The content is accurate and ready to use. Modifiable framework, layout, and font type, font size, and color schemes. Can be quickly transformed into PDF and JPG format. Appealing graphs for illustration and captivating figures to illustrate the idea. Can be extended to widescreen without loss of quality. Compatible with Google Slides and widescreens.
-
 Relocation Allowance To Reduce Financial Stress Icon
Presenting our set of slides with Relocation Allowance To Reduce Financial Stress Icon This exhibits information on three stages of the process. This is an easy to edit and innovatively designed PowerPoint template. So download immediately and highlight information on Relocation Allowance, Reduce Financial Stress Icon
-
 93288526 style essentials 2 financials 3 piece powerpoint presentation diagram infographic slide
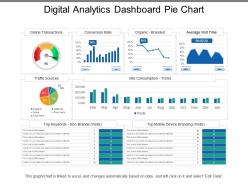
Presenting this set of slides with name - Digital Analytics Dashboard Pie Chart. This is a five stage process. The stages in this process are Digital Analytics, Digital Dashboard, Digital Kpis.
-
 97549429 style essentials 2 financials 3 piece powerpoint presentation diagram infographic slide
Presenting this set of slides with name - Business Kpi Dashboard Showing Marketing Spend And Return On Investment. This is a three stage process. The stages in this process are Business Dashboard, Business Kpi, Business Performance.
-
 10106722 style essentials 2 financials 3 piece powerpoint presentation diagram infographic slide
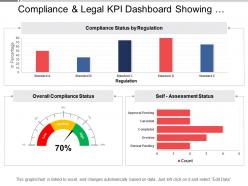
Presenting this set of slides with name - Compliance And Legal Kpi Dashboard Showing Overall Compliance Status. This is a three stage process. The stages in this process are Compliance And Legal, Legal Governance, Risk Management.
-
 22338896 style concepts 1 growth 3 piece powerpoint presentation diagram infographic slide
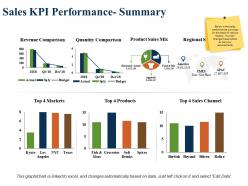
Presenting this set of slides with name - Sales Kpi Performance Summary Revenue Comparison Product Sales Mix. This is a three stage process. The stages in this process are Revenue Comparison, Quantity Comparison, Product Sales Mix, Regional Sales Mix, Top Sales Channel.
-
 51934077 style essentials 2 financials 3 piece powerpoint presentation diagram infographic slide
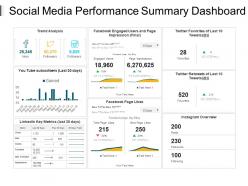
Presenting Social Media Performance Summary Dashboard Presentation Pictures PPT slide. This presentation design has been professionally designed, is fully editable in PowerPoint and is compatible with Google slides as well. You can customize the font type, font size, colors of the diagram, background color and add the company logo. High quality graphs, charts, tables and icons ensure that there is no deteriorating in quality on enlarging their size. Fast download at click of a button.
-
 22511509 style essentials 2 financials 3 piece powerpoint presentation diagram infographic slide
Presenting this set of slides with name - Marketing Kpi Dashboard Showing Visits Traffic Sources And Bounce Rate. This is a three stage process. The stages in this process are Marketing, Branding, Promoting.
-
 66854364 style essentials 2 financials 3 piece powerpoint presentation diagram infographic slide
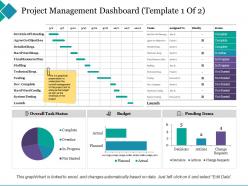
Presenting this set of slides with name - Project Management Dashboard Agree On Objectives. This is a three stage process. The stages in this process are Final Resource Plan, Agree On Objectives, System Testing.
-
 75062245 style essentials 2 financials 3 piece powerpoint presentation diagram infographic slide
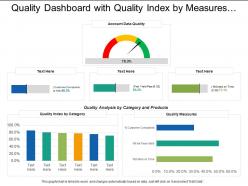
Presenting this set of slides with name - Quality Dashboard With Quality Index By Measures And Quality Index. This is a three stage process. The stages in this process are Quality Dashboard, Quality Kpi, Quality Metircs.
-
 77288941 style essentials 2 financials 3 piece powerpoint presentation diagram infographic slide
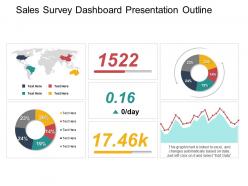
Presenting sales survey dashboard snapshot presentation outline. The slideshow is fully flexible. You can incorporate them into any PowerPoint without worrying about compatibilities. It is fully compatible with Google Slides and Microsoft PowerPoint. Except this, you will get full versatility. PPT can be downloaded into JPEG and PDF formats. You can modify and personalize the design the way you want. All the design elements are 100% editable.
-
 71908706 style essentials 2 financials 3 piece powerpoint presentation diagram infographic slide
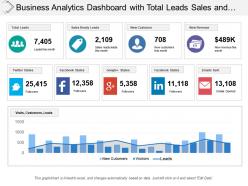
This is a three stage process. The stages in this process are Business Analytics, BA, Organizations Data.
-
 18224459 style essentials 2 financials 3 piece powerpoint presentation diagram infographic slide
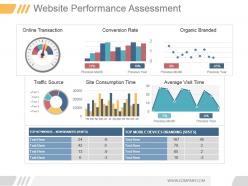
Presenting website performance assessment powerpoint ideas. This is a website performance assessment powerpoint ideas. This is a three stage process. The stages in this process are online transaction, conversion rate, organic branded, traffic, source, site consumption time, average visit time, previous month, previous year, top keywords non branded visits, top mobile devices branding visits.
-
 12396883 style essentials 2 financials 3 piece powerpoint presentation diagram infographic slide
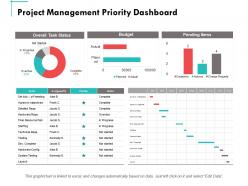
Presenting this set of slides with name - Project Management Priority Dashboard Ppt Powerpoint Presentation Summary Slide Download. This is a two stages process. The stages in this process are Finance, Marketing, Management, Investment, Analysis.
-
 90426821 style essentials 2 dashboard 3 piece powerpoint presentation diagram template slide
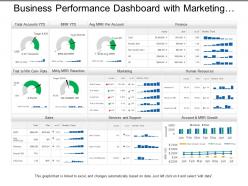
Presenting, business performance dashboard with marketing human resource and sales PPT deck. This PPT deck focuses on one of the aspects of business marketing with content broadly researched by our business research team. Quickly editable color combinations, layout, text boxes, and font. Alluring graphs for illustration with relatable images to explain the concept. Transform into PDF and JPG format at ease. Predesigned content is adaptable and can be projected to widescreen for business meetings.
-
 63031800 style essentials 2 financials 3 piece powerpoint presentation diagram infographic slide
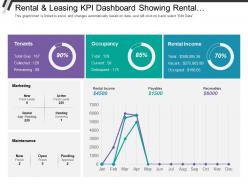
As this PPT presentation is fully editable you change the size, orientation and color of the various graphical illustrations used in the pre-designed slides. You can edit the font size, font color and even the font style of the text used here. After you download the slideshow you can view it in standard size display ratio of 4:3 or widescreen display ratio of 16:9 conveniently. Any changes that you need to make can be made following instructions given in the sample slides.
-
 38249005 style division pie 3 piece powerpoint presentation diagram infographic slide
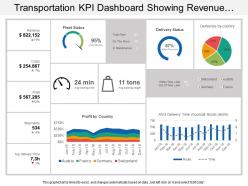
Presenting KPI dashboard snapshot showing revenue costs profit fleet status slideshow. Change PowerPoint structure, font, text, color and design as per your requirements. Easy to input data with excel linked charts, just right to click to input data. This presentation theme is totally attuned with Google slides. Easy conversion to other software’s like JPG and PDF formats. Image quality of these PPT diagram remains the unchanged even when you resize the image or portray on large screens.
-
 11456186 style essentials 2 financials 3 piece powerpoint presentation diagram infographic slide
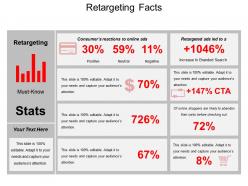
Presenting retargeting facts PowerPoint slide clipart PowerPoint template which is completely editable. The PPT is used by business analysts, business managers, sales managers etc. The PowerPoint presentation is compatible with multiple software and format options and with Google Slides also. Editing instructions are also provided for your kind assistance. The user can easily customize and personalize this slideshow as per his / her requirements. The visuals being of good quality do not pixelate when this PPT slide is projected on the wide screen.
-
 90203367 style essentials 2 financials 3 piece powerpoint presentation diagram infographic slide
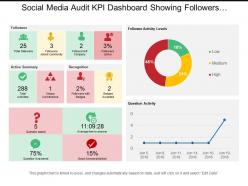
This PPT template is very useful for your business PowerPoint presentation. It is fully editable and has editable features like editable font, font size, font color, etc. There are many shapes to choose from like squares, triangles, circles, rectangles, pentagon and many more shapes in order to edit this presentation in PowerPoint. All the images in this PPT are 100% editable. The excel-linked charts in this PPT template can also be edited with ease. It can be viewed and saved in JPG or PDF format. It is fully compatible with Google slides as well.
-
 51364766 style essentials 2 financials 3 piece powerpoint presentation diagram infographic slide
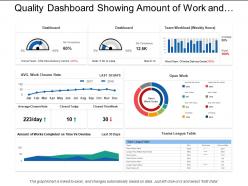
SlideTeam presents to you its quality dashboard showing amount of work and the percentage charts.You can also alter the font size, font color and font style of the text so used in the slides. The business template can be saved in format of PDF or JPG as per your requirements. So download this slideshow and make most of it.


