63424185 style essentials 2 financials 3 piece powerpoint presentation diagram template slide
Define your brand with our Business Data Visualization Percentage Ratio Comparison Chart. Gain a lot from the association.
Define your brand with our Business Data Visualization Percentage Ratio Comparison Chart. Gain a lot from the association.
- Google Slides is a new FREE Presentation software from Google.
- All our content is 100% compatible with Google Slides.
- Just download our designs, and upload them to Google Slides and they will work automatically.
- Amaze your audience with SlideTeam and Google Slides.
-
Want Changes to This PPT Slide? Check out our Presentation Design Services
- WideScreen Aspect ratio is becoming a very popular format. When you download this product, the downloaded ZIP will contain this product in both standard and widescreen format.
-

- Some older products that we have may only be in standard format, but they can easily be converted to widescreen.
- To do this, please open the SlideTeam product in Powerpoint, and go to
- Design ( On the top bar) -> Page Setup -> and select "On-screen Show (16:9)” in the drop down for "Slides Sized for".
- The slide or theme will change to widescreen, and all graphics will adjust automatically. You can similarly convert our content to any other desired screen aspect ratio.
Compatible With Google Slides

Get This In WideScreen
You must be logged in to download this presentation.
PowerPoint presentation slides
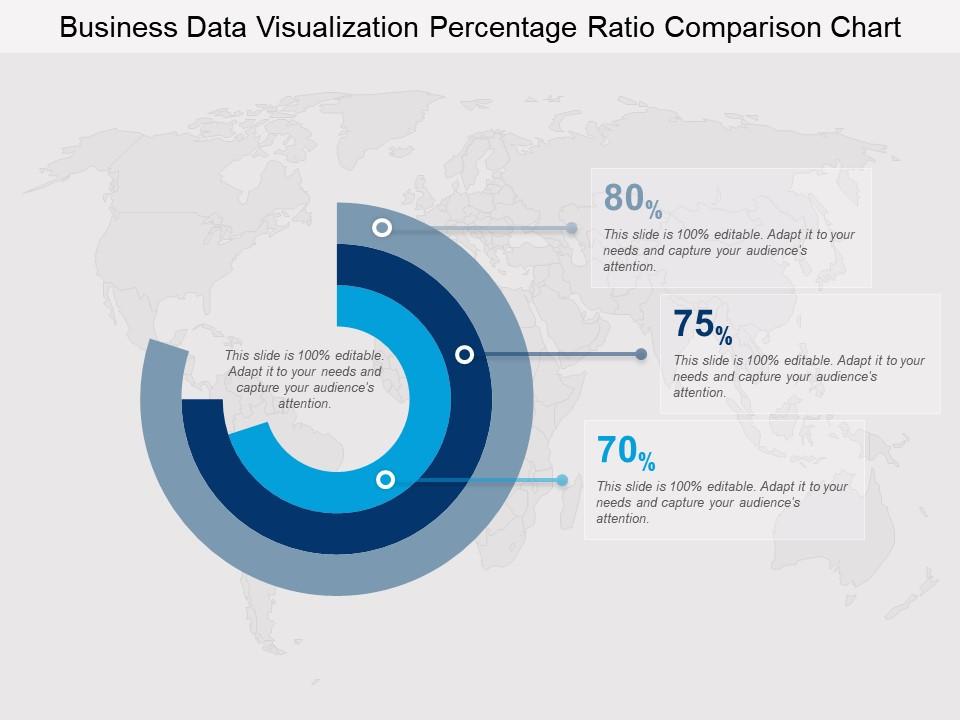
Presenting this set of slides with name - Business Data Visualization Percentage Ratio Comparison Chart. This is a three stage process. The stages in this process are Data Visualization, Data Management, Data Representation.
63424185 style essentials 2 financials 3 piece powerpoint presentation diagram template slide with all 6 slides:
Activate our Business Data Visualization Percentage Ratio Comparison Chart with a few clicks. You will never have to pull your hair.
No Reviews


