69251986 style essentials 2 financials 3 piece powerpoint presentation diagram infographic slide
Get folks aware of your jubilee celebrations with our Project Status KPI Metrics Testing Ppt Powerpoint Presentation Inspiration Layouts. Exult about your achievement.
- Google Slides is a new FREE Presentation software from Google.
- All our content is 100% compatible with Google Slides.
- Just download our designs, and upload them to Google Slides and they will work automatically.
- Amaze your audience with SlideTeam and Google Slides.
-
Want Changes to This PPT Slide? Check out our Presentation Design Services
- WideScreen Aspect ratio is becoming a very popular format. When you download this product, the downloaded ZIP will contain this product in both standard and widescreen format.
-

- Some older products that we have may only be in standard format, but they can easily be converted to widescreen.
- To do this, please open the SlideTeam product in Powerpoint, and go to
- Design ( On the top bar) -> Page Setup -> and select "On-screen Show (16:9)” in the drop down for "Slides Sized for".
- The slide or theme will change to widescreen, and all graphics will adjust automatically. You can similarly convert our content to any other desired screen aspect ratio.
Compatible With Google Slides

Get This In WideScreen
You must be logged in to download this presentation.
PowerPoint presentation slides
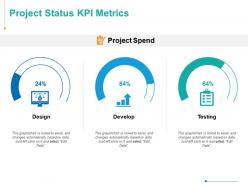
Presenting this set of slides with name - Project Status KPI Metrics Testing Ppt Powerpoint Presentation Inspiration Layouts. This is a three stage process. The stages in this process are Design, Develop, Testing, Finance, Marketing.
Content of this Powerpoint Presentation
Description:
The image shows a PowerPoint slide titled "Project Status KPI Metrics," specifically focusing on "Project Spend." It features three semi-circular progress bars, each representing a different phase of a project: Design, Develop, and Testing. Each progress bar has a percentage indicating the amount of budget spent in that particular phase:
1. Design:
Shows 24% spend, with an icon of a monitor and design tools, indicating the design phase of a project.
2. Develop:
Indicates an 84% spend with an upward trend graph icon, suggesting the development or construction phase.
3. Testing:
Displays a 64% spend, with a checklist icon, representing the testing or quality assurance phase.
Below each graph, there is a note stating, "This graph/chart is linked to Excel, and changes automatically based on data. Just left-click on it and select 'Edit Data'," which means the data in the charts can be dynamically updated via Excel integration.
Use Cases:
This type of slide can be beneficial in a variety of industries where project spend tracking is crucial:
1. Software Development:
Use: Monitoring budget allocation across different development stages.
Presenter: Financial Analyst
Audience: Project Managers, Development Teams
2. Construction:
Use: Tracking financial progress in design, building, and inspection phases.
Presenter: Construction Project Manager
Audience: Investors, Contractors
3. Pharmaceutical:
Use: Managing R&D budget across drug design, development, and clinical trials.
Presenter: R&D Manager
Audience: Stakeholders, Research Scientists
4. Automotive:
Use: Allocating budget for vehicle design, engineering, and safety testing.
Presenter: Product Development Lead
Audience: Design Team, Quality Assurance
5. Aerospace:
Use: Budget tracking for aircraft design, development, and testing phases.
Presenter: Program Manager
Audience: Engineers, Safety Inspectors
6. Marketing:
Use: Overseeing campaign budget through design, implementation, and evaluation stages.
Presenter: Marketing Director
Audience: Creative Team, Account Managers
7. Event Planning:
Use: Financial oversight of event conceptualization, planning, and execution.
Presenter: Event Planner
Audience: Clients, Service Providers
69251986 style essentials 2 financials 3 piece powerpoint presentation diagram infographic slide with all 5 slides:
Keep ambitions alive with our Project Status KPI Metrics Testing Ppt Powerpoint Presentation Inspiration Layouts. Give your audience something to cherish with your ideas.
No Reviews


