22882337 style essentials 2 financials 6 piece powerpoint presentation diagram infographic slide
Be all the go with our Circle Chart With Percentage Analysis Powerpoint Slides. Everyone will buzz around you.
- Google Slides is a new FREE Presentation software from Google.
- All our content is 100% compatible with Google Slides.
- Just download our designs, and upload them to Google Slides and they will work automatically.
- Amaze your audience with SlideTeam and Google Slides.
-
Want Changes to This PPT Slide? Check out our Presentation Design Services
- WideScreen Aspect ratio is becoming a very popular format. When you download this product, the downloaded ZIP will contain this product in both standard and widescreen format.
-

- Some older products that we have may only be in standard format, but they can easily be converted to widescreen.
- To do this, please open the SlideTeam product in Powerpoint, and go to
- Design ( On the top bar) -> Page Setup -> and select "On-screen Show (16:9)” in the drop down for "Slides Sized for".
- The slide or theme will change to widescreen, and all graphics will adjust automatically. You can similarly convert our content to any other desired screen aspect ratio.
Compatible With Google Slides

Get This In WideScreen
You must be logged in to download this presentation.
PowerPoint presentation slides
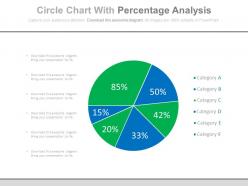
Presenting circle chart with percentage analysis powerpoint slides. This Power Point template diagram has been crafted with graphic of business template with circle chart and percentage diagram. This PPT diagram contains the concept of financial data analysis. Use this PPT diagram for business and finance related presentations.
22882337 style essentials 2 financials 6 piece powerpoint presentation diagram infographic slide with all 4 slides:
Our Circle Chart With Percentage Analysis Powerpoint Slides address their every concern. They will face the future with greater confidence.
-
Great quality product.
-
Awesome presentation, really professional and easy to edit.


