Interactive All Essential 6 Stage Financial Presentation Slides
-
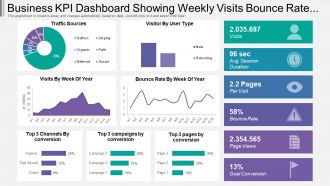 98633483 style essentials 2 financials 6 piece powerpoint presentation diagram infographic slide
Presentation graphic is totally compatible with Google slides. Multiple display options i.e. standard and widescreen. 100 percent editable designs to show your creativity. Similar designs available with different nodes and stages. Easy to download and convert into JPEG or PDF format. Alteration can be done in color, text and shape. Pre-designed PPT slide just download and insert it in the presentation. Quick download with easy to save. Choice to add company logo and replace text as required. High resolution quality ensures no pixilation.
-
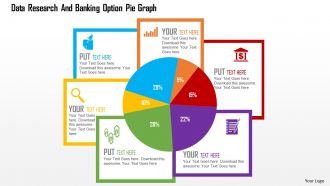 14837843 style circular loop 6 piece powerpoint presentation diagram infographic slide
Exclusive patterns and graphics which are inspired by the current trends to impress the audience. Versatile and multipurpose PPT presentation diagram. Creates transparency of business processes. Enables better understanding and memorising the information displayed. Runs smoothly with all software’s. Compatible with Google framework. 100% amendable icons and images.
-
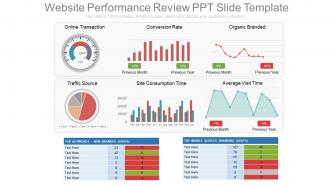 31657559 style essentials 2 financials 6 piece powerpoint presentation diagram infographic slide
These are exclusively codified PPT design schemes which are quite suitable for online business managers, process experts etc. These PPT graphics can be acclimating with divergent software’s and Google slides. These are wonderfully conceived pictorial Presentation templates which can be customizable in to other file formats like PDF or JPG. They have an alterable designs, forms, colors, contents etc. These Website performance PPT design can also provide a space to add the title or subtitle as per your need.
-
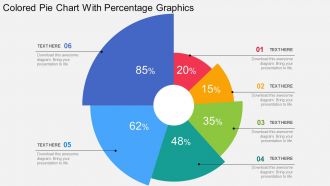 54231009 style division pie 6 piece powerpoint presentation diagram infographic slide
We are proud to present our colored pie chart with percentage graphics flat powerpoint design. Graphic of colored pie chart has been used to craft this power point template diagram. This PPT diagram contains the concept of financial analysis. Use this PPT diagram for business and finance related presentations.
-
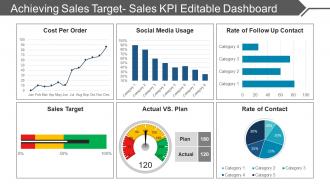 24135204 style essentials 2 financials 6 piece powerpoint presentation diagram infographic slide
Presenting achieving sales target sales kpi editable dashboard PPT diagrams. Simple data input like company logo, name or trademark. This PowerPoint theme is fully supported by Google slides. Picture quality of these slides does not change even when projected on large screen. Fast downloading speed and formats can be easily changed to JPEG and PDF applications. This template is suitable for marketing, sales persons, business managers and entrepreneurs. Adjust PPT layout, font, text and color as per your necessity.
-
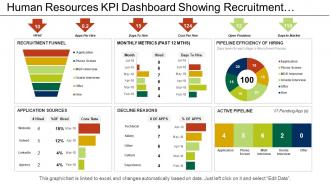 63469541 style essentials 2 financials 6 piece powerpoint presentation diagram infographic slide
Presenting this set of slides with name - Human Resources Kpi Dashboard Showing Recruitment Funnel Application Sources. This is a six stage process. The stages in this process are Human Resource, Hrm, Human Capital.
-
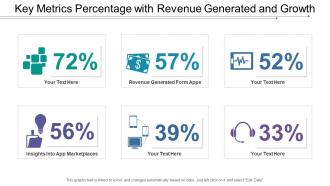 62971703 style essentials 2 financials 6 piece powerpoint presentation diagram infographic slide
This key metrics percentage with revenue generated and growth PowerPoint presentation can be downloaded for free from the SlideTeam webpage. This presentation is 100% editable in aspects like font, font size, font color, etc. It contains shapes like squares, triangles, circles, pentagons, etc. which can be varied by size. Any of the shapes can be resized and their color can be edited as well. You can use your own icons in this PPT as well and they can be edited as well. Selection can be made out of thousands of available icons in this PPT and can be edited as well. It can be viewed and saved in JPG or PDF format. It is fully compatible with Google slides as well.
-
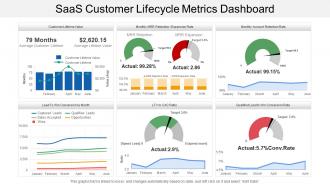 72671910 style essentials 2 financials 6 piece powerpoint presentation diagram infographic slide
Presenting this set of slides with name - Saas Customer Lifecycle Metrics Dashboard. Highlighting Saas customer lifecycle metrics dashboard PowerPoint presentation. Offer 100% access to change the size and style of the slides once downloaded and saved in the desired format. Beneficial for the business managers, marketing professionals and the strategy designers. Access to convert the presentation design into JPG and PDF. High quality images and visuals used in the designing process. Choice to get presentation slide in standard or in widescreen view. Easy to convert in JPEG and PDF document.
-
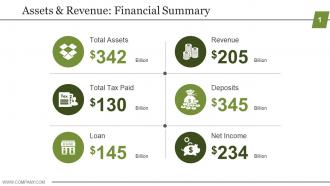 18069569 style essentials 2 financials 6 piece powerpoint presentation diagram template slide
Presenting assets and revenue financial summary powerpoint graphics. This is a assets and revenue financial summary powerpoint graphics. This is a six stage process. The stages in this process aretotal assets, total tax paid, loan, revenue, deposits, net income.
-
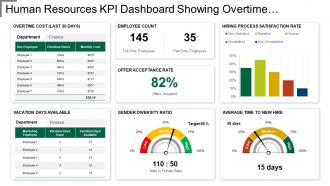 50469508 style essentials 2 financials 6 piece powerpoint presentation diagram infographic slide
Presenting this set of slides with name - Kpi Dashboard Showing Overtime Cost Gender Diversity Ratio. This is a six stage process. The stages in this process are Human Resource, Hrm, Human Capital.
-
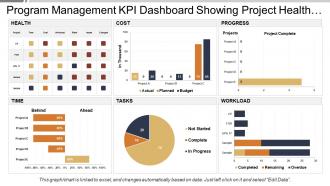 65919369 style essentials 2 financials 6 piece powerpoint presentation diagram infographic slide
Presenting this set of slides with name - Program Management Kpi Dashboard Showing Project Health And Progress. This is a six stage process. The stages in this process are Program Development, Human Resource Management, Program Management.
-
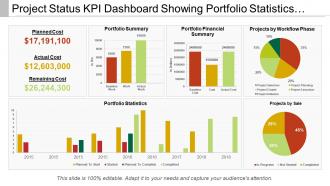 59551623 style essentials 2 financials 6 piece powerpoint presentation diagram infographic slide
Presenting Project Status Kpi Dashboard Showing Portfolio Statistics And Workflow Phase PPT template. All around planned layout slide. This template slide is completely perfect with Google. Tend to upgrade the general effect of your introduction. Introduced to be spared in JPEG, JPG or PDF arrange whenever required. Space accessible to include your organization data as and when required. The format slide is famous and popular because of its simple utilize and openness. Basic and accommodating downloading by following clear advances. This slide keeps up the demonstrable skill of the introduction.
-
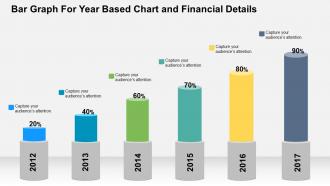 58817189 style concepts 1 growth 6 piece powerpoint presentation diagram infographic slide
Visually drawing PowerPoint presentation diagrams. Loaded with incomparable benefits. Can be utilized for displaying both simple and complex information. Instant download to save your time and effort. Runs effortlessly with all the software’s. Can be personalized by adding company trademark, logo, brand and symbols. Well-arranged patterns to avoid any confusion or doubt.
-
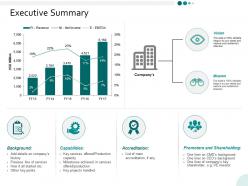 91010229 style essentials 2 financials 6 piece powerpoint presentation diagram infographic slide
Presenting this set of slides with name - Executive Summary Ppt Powerpoint Presentation Infographics Deck. This is a six stages process. The stages in this process are Finance, Marketing, Management, Investment, Analysis.
-
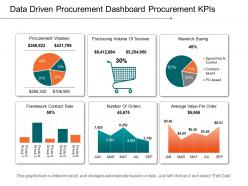 41593055 style essentials 2 financials 6 piece powerpoint presentation diagram template slide
Pre-designed data driven procurement dashboard for Kpis presentation template. Can be used for statistical data analysis. High-resolution PowerPoint presentation backgrounds for better clarity of the information displayed. Offers wide variety of options and colors to alter the appearance. Allows adding of enterprise personal details such as brand name, logo and much more. Enough space available to enter text and its related points in the PPT table. This PPT Slide is available in both Standard and Widescreen slide size. Compatible with multiple formats like JPEG, PDF and Google slides.
-
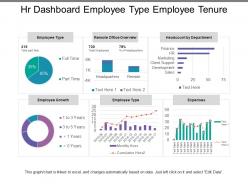 2797341 style essentials 2 financials 6 piece powerpoint presentation diagram infographic slide
Presenting this set of slides with name - Hr Dashboard Employee Type Employee Tenure. This is a six stage process. The stages in this process are Hr Dashboard, Human Resource Dashboard, Hr Kpi.
-
 76760401 style essentials 2 financials 6 piece powerpoint presentation diagram infographic slide
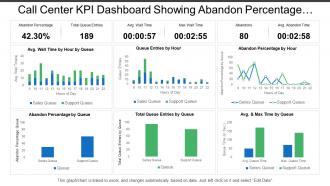
PowerPoint shape easy to amend as color, text, font etc are amendable. Notable quality presentation template. Well-adjusted online software programs such as JPG and PDF. Extra-ordinary picture quality as pixels don’t break when viewed in widescreen view. PPT design goes well with Google slides. Matching designs available with different nodes and stages. Handy presentation design saves you valuable time. Show the PowerPoint diagram with your corporate sign and title. Easy to download and can be saved for future reference.
-
 54553829 style essentials 2 dashboard 6 piece powerpoint presentation diagram infographic slide
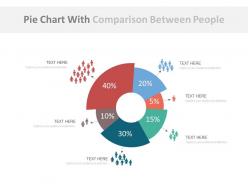
Very useful for large companies and start-ups. Equally handy for school teachers for various subjects like geography, economics etc. Fully modifiable contents. PowerPoint templates available in widescreen format for different screen sizes. Easily convert PPT presentation to popular formats like JPG and PDF. Compatible with google slides for better usability. Uncomplicated process of changing icon features like Size, color and orientation.
-
 81906914 style essentials 2 financials 6 piece powerpoint presentation diagram infographic slide
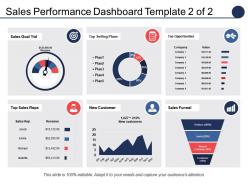
Presenting sales performance dashboard top selling plans top opportunities PPT template. Completely amendable by any user at any point of time without any hassles. Error free performance to put an everlasting impression on the viewers. Great for incorporating business details such as name, logo and trademark. Can be utilized by students, entrepreneurs, investors and customers. Professionally designed presentation slides. Personalize the presentation with individual company name and logo. Available in both Standard and Widescreen slide size.
-
 83477491 style essentials 2 financials 6 piece powerpoint presentation diagram infographic slide
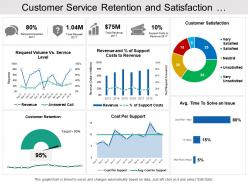
Presenting this set of slides with name - Customer Service Retention And Satisfaction Dashboard. This is a six stage process. The stages in this process are Customer Base, Recurring Customers, Customer Services.
-
 56224132 style division pie 6 piece powerpoint presentation diagram infographic slide
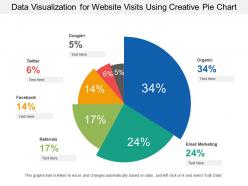
Presenting this set of slides with name - Data Visualization For Website Visits Using Creative Pie Chart. This is a six stage process. The stages in this process are Data Visualization, Data Management, Data Representation.
-
 17345969 style essentials 2 financials 6 piece powerpoint presentation diagram infographic slide
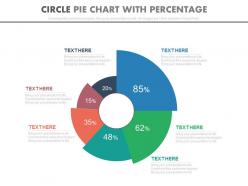
This PPT slide can be used for business and finance related presentations. All the icons used here are 100% editable in a PowerPoint software, you can change the color, size, and orientation of any icon to your liking. You can insert your company logo in the PPT slide, which is also compatible with google slides.
-
 31512942 style essentials 2 financials 6 piece powerpoint presentation diagram infographic slide
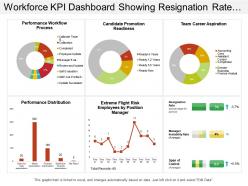
Presenting this set of slides with name - Workforce Kpi Dashboard Showing Resignation Rate Manager Instability Rate And Performance Workflow Process. This is a six stage process. The stages in this process are Staff, Personnel, Workforce.
-
 39384461 style essentials 2 financials 6 piece powerpoint presentation diagram infographic slide
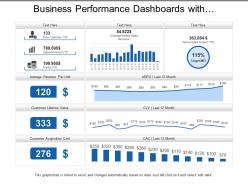
Presenting, our business performance dashboards with average revenue and customer lifetime value PPT template. You can download this engaging PPT template and take a report of the full version of this PPT deck which includes editing the text, adjusting the colors according to your liking, watermark gets expelled, include your company's logo and get slides in widescreen version.
-
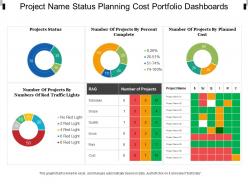 63274546 style division donut 6 piece powerpoint presentation diagram infographic slide
Introducing project name status planning cost portfolio dashboards PPT template. Presentable and easy to comprehend visual graphic. The presentation template can be downloaded and saved in any desired format. Valuable for the business presenters and entrepreneurs as they can showcase their business success in a creative way. Privilege of insertion of logo and trademarks for more personalization. Adaptable to wide screen view without the problem of pixilation. Can be used with Google slides. Beneficial for industry professionals, managers, executives, researchers, sales people, etc.
-
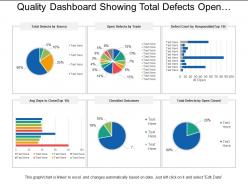 8788121 style essentials 2 financials 6 piece powerpoint presentation diagram infographic slide
SlideTeam brings to you its totally editable and user-friendly quality dashboard showing total defects checklist outcome. This set of predesigned slides has been designed in such a manner that you can change the font style, font color and font size, etc. of the text used in the slides. After you download the PPT it can be viewed in standard size display ratio of 4:3 or widescreen display ratio of 16:9. The business template is very easy to use as it is compatible with Google Slides.
-
 58210068 style essentials 2 financials 6 piece powerpoint presentation diagram infographic slide
Presenting this set of slides with name - Compliance And Legal Kpi Dashboard Showing High Priority Violations. This is a six stage process. The stages in this process are Compliance And Legal, Legal Governance, Risk Management.
-
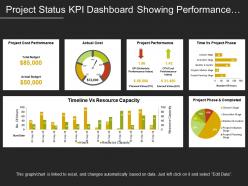 29720482 style essentials 2 financials 6 piece powerpoint presentation diagram infographic slide
Presenting this set of slides with name - Project Status Kpi Dashboard Showing Performance And Resource Capacity. This is a six stage process. The stages in this process are Project Health Card, Project Performance, Project Status.
-
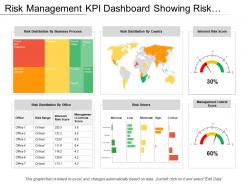 46807333 style essentials 2 financials 6 piece powerpoint presentation diagram infographic slide
Presenting this set of slides with name - Risk Management Kpi Dashboard Showing Risk Distribution By Country Office And Business Process. This is a six stage process. The stages in this process are Risk Management, Risk Assessment, Project Risk.
-
 75694196 style essentials 2 financials 6 piece powerpoint presentation diagram infographic slide
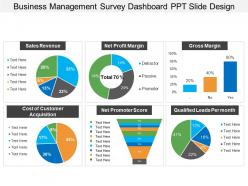
Presenting business management survey dashboard snapshot PPT slide design PowerPoint diagram which is 100% editable. This PPT template is data driven i.e. excel linked and is easy to customize and enables you to personalize it as per your own criteria. The presentation slide is fully compatible with Google slides, multiple format and software options. In case of any assistance, kindly take instructions from our presentation design services and it is easy to download in a very short span of time. The images, layouts, designs are of high quality and ensures quality in widescreen.
-
 71981837 style essentials 2 financials 6 piece powerpoint presentation diagram infographic slide
Presenting employee survey motivation PowerPoint slide show. PPT is useful for HR managers, entrepreneurs for employee satisfaction and motivation related slideshows. You can download and convert the PPT design into JPEG and PDF formats. PPT is fully editable. Modify and customize the design template by changing font type, color, size, shape, background, style and other related graphics. You can open the design with Google Slides and PowerPoint.
-
 23990224 style essentials 2 financials 6 piece powerpoint presentation diagram infographic slide
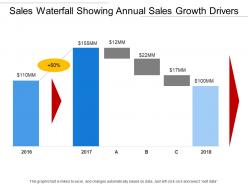
Presenting the Sales Waterfall Showing Annual Sales Growth Drivers PowerPoint presentation slide. You can edit this template in PowerPoint and use it in Google slides also. The PPT layout is totally editable. You can add relevant content in the text holders provided. The image has a high resolution so that it does not blur on being enlarged. The slide is available in both standard and wide screen formats. So, click, edit and present.
-
 8568620 style variety 1 silhouettes 6 piece powerpoint presentation diagram infographic slide
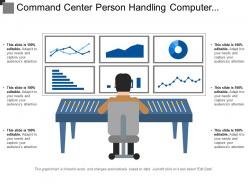
Presenting this set of slides with name - Command Center Person Handling Computer System Screen. This is a six stage process. The stages in this process are Command Room, Control Centre, Control Room.
-
 67184523 style essentials 2 financials 6 piece powerpoint presentation diagram infographic slide
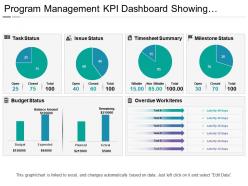
Presenting Program Management KPI Dashboard Showing Timesheet Summary PPT slide. The Program management KPI dashboard PowerPoint template designed professionally by the team of SlideTeam to present the record of timesheet summary to do any task. The pie chart and line chart figures along with that the text in the timesheet summary dashboard slide are customizable in PowerPoint. A user can illustrate the specific time to do any task because the pie chart dashboard template gets linked with Excel Sheet along with that it is also compatible with Google Slide. A user can alter the font size, font type, color, as well as dimensions of the pie and line chart to present the specific time.
-
 27104020 style essentials 2 financials 6 piece powerpoint presentation diagram infographic slide
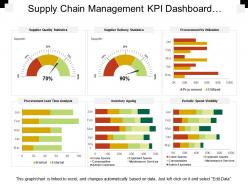
Presenting this set of slides with name - Supply Chain Management Kpi Dashboard Showing Procurement Vs Utilization. This is a six stage process. The stages in this process are Demand Forecasting, Predicting Future Demand, Supply Chain Management.
-
 86057273 style essentials 1 our vision 6 piece powerpoint presentation diagram infographic slide
High determination PPT visuals don't pixelate even after customization. All the PPT symbols, content, foundation and charts can be altered to coordinate your need. It can further be spared in any organization of your decision (JPG/JPEG/PDF). Compatible with various arrangement choices. Compatible with numerous product alternatives accessible both on the web and disconnected. Personalize it with organization name and logo of your own. It's a helpful PowerPoint slide plan for entrepreneurs, operations troughs, advertising official, educators and understudies.
-
 96954373 style essentials 2 financials 6 piece powerpoint presentation diagram infographic slide
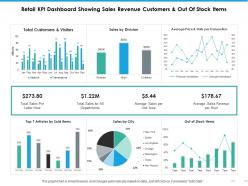
Presenting this set of slides with name - Retail Kpi Dashboard Showing Sales Revenue Customers And Out Of Stock Items. This is a six stage process. The stages in this process are Percentage, Product, Management, Marketing, Business.
-
 94541290 style linear single 6 piece powerpoint presentation diagram infographic slide
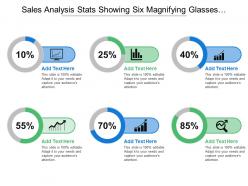
Presenting this set of slides with name - Sales Analysis Stats Showing Six Magnifying Glasses And Percentages. This is a six stage process. The stages in this process are Stats, Statistics, Data.
-
 1316560 style essentials 2 financials 6 piece powerpoint presentation diagram infographic slide
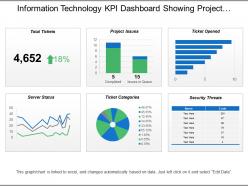
Presenting this set of slides with name - Information Technology Kpi Dashboard Showing Project Issues Server Status. This is a six stage process. The stages in this process are Information Technology, It, Iot.
-
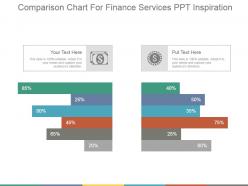 53688882 style essentials 2 financials 6 piece powerpoint presentation diagram infographic slide
Presenting comparison chart for finance services ppt inspiration. This is a comparison chart for finance services ppt inspiration. This is a six stage process. The stages in this process are comparison, finance, percentage, analysis, service.
-
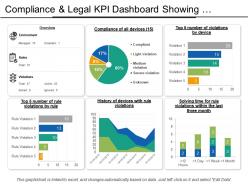 52575297 style essentials 2 financials 6 piece powerpoint presentation diagram infographic slide
Presenting this set of slides with name - Compliance And Legal Kpi Dashboard Showing Violations By Devices. This is a six stage process. The stages in this process are Compliance And Legal, Legal Governance, Risk Management.
-
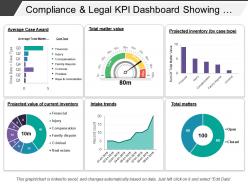 44784490 style essentials 2 financials 6 piece powerpoint presentation diagram infographic slide
Presenting this set of slides with name - Compliance And Legal Kpi Dashboard Showing Total Matter Value. This is a six stage process. The stages in this process are Compliance And Legal, Legal Governance, Risk Management.
-
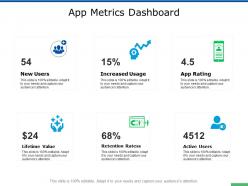 App metrics dashboard active users ppt powerpoint presentation outline visuals
Presenting this set of slides with name App Metrics Dashboard Active Users Ppt Powerpoint Presentation Outline Visuals. This is a six stage process. The stages in this process are Finance, Analysis, Business, Investment, Marketing. This is a completely editable PowerPoint presentation and is available for immediate download. Download now and impress your audience.
-
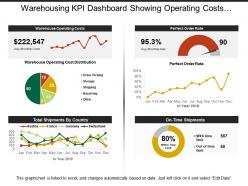 38407203 style essentials 2 financials 6 piece powerpoint presentation diagram infographic slide
The main advantage of this highly versatile PPT design is that it’s completely editable; you can include your business logo, trademarks to personalize the design. Also, you can include business related custom content over text place holders. Design can be opened and edited with Google Slides and MS PowerPoint software. You can download this PowerPoint design into JPEG and PDF formats.
-
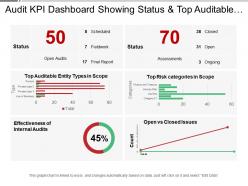 10493137 style essentials 2 financials 6 piece powerpoint presentation diagram infographic slide
Presenting this set of slides with name - Audit Kpi Dashboard Showing Status And Top Auditable Entity Types. This is a six stage process. The stages in this process are Audit, Examine, Survey.
-
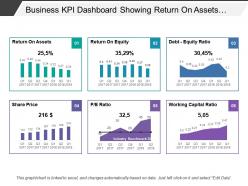 30422100 style essentials 2 financials 6 piece powerpoint presentation diagram infographic slide
Presenting this set of slides with name - Business Kpi Dashboard Showing Return On Assets Debt-Equity Ratio. This is a six stage process. The stages in this process are Business Dashboard, Business Kpi, Business Performance.
-
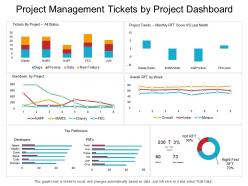 31998879 style essentials 2 financials 6 piece powerpoint presentation diagram infographic slide
Presenting this set of slides with name - Project Management Tickets By Project Dashboard. This is a six stage process. The stages in this process are Project Proposal, Project Plan, Project Management.
-
 67659504 style essentials 2 financials 6 piece powerpoint presentation diagram infographic slide
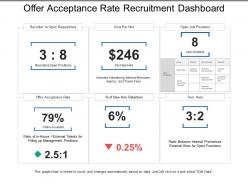
Presenting this set of slides with name - Offer Acceptance Rate Recruitment Dashboard. This is a six stage process. The stages in this process are Staffing Plan, Recruitment, Staff Management.
-
 91166336 style essentials 2 financials 6 piece powerpoint presentation diagram infographic slide
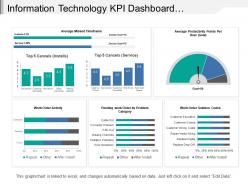
Presenting this set of slides with name - Information Technology Kpi Dashboard Showing Work Order Activity. This is a six stage process. The stages in this process are Information Technology, It, Iot.
-
 48126678 style essentials 2 financials 6 piece powerpoint presentation diagram infographic slide
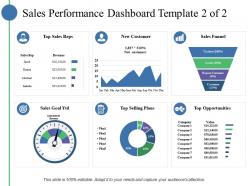
Introducing sales performance dashboard top sales reps new customer PowerPoint template. Presentation slides are crafted with high quality resolution designs. PPT templates comes in standard and widescreen view. Instant download and can be converted into other formats i.e. JPEG and PDF. Perfect for business management experts and research development team. Replace the watermark with your company’s logo. Possess time saving qualities. Presentation slides are well-matched with Google slides. Fast download and effortlessly inclusion in your presentation.
-
 25786925 style cluster venn 6 piece powerpoint presentation diagram infographic slide
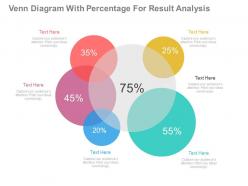
Completely editable content including fonts, text, colors. Compatible with number of software options. Modify the PPT design with company image and logo. Excellence in picture quality even on wide screen output. Compatible with Google slides. Adaptable PPT designs as can be converted into JPG and PDF. Suitable for business, sales, marketing, finance, IT, accounts sectors.
-
 46755309 style layered vertical 6 piece powerpoint presentation diagram infographic slide
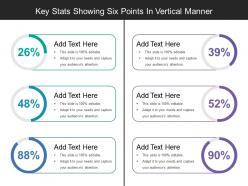
Presenting this set of slides with name - Key Stats Showing Six Points In Vertical Manner. This is a six stage process. The stages in this process are Stats, Statistics, Data.
-
 98287998 style essentials 2 financials 6 piece powerpoint presentation diagram infographic slide
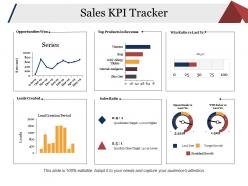
Presenting this set of slides with name - Sales Kpi Tracker Presentation Examples. This is a six stage process. The stages in this process are Opportunities Won, Top Products In Revenue, Win Ratio Vs Last, Leads Created, Sales Ratio.
-
 91540265 style essentials 2 financials 6 piece powerpoint presentation diagram infographic slide
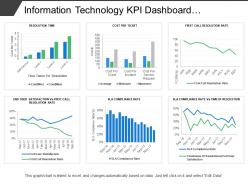
Presenting this set of slides with name - Information Technology Kpi Dashboard Showing Cost Per Ticket Sla Compliance Rate. This is a six stage process. The stages in this process are Information Technology, It, Iot.
-
 Pmo governance including promote leadership
Presenting this set of slides with name PMO Governance Including Promote Leadership. This is a six stage process. The stages in this process are Change Management, PMO Governance Structure, Project Governance. This is a completely editable PowerPoint presentation and is available for immediate download. Download now and impress your audience.
-
 19714613 style essentials 2 financials 6 piece powerpoint presentation diagram infographic slide
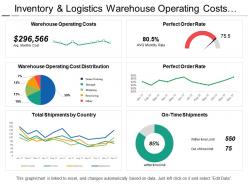
Presenting inventory and logistics warehouse operating costs dashboard PPT slideshow. Editable charts, visuals, colors and text. Presentable and easy to comprehend info graphic format. The presentation template can be downloaded and saved in any desired format. Privilege of insertion of logo and trademarks for more personalization. Adaptable to wide screen view without the problem of pixilation. Can be used with Google slides. Easy to edit and customize as per your needs. Beneficial for industry professionals, managers, executives, researchers, sales people, etc.
-
 18275156 style essentials 2 financials 6 piece powerpoint presentation diagram infographic slide
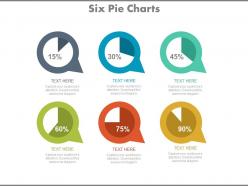
Six pie charts for financial percentage analysis PowerPoint Slide. Editable shapes, colors and text. Presentable and easy to comprehend info graphic format. Presentation designs accessible in standard and widescreen view. The presentation template can be downloaded and saved in any desired format. Privilege of insertion of logo and trademarks for more personalization. Fully adaptable PPT slides with Google slides. Easy to edit and customize as per your needs.
-
 60356460 style essentials 2 financials 6 piece powerpoint presentation diagram infographic slide
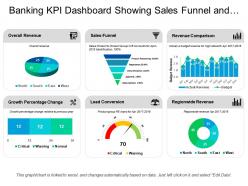
Presenting this set of slides with name - Banking Kpi Dashboard Showing Sales Funnel And Overall Revenue. This is a six stage process. The stages in this process are Banking, Finance, Money.
-
 79423808 style essentials 2 financials 6 piece powerpoint presentation diagram infographic slide
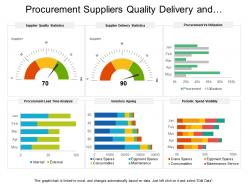
Presenting this set of slides with name - Procurement Suppliers Quality Delivery And Utilization Dashboard. This is a six stage process. The stages in this process are Purchase, Procurement, Buy.
-
 47077749 style essentials 2 financials 1 piece powerpoint presentation diagram infographic slide
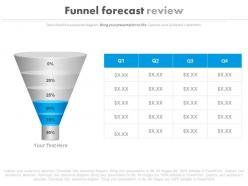
Presenting ppt funnel forecast review table powerpoint slides. This Power Point template slide has been crafted with graphic of funnel and bar graph charts. This PPT slide contains the concept of business forecast and review. Use this PPT slide for business and marketing related presentations.


