Interactive All Essential 6 Stage Financial Presentation Slides
-
 47077749 style essentials 2 financials 1 piece powerpoint presentation diagram infographic slide
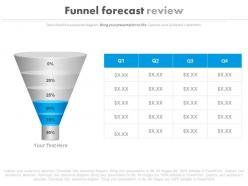
Presenting ppt funnel forecast review table powerpoint slides. This Power Point template slide has been crafted with graphic of funnel and bar graph charts. This PPT slide contains the concept of business forecast and review. Use this PPT slide for business and marketing related presentations.
-
 33208426 style essentials 2 financials 6 piece powerpoint presentation diagram infographic slide
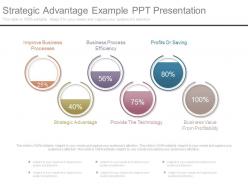
Fast and simple to download without any hassles. Absolutely editable text boxes as per your need. Fully modifiable PPT images- alter the color scheme and contrast to your liking. Change the orientation and size of PPT icons as per requirement. No change in original resolution of PPT infographics after editing any number of times.The stages in this process are improve business processes, business process efficiency, profits or saving, strategic advantage, provide the technology, business value from profitability.
-
 17980133 style division pie 6 piece powerpoint presentation diagram infographic slide
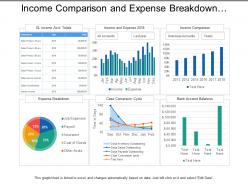
Presenting this set of slides with name - Income Comparison And Expense Breakdown Utilities Dashboard. This is a six stage process. The stages in this process are Utilities, Use, Advantage.
-
 22008895 style essentials 2 financials 6 piece powerpoint presentation diagram infographic slide
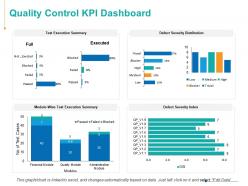
Presenting this set of slides with name - Quality Control KPI Dashboard Ppt Powerpoint Presentation Inspiration Example. This is a six stage process. The stages in this process are Finance, Analysis, Business, Investment, Marketing.
-
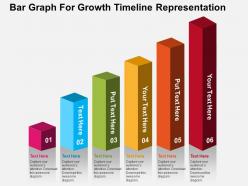 90530505 style concepts 1 growth 6 piece powerpoint presentation diagram infographic slide
Proofing and editing can be done with ease in PPT design. Presentation slide is of utmost use to management professionals, big or small organizations and business startups. Smooth functioning is ensured by the presentation slide show on all software’s. When projected on the wide screen the PPT layout does not sacrifice on pixels or color resolution. Can be used by the teachers, businessmen, managers and other professionals to have a setup to highlight different characteristics. Supports good compatibly with the Google slides.
-
 25915484 style essentials 2 financials 6 piece powerpoint presentation diagram infographic slide
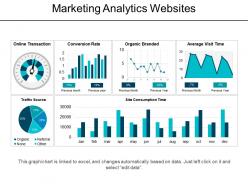
Presenting marketing analytics websites powerpoint topics. This is a marketing analytics websites powerpoint topics. This is a six stage process. The stages in this process are market analysis, marketing analytics, web analytics, marketing optimization.
-
 44987331 style essentials 2 financials 6 piece powerpoint presentation diagram infographic slide
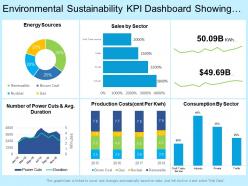
Presenting this set of slides with name - Environmental Sustainability Kpi Dashboard Showing Total Consumption Sales Energy Sources. This is a six stage process. The stages in this process are Environment Sustainability, Environment Continual, Environment Feasibility.
-
 35165750 style essentials 2 financials 6 piece powerpoint presentation diagram infographic slide
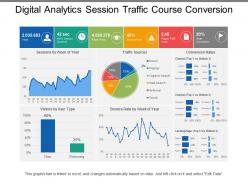
Presenting this set of slides with name - Digital Analytics Session Traffic Course Conversion. This is a five stage process. The stages in this process are Digital Analytics, Digital Dashboard, Digital Kpis.
-
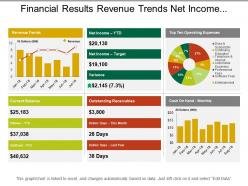 70903479 style essentials 2 financials 6 piece powerpoint presentation diagram infographic slide
Presenting financial results revenue trends net income cash on hand layout. Change PowerPoint structure, font, text, color and design as per your requirements. Easy to input data with excel linked charts, just right to click to input data. This presentation theme is totally attuned with Google slide. Easy conversion to other software’s like JPG and PDF formats. Image quality of these PPT diagram remains the unchanged even when you resize the image or portray on large screens.
-
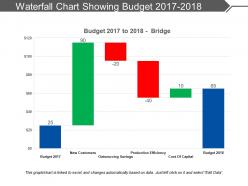 91956654 style essentials 2 financials 6 piece powerpoint presentation diagram infographic slide
Presenting the financial budget presentation slide. This impressive template is ready-to-use and is designed professionally. You can easily edit the font color and font size as the template is fully customizable. The template can be edited in PowerPoint and can be saved into the JPG or PDF file format. To download this PPT slide, click on the download tab provided below.
-
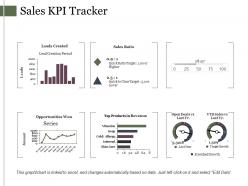 30252291 style essentials 2 financials 6 piece powerpoint presentation diagram infographic slide
Presenting this set of slides with name - Sales Kpi Tracker Ppt Samples. This is a six stage process. The stages in this process are Bar, Marketing, Finance, Growth, Strategy.
-
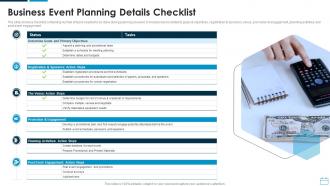 Business Event Planning Details Checklist
The slide shows a checklist containing number of tasks needed to be done during planning an event. It includes tasks related to goals and objectives, registration and sponsors, venue, promotion and engagement, planning activities and post event engagement. Presenting our set of slides with Business Event Planning Details Checklist. This exhibits information on six stages of the process. This is an easy to edit and innovatively designed PowerPoint template. So download immediately and highlight information on Registration And Sponsors, Action Steps, Promotion And Engagement, Post Event Engagement, Action Steps.
-
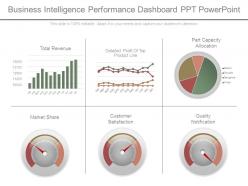 98430836 style division pie 6 piece powerpoint presentation diagram infographic slide
Presenting business intelligence performance dashboard snapshot ppt powerpoint. This is a business intelligence performance dashboard ppt powerpoint. This is a six stage process. The stages in this process are total revenue, detailed profit of top product line, part capacity allocation, market share, customer satisfaction, quality notification.
-
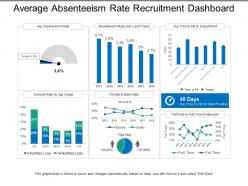 23659841 style essentials 2 financials 6 piece powerpoint presentation diagram template slide
Presenting this set of slides with name - Average Absenteeism Rate Recruitment Dashboard. This is a six stage process. The stages in this process are Staffing Plan, Recruitment, Staff Management.
-
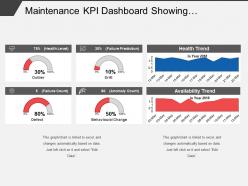 53035501 style essentials 2 financials 6 piece powerpoint presentation diagram infographic slide
Presenting this set of slides with name - Maintenance Kpi Dashboard Showing Preventive Maintenance. This is a six stage process. The stages in this process are Maintenance, Preservation, Conservation.
-
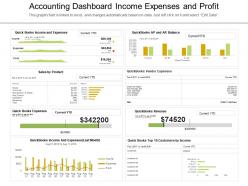 80017909 style essentials 2 financials 6 piece powerpoint presentation diagram template slide
Presenting this set of slides with name - Accounting Dashboard Income Expenses And Profit. This is a six stage process. The stages in this process are Accounting, Bookkeeping, Auditing, Finance.
-
 64075871 style essentials 2 financials 6 piece powerpoint presentation diagram infographic slide
Presenting this set of slides with name - Inventory And Logistics Dashboard Ppt Powerpoint Presentation Summary Background Image. This is a six stages process. The stages in this process are Finance, Marketing, Management, Investment, Analysis.
-
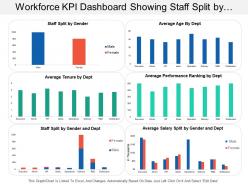 61566952 style essentials 2 financials 6 piece powerpoint presentation diagram infographic slide
Presenting this set of slides with name - Workforce Kpi Dashboard Showing Staff Split By Gender And Average Tenure By Department. This is a six stage process. The stages in this process are Staff, Personnel, Workforce.
-
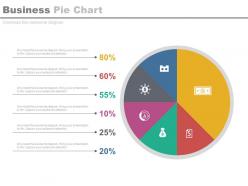 3896664 style essentials 2 financials 6 piece powerpoint presentation diagram infographic slide
Presenting business pie chart with percentage analysis powerpoint slides. This Power Point template diagram has been crafted with graphic of business pie chart and percentage diagram. This PPT diagram contains the concept of business and finance result analysis. Use this PPT diagram for business and finance related presentations.
-
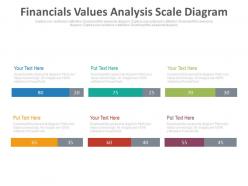 89732102 style essentials 2 financials 6 piece powerpoint presentation diagram infographic slide
Presenting financial values analysis scale diagram powerpoint slides. This is a financial values analysis scale diagram powerpoint slides. This is a six stage process. The stages in this process are financials.
-
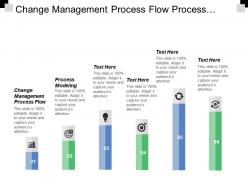 24276098 style essentials 2 financials 6 piece powerpoint presentation diagram infographic slide
Presenting this set of slides with name - Change Management Process Flow Process Modeling Audit Process Cpb. This is an editable six stages graphic that deals with topics like Change Management Risks, Increasing Operational Efficiency, Expatriate Employee to help convey your message better graphically. This product is a premium product available for immediate download, and is 100 percent editable in Powerpoint. Download this now and use it in your presentations to impress your audience.
-
 88912586 style layered vertical 6 piece powerpoint presentation diagram infographic slide
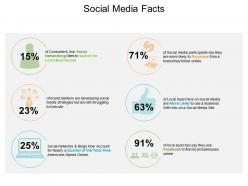
Presenting social media facts PowerPoint slide deck PPT template. You can download this template and save into another format such as JPG and PDF and can also display in standard and widescreen view. You can alter the slide such as color, text, font type, font size and aspect ratio. This template gets synced with Google Slides and editable in PowerPoint. You may share this slide with large segment because it has great pixel quality. You can insert the relevant content in text placeholder of this template.
-
 86793716 style essentials 2 financials 6 piece powerpoint presentation diagram infographic slide
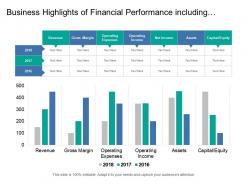
Presenting this set of slides with name - Business Highlights Of Financial Performance Including Revenue Gross Margin Operating Income. This is a six stage process. The stages in this process are Business Highlights, Company Highlights, Business Key Points.
-
 2871348 style essentials 2 financials 6 piece powerpoint presentation diagram infographic slide
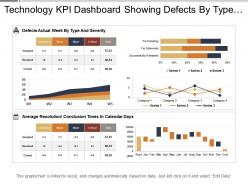
Presenting this set of slides with name - Technology Kpi Dashboard Showing Defects By Type And Severity. This is a six stage process. The stages in this process are Technology, IT, IOT.
-
 73579233 style essentials 2 financials 6 piece powerpoint presentation diagram infographic slide
This storage KPI dashboard PPT design is completely editable; you can modify and personalize the design as per your business needs; include business logo and trademark to look PPT more authentic, put your business warehousing figures in excel and linked charts in design will get updated automatically. You can download the design into JPEG or PDF formats; easy and swift downloading available. Design is compatible with Google Slides and MS PowerPoint software.
-
 38017825 style essentials 2 financials 6 piece powerpoint presentation diagram infographic slide
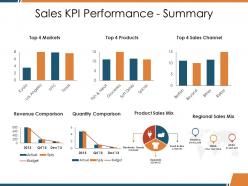
Presenting this set of slides with name - Sales Kpi Performance Summary Ppt Template. This is a six stage process. The stages in this process are Revenue Comparison, Quantity Comparison, Product Sales Mix, Regional Sales Mix, Sales Channel.
-
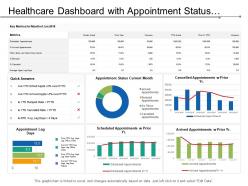 23612104 style essentials 2 financials 6 piece powerpoint presentation diagram infographic slide
Presenting this set of slides with name - Healthcare Dashboard With Appointment Status Current Month. This is a six stage process. The stages in this process are Healthcare, Health Improvement, Medical Care.
-
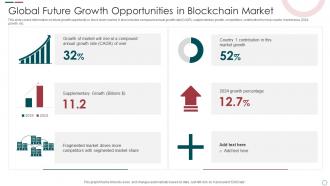 Global Future Growth Opportunities In Blockchain Market
This slide covers information on future growth opportunity in block chain market. It also includes compound annual growth rate CAGR, supplementary growth, competitors, contribution from top country market area, 2024 growth, etc. Presenting our set of slides with name Global Future Growth Opportunities In Blockchain Market. This exhibits information on six stages of the process. This is an easy-to-edit and innovatively designed PowerPoint template. So download immediately and highlight information on Global Future Growth, Opportunities, Blockchain Market.
-
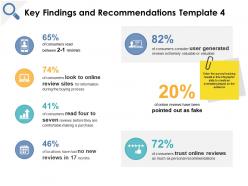 Key findings and recommendations online reviews growth ppt powerpoint presentation file icons
Presenting this set of slides with name Key Findings And Recommendations Online Reviews Growth Ppt Powerpoint Presentation File Icons. This is a six stage process. The stages in this process are Finance, Marketing, Management, Investment, Analysis. This is a completely editable PowerPoint presentation and is available for immediate download. Download now and impress your audience.
-
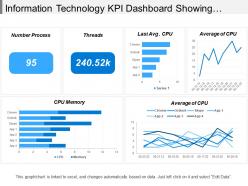 55406444 style essentials 2 financials 6 piece powerpoint presentation diagram infographic slide
Presenting this set of slides with name - Information Technology Kpi Dashboard Showing Cpu Memory Average Of Cpu. This is a six stage process. The stages in this process are Information Technology, It, Iot.
-
 99290375 style essentials 2 financials 6 piece powerpoint presentation diagram infographic slide
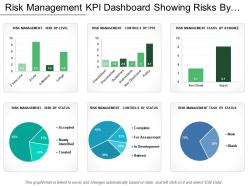
Presenting this set of slides with name - Risk Management Kpi Dashboard Showing Risks By Level Assignee And Status. This is a six stage process. The stages in this process are Risk Management, Risk Assessment, Project Risk.
-
 72352169 style essentials 2 financials 6 piece powerpoint presentation diagram infographic slide
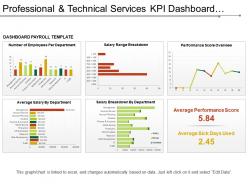
Presenting this set of slides with name - Professional And Technical Services Kpi Dashboard Showing Payroll Services. This is a six stage process. The stages in this process are Professional And Technical Services, Services Management, Technical Management.
-
 20381011 style division donut 6 piece powerpoint presentation diagram infographic slide
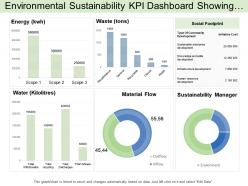
Presenting this set of slides with name - Environmental Sustainability Kpi Dashboard Showing Social Footprint And Supply Chain Category. This is a six stage process. The stages in this process are Environment Sustainability, Environment Continual, Environment Feasibility.
-
 47572750 style essentials 2 financials 6 piece powerpoint presentation diagram infographic slide
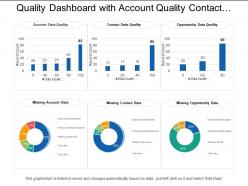
Presenting this set of slides with name - Quality Dashboard Snapshot With Account Quality Contact Data Missing Account Data. This is a six stage process. The stages in this process are Quality Dashboard, Quality Kpi, Quality Metircs.
-
 26557997 style essentials 2 financials 6 piece powerpoint presentation diagram infographic slide
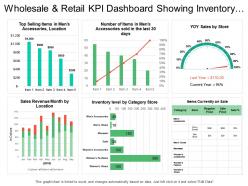
Presenting the retail business slide for PowerPoint. This presentation template is 100% modifiable in PowerPoint and is designed by professionals. You can edit the objects in the slide like font size and font color very easily. This presentation slide is fully compatible with Google Slide and can be saved in JPG or PDF file format without any fuss. Click on the download button to download this template in no time.
-
 49110483 style division pie 6 piece powerpoint presentation diagram infographic slide
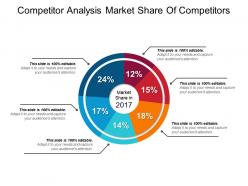
Presenting competitor analysis market share of competitors PPT inspiration PPT slide. This presentation slide is widely applicable by a team of managers and business analyst who foresee the business in light of prosperity, by students and others. PPT has impressive picture quality with high resolution. 100 percent editable slide design. There is freedom to execute the changes in color, font, text and more as per one’s personal choice. Ease of personalization with your company name and logo. PPT is compatible with a wide variety of format options. PPT is harmonious with a set of software options, available both online and offline.
-
 25402990 style layered vertical 6 piece powerpoint presentation diagram infographic slide
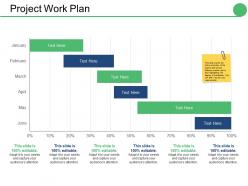
Presenting this set of slides with name - Project Work Plan Ppt Infographics Vector. This is a six stage process. The stages in this process are Month, Business, Step, Management, Percentage.
-
 93603866 style essentials 2 financials 6 piece powerpoint presentation diagram infographic slide
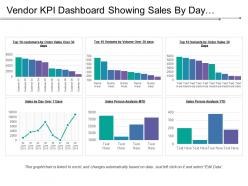
Presenting this set of slides with name - Vendor Kpi Dashboard Showing Sales By Day Sales Person Analysis Top 10 Customers By Order Value. This is a six stage process. The stages in this process are Vendor, Supplier, Retailer.
-
 64961481 style division donut 6 piece powerpoint presentation diagram infographic slide
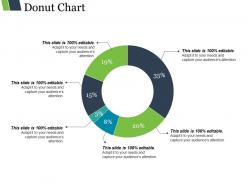
Presenting donut chart presentation ideas. This is a donut chart presentation ideas. This is a six stage process. The stages in this process are percentage, finance, donut, business.
-
 97722968 style essentials 1 agenda 6 piece powerpoint presentation diagram infographic slide
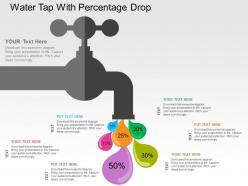
We are proud to present our water tap with percentage drop flat powerpoint design. Graphic of water tap and percentage drop has been used to craft this power point template diagram. This PPT diagram contains the concept of financial interest calculation. Use this PPT diagram for business and finance related presentations.
-
 84618710 style essentials 2 financials 6 piece powerpoint presentation diagram infographic slide
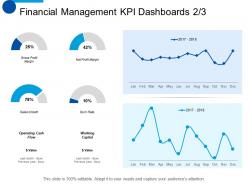
Presenting this set of slides with name - Financial Management KPI Dashboards Snapshot Planning Ppt Summary Smartart. This is a six stage process. The stages in this process are Sales Growth, Gross Profit Margin, Net Profit Margin, Planning, Marketing.
-
 61814001 style essentials 2 financials 6 piece powerpoint presentation diagram infographic slide
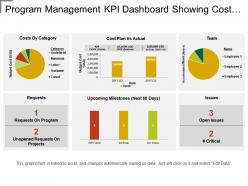
Presenting this set of slides with name - Program Management Kpi Dashboard Showing Cost Plan Vs Actual. This is a six stage process. The stages in this process are Program Development, Human Resource Management, Program Management.
-
 2561336 style essentials 2 financials 6 piece powerpoint presentation diagram infographic slide
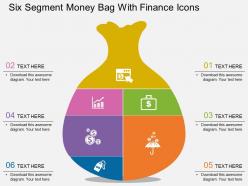
Presenting bh six segment money bag with finance icons flat powerpoint design. Six segment money bag and finance icons have been used to craft this power point template diagram. This PPT diagram contains the concept of financial investment analysis. Use this PPT diagram can be used for business and finance related presentations.
-
 9176052 style essentials 2 financials 6 piece powerpoint presentation diagram infographic slide
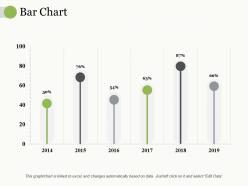
Presenting this set of slides with name - Bar Chart Ppt Professional Designs Download. This is a six stage process. The stages in this process are Business, Marketing, Percentage, Product.
-
 69653969 style essentials 2 financials 6 piece powerpoint presentation diagram infographic slide
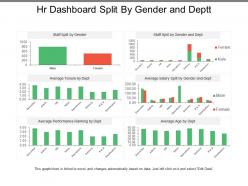
Presenting this set of slides with name - Hr Dashboard Split By Gender And Deptt. This is a six stage process. The stages in this process are Hr Dashboard, Human Resource Dashboard, Hr Kpi.
-
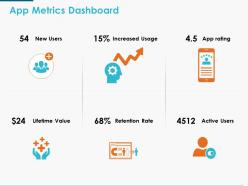 App metrics dashboard ppt powerpoint presentation icon model
This is a six stage process. The stages in this process are Finance, Analysis, Business, Investment, Marketing.
-
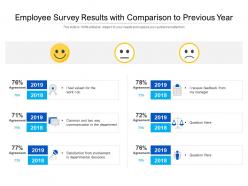 Employee survey results with comparison to previous year
Presenting this set of slides with name Employee Survey Results With Comparison To Previous Year. This is a six stage process. The stages in this process are Communication, Involvement, Departmental Decisions. This is a completely editable PowerPoint presentation and is available for immediate download. Download now and impress your audience.
-
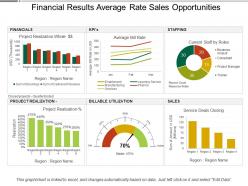 97073123 style essentials 2 financials 6 piece powerpoint presentation diagram template slide
Introducing financial results average rates sales opportunities Presentation template. Pre-designed PowerPoint slide assist you in saving time and effort. Color, text and font can be easily edited as the PPT graphic is completely editable. Adaptable as can be transformed into PDF or JPEG formats. Fast download and easy to share with large set of audience. Presentation diagram is presentable in standard and widescreen display. Innovatively created PPT design familiar with Google slides.
-
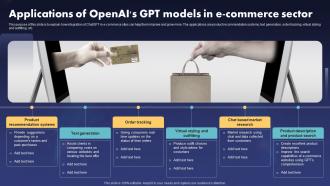 Chatgpt IT Applications Of Openais Gpt Models In E Commerce Sector
This purpose of this slide is to explain how integration of ChatGPT in e commerce sites can help them improve and grow more. The applications are product recommendation systems, text generation, order tracking, virtual styling and outfitting, etc. Introducing Chatgpt IT Applications Of Openais Gpt Models In E Commerce Sector to increase your presentation threshold. Encompassed with six stages, this template is a great option to educate and entice your audience. Dispence information on Order Tracking, Product Recommendation Systems, Chat Based Market Research, using this template. Grab it now to reap its full benefits.
-
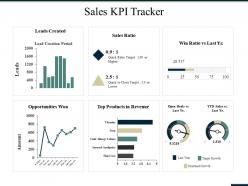 99002480 style essentials 2 financials 6 piece powerpoint presentation diagram infographic slide
Presenting this set of slides with name - Sales Kpi Tracker Ppt Summary Grid. This is a six stage process. The stages in this process are Leads Created, Sales Ratio, Opportunities Won, Products In Revenue, Open Deals Vs.
-
 53879803 style division donut 6 piece powerpoint presentation diagram infographic slide
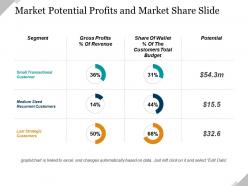
Presenting market potential profits and market share ppt presentation. This is a market potential profits and market share ppt presentation. This is a six stage process. The stages in this process are business, finance, marketing, strategy, success, analysis.
-
 66161814 style division donut 6 piece powerpoint presentation diagram infographic slide
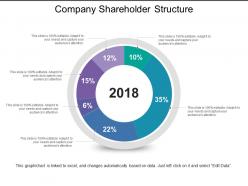
Presenting this set of slides with name - Company Shareholder Structure. This is a six stage process. The stages in this process are Shareholder Structure, Stockholder Structure.
-
 20571553 style concepts 1 growth 6 piece powerpoint presentation diagram infographic slide
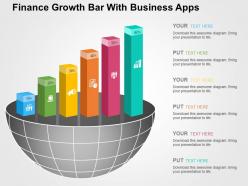
Simplified and not cluttered slides with maximum visual appeal. Clean and clear PPT presentation with high resolution content. Easy to customize presentation model for inclusion and exclusion of data as per individual choice. Fruitful pre designed PowerPoint model for Students, teachers, financial analysts and other business professionals. Personalize the slides with your company name and logo. Easy to download and save in format of your choice. Compatible with multiple software options.
-
 93239240 style essentials 2 financials 6 piece powerpoint presentation diagram infographic slide
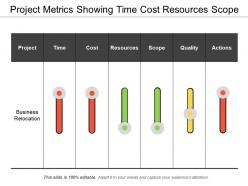
Presenting this set of slides with name - Project Metrics Showing Time Cost Resources Scope. This is a six stage process. The stages in this process are Project Kpis, Project Dashboard, Project Metrics.
-
 76882976 style essentials 2 financials 6 piece powerpoint presentation diagram infographic slide
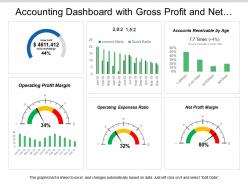
Introducing accounting dashboard with gross profit and net profit margin PPT slideshow. Loaded with incomparable benefits. Readymade PPT graphic helps in saving time and effort. Can be personalized by adding company trademark, logo, brand and symbols. Can be utilized for displaying both simple and complex information. Include or exclude slide content as per your individual need. Colors and text can be easily changed as the PPT slide is completely editable. Useful for every business leader and professional, project management team, business analysts, etc.
-
 65465252 style essentials 2 financials 6 piece powerpoint presentation diagram infographic slide
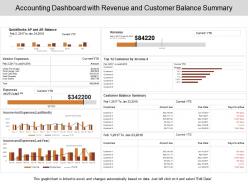
Pre-designed accounting dashboard with revenue and customer balance summary PPT template. High-resolution PowerPoint presentation backgrounds for better clarity of the information displayed. Offers wide variety of options and colors to alter the appearance. Allows adding of enterprise personal details such as brand name, logo and much more. Enough space available to enter text and its related points in the PPT slide. This slide is available in both Standard and Widescreen slide size. Compatible with multiple formats like JPEG, PDF and Google slides.
-
 72304757 style essentials 2 financials 6 piece powerpoint presentation diagram infographic slide
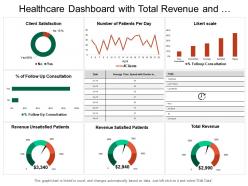
Presenting this set of slides with name - Healthcare Dashboard With Total Revenue And Patients Per Day. This is a six stage process. The stages in this process are Healthcare, Health Improvement, Medical Care.
-
 Survey results of company conduct employee engagement
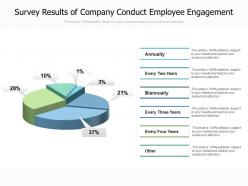
Presenting this set of slides with name Survey Results Of Company Conduct Employee Engagement. This is a six stage process. The stages in this process are Survey Results Of Company Conduct Employee Engagement. This is a completely editable PowerPoint presentation and is available for immediate download. Download now and impress your audience.
-
 21412449 style essentials 2 compare 6 piece powerpoint presentation diagram infographic slide
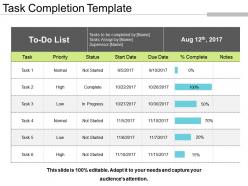
Presenting Task Completion Template Sample Presentation PPT. Individualize the slide as per choice. You can change anything in the template. Alter the colors, font type, and font style. It can be downloaded in various file formats, including JPG, PDF, and PNG. View this template on a standard screen and widescreen size. Its compatibility with Google Slides makes it accessible at once. This can be presented in front of a large number of people without any fear of pixelation.
-
 96193576 style essentials 2 financials 6 piece powerpoint presentation diagram infographic slide
Presenting this set of slides with name - Training Timeline Process Ppt Infographics Example Introduction. This is a six stage process. The stages in this process are Timeline, Business, Planning, Management, Process.


