Interactive All Essential 6 Stage Financial Presentation Slides
-
 76882976 style essentials 2 financials 6 piece powerpoint presentation diagram infographic slide
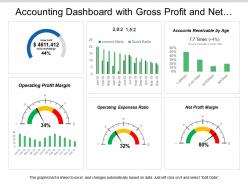
Introducing accounting dashboard with gross profit and net profit margin PPT slideshow. Loaded with incomparable benefits. Readymade PPT graphic helps in saving time and effort. Can be personalized by adding company trademark, logo, brand and symbols. Can be utilized for displaying both simple and complex information. Include or exclude slide content as per your individual need. Colors and text can be easily changed as the PPT slide is completely editable. Useful for every business leader and professional, project management team, business analysts, etc.
-
 Alibaba Business Model Cost Structure Ppt Diagram Ppt BMC SS
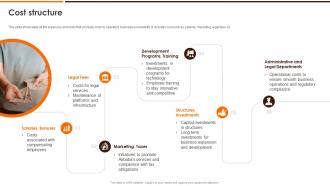
This slide showcases all the expenses and costs that company incur to operate it business successfully. It includes cost such as salaries, marketing, legal fees, et. Increase audience engagement and knowledge by dispensing information using Alibaba Business Model Cost Structure Ppt Diagram Ppt BMC SS. This template helps you present information on six stages. You can also present information on Administrative And Legal Departments, Structures Investments, Administrative And Legal Departments using this PPT design. This layout is completely editable so personaize it now to meet your audiences expectations.
-
 9157400 style division pie 6 piece powerpoint presentation diagram infographic slide
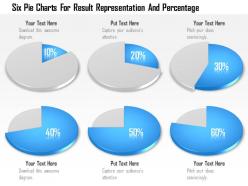
We are proud to present our 1114 six pie charts for result representation and percentage powerpoint template. This Power Point template slide has been designed with graphic of seven staged vertical timeline diagram. This PPT slide contains the concept of business timeline formation. Use this PPT slide and make exclusive presentations.
-
 66205630 style essentials 2 financials 6 piece powerpoint presentation diagram infographic slide
Presenting this set of slides with name - Kpi Icon For Market Analysis. This is a six stage process. The stages in this process are Metrics Icon, Kpi Icon, Statistics Icon.
-
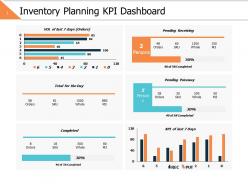 10278578 style essentials 2 financials 6 piece powerpoint presentation diagram infographic slide
Presenting this set of slides with name - Inventory Planning Kpi Dashboard Ppt Powerpoint Presentation File Clipart Images. This is a six stage process. The stages in this process are Business, Management, Strategy, Analysis, Finance.
-
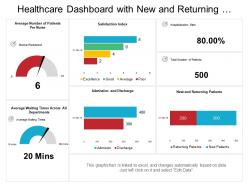 98098391 style essentials 2 financials 6 piece powerpoint presentation diagram infographic slide
Presenting this set of slides with name - Healthcare Dashboard With New And Returning Patients. This is a six stage process. The stages in this process are Healthcare, Health Improvement, Medical Care.
-
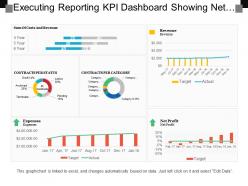 88315723 style essentials 2 financials 6 piece powerpoint presentation diagram infographic slide
Presenting this set of slides with name - Executing Reporting Kpi Dashboard Showing Net Profit Expenses Contracts Per Category. This is a six stage process. The stages in this process are Executive Reporting, Executive Analysis, Executive Performance.
-
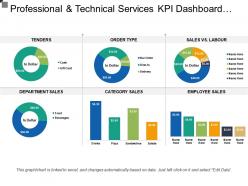 70013662 style essentials 2 financials 6 piece powerpoint presentation diagram infographic slide
Presenting this set of slides with name - Professional And Technical Services Kpi Dashboard Showing Department Sales. This is a six stage process. The stages in this process are Professional And Technical Services, Services Management, Technical Management.
-
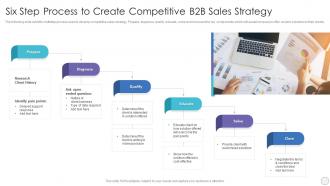 Six Step Process To Create Competitive B2B Sales Strategy
The following slide exhibits multistep process used to develop competitive sales strategy. Prepare, diagnose, qualify, educate, solve and close are the key components which will assist company to offer custom solutions to their clients. Introducing our premium set of slides with Six Step Process To Create Competitive B2B Sales Strategy. Ellicudate the six stages and present information using this PPT slide. This is a completely adaptable PowerPoint template design that can be used to interpret topics like Research, Client History, Qualify, Educate, Solve, Diagnose, Prepare. So download instantly and tailor it with your information.
-
 Unlocking Power Of Mutual Fees And Expenses Associated With Mutual Funds Fin SS
This slide shows information about all types of fees and expenses for trading or investing in mutual funds. It includes expense ratio, load or sales charges, 12b-1 fees, management fees, etc. Increase audience engagement and knowledge by dispensing information using Unlocking Power Of Mutual Fees And Expenses Associated With Mutual Funds Fin SS This template helps you present information on Six stages. You can also present information on Expense Ratio, Load Or Sales Charges, Trading Costs using this PPT design. This layout is completely editable so personaize it now to meet your audiences expectations.
-
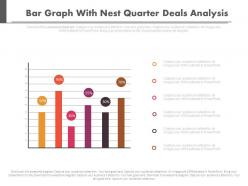 5217914 style essentials 2 financials 6 piece powerpoint presentation diagram infographic slide
Presenting bar graph with next quarter deals analysis powerpoint slides. This is a bar graph with next quarter deals analysis powerpoint slides. This is a six stage process. The stages in this process are financials.
-
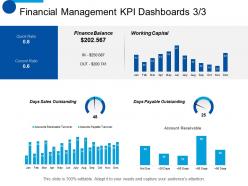 72930286 style essentials 2 financials 6 piece powerpoint presentation diagram infographic slide
Presenting this set of slides with name - Financial Management KPI Dashboards Business Ppt Summary Smartart. This is a six stage process. The stages in this process are Finance, Analysis, Business, Investment, Marketing.
-
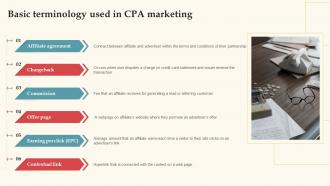 Basic Terminology Used In CPA Marketing Complete Guide For Deploying CPA Ppt Diagrams
Increase audience engagement and knowledge by dispensing information using Basic Terminology Used In CPA Marketing Complete Guide For Deploying CPA Ppt Diagrams. This template helps you present information on six stages. You can also present information on Affiliate Agreement, Commission, Marketing using this PPT design. This layout is completely editable so personaize it now to meet your audiences expectations.
-
 78459388 style essentials 2 financials 6 piece powerpoint presentation diagram infographic slide
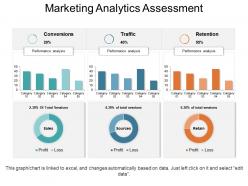
Presenting Marketing Analytics Assessment PowerPoint Templates.The designs are 100% editable in this PowerPoint template. The font size, font color, graphic colors, and slide background can be customized without any hassle. The users can add or remove the images according to their needs. This template includes one slide which is designed by keeping compatibility with Google Slides in mind. It is available in both standard and widescreen.
-
 52569913 style essentials 2 financials 6 piece powerpoint presentation diagram infographic slide
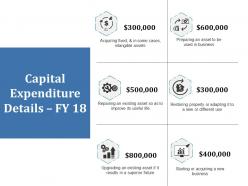
Presenting this set of slides with name - Capital Expenditure Details Ppt Show. This is a six stage process. The stages in this process are Finance, Marketing, Analysis, Strategy, Icon.
-
 5588730 style division pie 6 piece powerpoint presentation diagram infographic slide
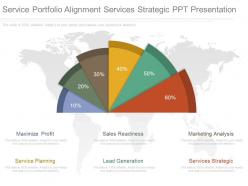
Presenting service portfolio alignment services strategic ppt presentation. This is a service portfolio alignment services strategic ppt presentation. This is a six stage process. The stages in this process are maximize profit, sales readiness, marketing analysis, service planning, lead generation, services strategic.
-
 41676910 style essentials 2 financials 6 piece powerpoint presentation diagram infographic slide
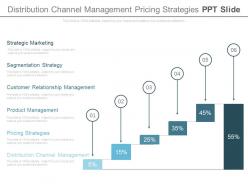
Presenting distribution channel management pricing strategies ppt slide. This is a distribution channel management pricing strategies ppt slide. This is a six stage process. The stages in this process are management, finance.
-
 55756447 style concepts 1 growth 6 piece powerpoint presentation diagram template slide
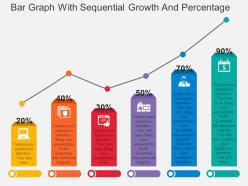
Presenting ppt bar graph with sequential growth and percentage flat powerpoint design. This Power Point template diagram has been crafted with graphic of bar graph and percentage icons. This PPT diagram contains the concept of sequential growth and financial planning. Use this PPT diagram for business and finance related presentations.
-
 68785051 style essentials 2 financials 6 piece powerpoint presentation diagram infographic slide
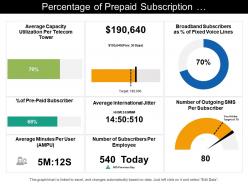
Presenting this set of slides with name - Percentage Of Prepaid Subscription Telecommunications Dashboard. High resolution presentation slide as pixels never break. Wide screen projection does not affect the output adversely. Easy to edit and customize colorful PPT design. Easy share information with this PowerPoint template. Increase the level of personalization with your company logo and name. Compatible with all software and can be saved in any format JPG and PDF. Presentation diagram can be downloaded within few seconds and can be saved easily.
-
 34180412 style essentials 2 financials 6 piece powerpoint presentation diagram infographic slide
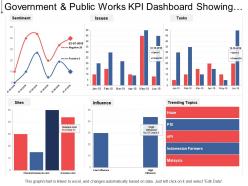
Presenting this set of slides with name - Government And Public Works Kpi Dashboard Showing Sentiment Trending Topics And Issues. This is a six stage process. The stages in this process are Government And Public Works, Government And Public Tasks.
-
 64728756 style essentials 2 financials 6 piece powerpoint presentation diagram infographic slide
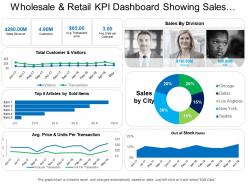
Presenting the KPI dashboard presentation template. This PPT template is 100% customizable in MS PowerPoint and is designed under the strict supervision of professionals. The user can edit the objects in the slide like font size and font color without any hassle. This presentation template is 100% compatible with Google Slide and can be saved in JPG or PDF file format easily. Click on the download tab to download this presentation template.
-
 70398468 style essentials 2 financials 6 piece powerpoint presentation diagram infographic slide
Presenting this set of slides with name - Procurement Suppliers Defect Rate And Type Dashboard. This is a six stage process. The stages in this process are Purchase, Procurement, Buy.
-
 94889682 style essentials 2 financials 6 piece powerpoint presentation diagram infographic slide
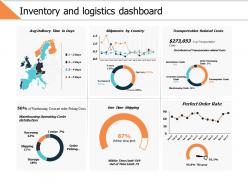
Presenting this set of slides with name - Inventory And Logistics Dashboard Ppt Powerpoint Presentation File Templates. This is a six stage process. The stages in this process are Business, Management, Strategy, Analysis, Finance.
-
 13601181 style essentials 2 financials 6 piece powerpoint presentation diagram template slide
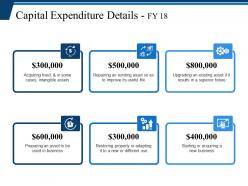
Presenting this set of slides with name - Capital Expenditure Details Ppt Topics. This is a six stage process. The stages in this process are Business, Management, Marketing, Finance, Analysis.
-
 45441355 style division donut 6 piece powerpoint presentation diagram infographic slide
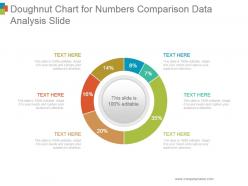
Presenting doughnut chart for numbers comparison data analysis slide powerpoint topics. This is a doughnut chart for numbers comparison data analysis slide powerpoint topics. This is a six stage process. The stages in this process are circular, process, percentage, financial, business.
-
 52464925 style essentials 2 financials 6 piece powerpoint presentation diagram infographic slide
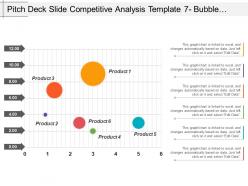
Presenting Pitch Deck Slide Competitive Analysis Template 7 Bubble Chart PPT Slide Styles. Customize the slide by modifying the colors, font and background. Transform it in formats like JPG, PNG, JPEG, and PDF. The slide is Google Slides friendly. Avail it in standard screen and widescreen size. It is made up of high-resolution graphics that do not pixelate when viewed on widescreen.
-
 87301869 style essentials 2 financials 6 piece powerpoint presentation diagram infographic slide
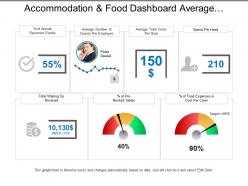
Presenting this set of slides with name - Accommodation And Food Dashboard Average Number Of Guests Per Employee. This is a six stage process. The stages in this process are Accommodation And Food, Shelter And Food, Accommodation And Beverages.
-
 4361418 style essentials 2 financials 6 piece powerpoint presentation diagram infographic slide
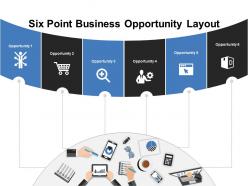
Presenting Six Point Business Opportunity Layout PowerPoint Themes. The slide is customizable and can be altered as per your needs. Modify the font color, font type, font size of the slide. You can add or remove the number of fields in the PPT layout. Add the text in the text placeholders and deliver presentations effortlessly. Convert and save it into various formats, including JPG, PDF, JPEG, and PDF file formats. The slide can be clearly viewed on full screen because of its high picture quality. You can also avail it in standard screen size (4:3).
-
 13606650 style essentials 2 financials 6 piece powerpoint presentation diagram infographic slide
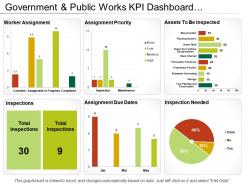
Presenting the KPI dashboard presentation slide. This KPI presentation template is completely modifiable and is designed professionally. You can edit the objects in this slide like font color and font size without going through any fuss. This presentation slide is fully compatible with Google Slide and can be saved in JPG or PDF file format hassle-free. To download this, click on the button below.
-
 56986539 style essentials 2 financials 6 piece powerpoint presentation diagram infographic slide
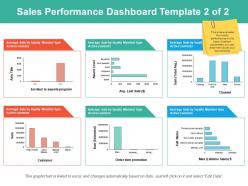
Presenting this set of slides with name - Sales Performance Dashboard Template 2 Of 2 Ppt Powerpoint Presentation Pictures Microsoft. This is a six stage process. The stages in this process are Business, Analysis, Marketing, Management, Strategy.
-
 15008479 style concepts 1 growth 6 piece powerpoint presentation diagram infographic slide
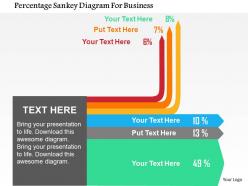
We are proud to present our percentage sankey diagram for business flat powerpoint design. Graphic of percentage Sankey diagram has been used to craft this power point template diagram. This PPT diagram contains the concept of visualization from one set of values to other. Use this PPT diagram and build an exclusive presentation for your business related topics.
-
 12721344 style essentials 2 financials 6 piece powerpoint presentation diagram infographic slide
Presenting six staged pie chart for financial management analysis powerpoint slides. This Power Point template diagram has been crafted with graphic of six staged pie chart and percentage diagram. This PPT diagram contains the concept of financial management analysis. Use this PPT diagram for business and finance related presentations.
-
 40334523 style essentials 2 financials 6 piece powerpoint presentation diagram infographic slide
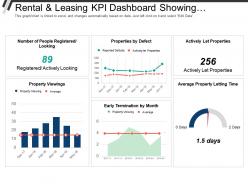
Presenting this set of slides with name - Rental And Leasing Kpi Dashboard Showing Properties By Defect And Actively Let Properties. This is a six stage process. The stages in this process are Rental And Leasing, Dealing And Leasing, Rental And Engage.
-
 90168469 style essentials 2 financials 6 piece powerpoint presentation diagram infographic slide
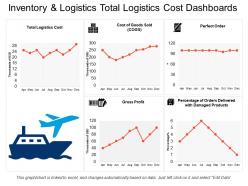
Presenting inventory and logistics total logistics cost dashboards PowerPoint template. High resolution PowerPoint visual. Slide has a creative and professional layout which is editable. Offers modification in font, colors and process. Easy to download and saves valuable time and effort. Personalization by insertion of company trade name/ logo. Available in both Standard and Widescreen format. Downloadable PPT diagram to insert text and share. Beneficial for marketers, students, sales people, analysts, researchers, etc. Compatible with PowerPoint for windows and Mac as well as Google slide.
-
 70753806 style essentials 2 financials 6 piece powerpoint presentation diagram infographic slide
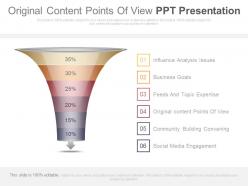
Presenting original content points of view ppt presentation. Presenting original content points of view ppt presentation. This is a original content points of view ppt presentation. This is a six stage process. The stages in this process are marketing, process, business, strategy, management, finance.
-
 88485341 style essentials 2 financials 6 piece powerpoint presentation diagram infographic slide
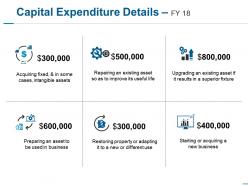
Presenting this set of slides with name - Capital Expenditure Details Fy 18 Ppt Show Smartart. This is a six stage process. The stages in this process are Finance, Business, Marketing, Strategy, Icons.
-
 26098870 style essentials 2 financials 6 piece powerpoint presentation diagram infographic slide
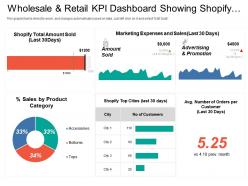
Presenting the retail business presentation template for PowerPoint. This PowerPoint template is 100% editable in PowerPoint and is professionally designed. You can edit the objects in the slide like font size and font color very easily. This presentation template is 100% compatible with Google Slide and can be saved in JPG or PDF file format without any fuss. Fast download this at the click of the button.
-
 59851949 style essentials 2 financials 6 piece powerpoint presentation diagram infographic slide
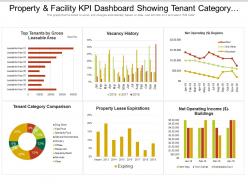
Get a chance to explore, property and facility KPI dashboard showing tenant category comparison and vacancy history PowerPoint Presentation Slide. This Presentation has been designed by professionals and is fully editable. You can remodel the font size, font type, colors, and even the background. This Template is friendly with Google Slide and can be saved in JPG or PDF format without any chaos created. Fast download at the click of the button.
-
 60225619 style essentials 2 financials 6 piece powerpoint presentation diagram infographic slide
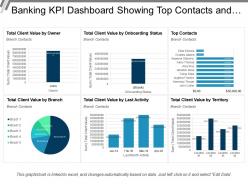
Presenting this set of slides with name - Banking Kpi Dashboard Sowing Top Contacts And Client Value. This is a six stage process. The stages in this process are Banking, Finance, Money.
-
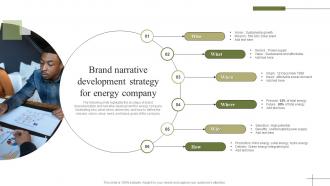 Brand Narrative Development Strategy For Energy Company
The following slide highlights the six steps of brand characterization and narrative development for energy company illustrating who, what, when, where why and how to define the mission, vision, value, need, and future goals of the company. Introducing Brand Narrative Development Strategy For Energy Company. to increase your presentation threshold. Encompassed with six stages, this template is a great option to educate and entice your audience. Dispence information on Who, What, When, using this template. Grab it now to reap its full benefits.
-
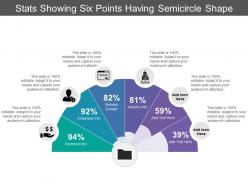 90053744 style essentials 2 financials 6 piece powerpoint presentation diagram infographic slide
Presenting this set of slides with name - Stats Showing Six Points Having Semicircle Shape. This is a six stage process. The stages in this process are Stats, Statistics, Data.
-
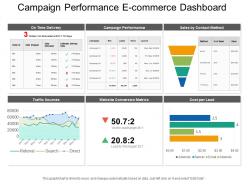 66723388 style essentials 2 financials 6 piece powerpoint presentation diagram infographic slide
Presenting this set of slides with name - Campaign Performance E Commerce Dashboard. This is a six stage process. The stages in this process are Mercantilism, Commercialism, Ecommerce.
-
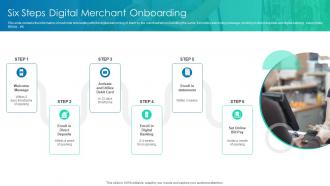 Six Steps Digital Merchant Onboarding
This slide contains the information of customer onboarding with the digital welcoming of them by the merchant who is handling the same. It includes welcoming message, enrolling in direct deposits and digital banking, setup online bill pay, etc. Presenting our set of slides with Six Steps Digital Merchant Onboarding. This exhibits information on six stages of the process. This is an easy to edit and innovatively designed PowerPoint template. So download immediately and highlight information on Welcome Message, Enroll Statements, Set Online, Bill Pay.
-
 Treasury Maintenance System To Control Financial Risk
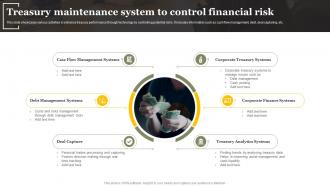
This slide showcases various activities to enhance treasury performance through technology by controlling potential risks. It includes information such as cash flow management, debt, deal capturing, etc. Introducing our premium set of slides with Treasury Maintenance System To Control Financial Risk. Ellicudate the six stages and present information using this PPT slide. This is a completely adaptable PowerPoint template design that can be used to interpret topics like Debt Management Systems, Deal Capture, Treasury Analytics Systems. So download instantly and tailor it with your information.
-
 57903478 style essentials 2 financials 6 piece powerpoint presentation diagram infographic slide
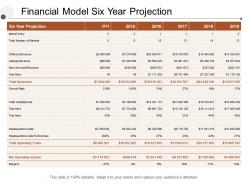
Presenting this set of slides with name - Financial Model Six Year Projection. This is a six stage process. The stages in this process are Financial Analysis, Income Statement, Balance Sheet.
-
 93434594 style essentials 2 financials 6 piece powerpoint presentation diagram infographic slide
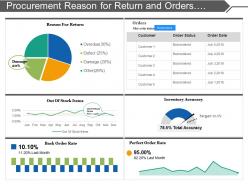
Presenting this set of slides with name - Procurement Reason For Return And Orders Detail Dashboard. This is a six stage process. The stages in this process are Purchase, Procurement, Buy.
-
 23022299 style essentials 2 financials 6 piece powerpoint presentation diagram infographic slide
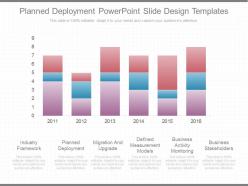
Presenting download planned deployment powerpoint slide design templates. This is a planned deployment powerpoint slide design templates. This is a six stage process. The stages in this process are industry framework, planned deployment, migration and upgrade, defined measurement models, business activity monitoring, business stakeholders.
-
 80359830 style essentials 2 financials 6 piece powerpoint presentation diagram infographic slide
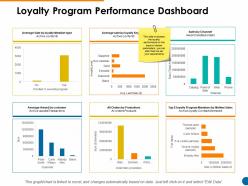
Presenting this set of slides with name - Loyalty Program Performance Dashboard Ppt Powerpoint Presentation Pictures Graphics. This is a six stage process. The stages in this process are Business, Strategy, Marketing, Analysis, Management.
-
 87880293 style essentials 2 financials 6 piece powerpoint presentation diagram infographic slide
Presenting this set of slides with name - 6 Factors Incentive Plan Icon. This is a six stage process. The stages in this process are Incentive Plan, Reward Plan, Bonus Strategies.
-
 70132589 style essentials 2 financials 6 piece powerpoint presentation diagram infographic slide
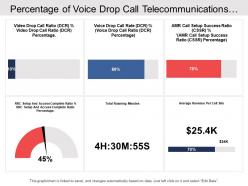
Presenting this set of slides with name - Percentage Of Voice Drop Call Telecommunications Dashboard. PPT design is completely compatible with Google slide. Download is speedy and can be easily integrate into the presentation. Presentation slide is created with great pixel quality. PowerPoint template is easy to display in standard and widescreen view. Image graphic gives valuable viewpoint to the entire presentation. Slide layout is easily convertible into JPG and PDEF format. Easy to edit the design element as color, font and content can be edited as required.
-
 94584479 style essentials 2 financials 6 piece powerpoint presentation diagram infographic slide
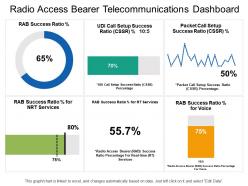
Presentation template comes with superiority images and designs. PowerPoint slide can be easily modified i.e. color and font. PPT design is quick to download and easily convertible into JPEG and PDF. Design can be acquired with different nodes and stages. PowerPoint di comes with access to share in both standard and widescreen view. Adjustable presentation graphic as compatible with Google slides. Preference to add business details such as business name, logo, tagline or other elements as required.
-
 85981689 style essentials 2 financials 6 piece powerpoint presentation diagram infographic slide
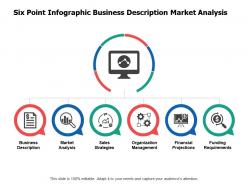
Showcasing six point infographic business description market analysis PowerPoint template. Fit to be used with the Google Slides. Replace the visuals, text and the content in the slide design. Change the size, style and orientation of the slides. Use your company’s name or brand name to make it your own presentation template. Beneficial for managers, professors, marketers, etc. Flexible option for conversion in PDF or JPG formats. Available in Widescreen format also. Useful for making business plan and strategies.
-
 59675071 style concepts 1 growth 6 piece powerpoint presentation diagram infographic slide
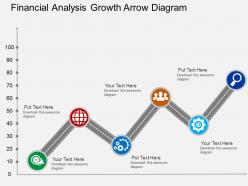
We are proud to present our financial analysis growth arrow diagram flat powerpoint design. Concept of financial analysis and growth has been defined in this power point template diagram. This PPT diagram contains the graphic of growth arrow. Use this PPT diagram for business and finance related presentations.
-
 53403579 style essentials 2 financials 6 piece powerpoint presentation diagram infographic slide
Presenting this set of slides with name - 6 Steps Incentive Plan Icon. This is a six stage process. The stages in this process are Incentive Plan, Reward Plan, Bonus Strategies.
-
 51359739 style essentials 2 financials 6 piece powerpoint presentation diagram infographic slide
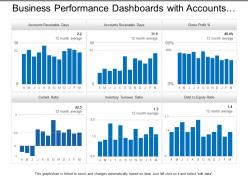
Presenting business performance dashboards with accounts receivable and accounts payable PPT template. These PPT graphics allow you to resize and recolor the images. Good quality images can be used to complement and reinforce the learning. Works well with all software's and Google Slides. Editing in display slideshow can be done from wherever by compatible devices. Convert PPT to PDF at ease.
-
 89955254 style essentials 2 financials 6 piece powerpoint presentation diagram template slide
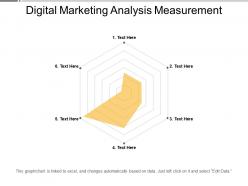
Presenting Digital Marketing Analysis Measurement. The slide also supports the widescreen(16:9) and the standard screen(4:3) sizes. The PPT can be made inclusive of various components such as charts and graphs. It is also compatible with Google Slides and can be converted into many common image and document formats like JPEG, PNG or PDF. High-quality graphics ensure that quality is not compromised at any cost.
-
 73930552 style essentials 2 financials 6 piece powerpoint presentation diagram infographic slide
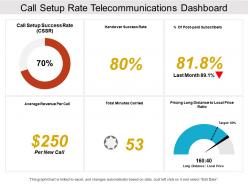
Presenting this set of slides with name - Call Setup Rate Telecommunications Dashboard. Fully editable Presentation design as text, color, shade, shape and size can be edited. PowerPoint slide can be used individually or in association with other designs. High resolution PPT template ensures better picture display. Presentation diagram is compatible with both standard and wide screen. PPT graphic is adaptable to different software’s such as JPG and PDF and can also be merged with Google slides. Easy to download and save at any location in the system.
-
 Assets and revenue financial summary corporate tactical action plan template company ppt microsoft
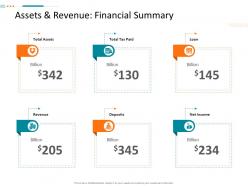
Introducing Assets And Revenue Financial Summary Corporate Tactical Action Plan Template Company Ppt Microsoft to increase your presentation threshold. Encompassed with six stages, this template is a great option to educate and entice your audience. Dispence information on Revenue, Net Income, Total Assets, using this template. Grab it now to reap its full benefits.
-
 68363798 style concepts 1 growth 6 piece powerpoint presentation diagram infographic slide
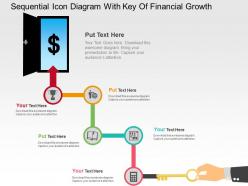
We are proud to present our sequentia icon diagram with key of financial growth flat powerpoint design. Graphic of sequential icon diagram with key has been used to craft this power point template diagram. This PPT diagram contains the concept of financial growth. Use this PPT diagram for business and finance related presentations.
-
 Finance tips for any business
Presenting this set of slides with name Finance Tips For Any Business. This is a six stage process. The stages in this process are Pay Off Debt, Contribute To Retirement Plan, Review Insurance Coverage, Have A Saving Plan, Maximize Employment Benefits, Keep Your Records Good. This is a completely editable PowerPoint presentation and is available for immediate download. Download now and impress your audience.


