87301869 style essentials 2 financials 6 piece powerpoint presentation diagram infographic slide
Our Accommodation And Food Dashboard Average Number Of Guests Per Employee are generous to the core. They freely contribute to your cause.
You must be logged in to download this presentation.
PowerPoint presentation slides
Presenting this set of slides with name - Accommodation And Food Dashboard Average Number Of Guests Per Employee. This is a six stage process. The stages in this process are Accommodation And Food, Shelter And Food, Accommodation And Beverages.
Content of this Powerpoint Presentation
Description:
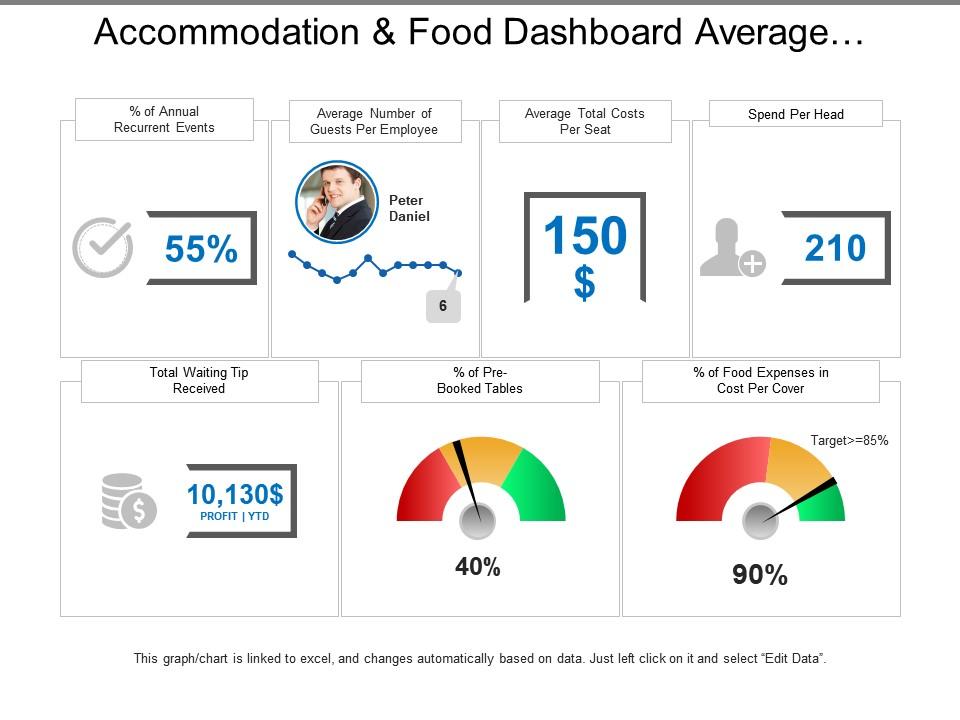
The image presents a dashboard interface, seemingly focused on the Accommodation & Food Services industry, showcasing various key performance indicators (KPIs). The dashboard title is partially visible, indicating some specificity in the application such as for average performance metrics.
Text Element Analysis:
1. % of Annual Recurrent Events: 55% likely indicates the proportion of events that repeat on an annual basis, an essential KPI for business sustainability and forecasting.
2. Average Number of Guests Per Employee: This is represented by a line graph with a photograph of a person, probably named Peter Daniel, suggesting this could be an employee productivity or workload statistic with a current value of 6.
3. Average Total Costs Per Seat: shows a monetary value of $150, which may denote the cost incurred by the business per customer.
4. Spend Per Head: at 210 units (currency not specified) could be an average revenue figure obtained from each customer.
5. Total Waiting Tip Received: has a graphical representation of stacked coins with a value of 10,130s (likely dollars), tagged as 'PROFIT | YTD' (Year-To-Date), suggesting tips contribute significantly to the profit.
6. % of Pre-Booked Tables: depicted by a gauge at 40%, thus indicating the portion of restaurant reservations made in advance.
7. % of Food Expenses in Cost Per Cover: shows another gauge with a pointer at 90% against a target of 85%, possibly revealing the cost control challenges relating to food expenses.
The dashboard is noted to be linked to an Excel spreadsheet, allowing for dynamic data updates.
Use Cases:
Based on the visualized KPIs, these slides can be adapted to various industries that focus on customer service, event management, and resource allocation:
1. Hospitality:
Use: To monitor customer service efficiency and profitability.
Presenter: Operations Manager.
Audience: Hotel Management Team.
2. Event Planning:
Use: To track frequency and profitability of recurring events.
Presenter: Event Coordinator.
Audience: Event Planning Committee.
3. Restaurant Management:
Use: For analysis of per-customer revenue and expense metrics.
Presenter: Restaurant Owner.
Audience: Staff and Stakeholders.
4. Financial Services:
Use: To display profitability and revenue trends for client businesses.
Presenter: Financial Analyst.
Audience: Business Clients.
5. Customer Experience Consultancy:
Use: To assess and improve employee productivity in relation to customer satisfaction.
Presenter: Customer Experience Consultant.
Audience: Business Owners.
6. Performance Analytics:
Use: To visualize metrics for employee performance reviews and resource allocation.
Presenter: HR Manager.
Audience: Human Resources Department.
7. Revenue Management:
Use: To manage and forecast revenue from per-seat cost and pre-booking rates.
Presenter: Revenue Manager.
Audience: Executive Team.
87301869 style essentials 2 financials 6 piece powerpoint presentation diagram infographic slide with all 6 slides:
Decisions begin to go in your favour due to our Accommodation And Food Dashboard Average Number Of Guests Per Employee. It ensures good impressions form.
No Reviews


