28960264 style essentials 2 financials 6 piece powerpoint presentation diagram infographic slide
Our Emergency Police And Justice Dashboard With Community Perception Of Safety bring about harmony. An amicable atmosphere gets generated.
- Google Slides is a new FREE Presentation software from Google.
- All our content is 100% compatible with Google Slides.
- Just download our designs, and upload them to Google Slides and they will work automatically.
- Amaze your audience with SlideTeam and Google Slides.
-
Want Changes to This PPT Slide? Check out our Presentation Design Services
- WideScreen Aspect ratio is becoming a very popular format. When you download this product, the downloaded ZIP will contain this product in both standard and widescreen format.
-

- Some older products that we have may only be in standard format, but they can easily be converted to widescreen.
- To do this, please open the SlideTeam product in Powerpoint, and go to
- Design ( On the top bar) -> Page Setup -> and select "On-screen Show (16:9)” in the drop down for "Slides Sized for".
- The slide or theme will change to widescreen, and all graphics will adjust automatically. You can similarly convert our content to any other desired screen aspect ratio.
Compatible With Google Slides

Get This In WideScreen
You must be logged in to download this presentation.
PowerPoint presentation slides
Presenting this set of slides with name - Emergency Police And Justice Dashboard With Community Perception Of Safety. This is a six stage process. The stages in this process are Emergency, Police And Justice, Police And Emergency Services, Justice And Public Security.
Content of this Powerpoint Presentation
Description:
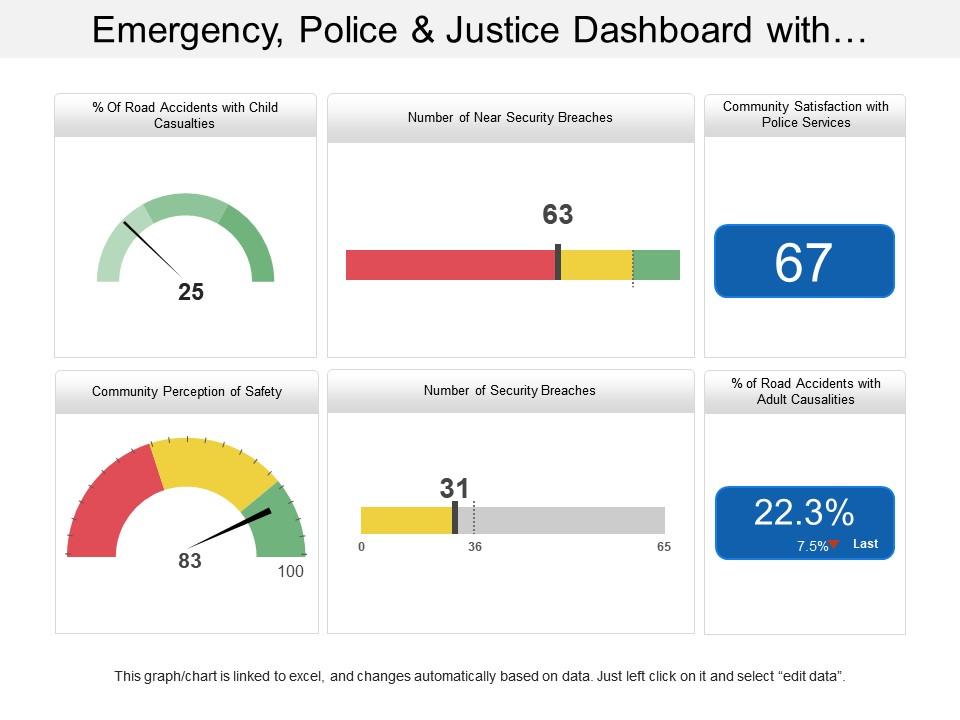
The image displays a PowerPoint slide titled "Emergency, Police & Justice Dashboard," which presents a series of key performance indicators (KPIs) related to public safety and emergency services.
The KPIs are visually represented through gauges, bars, and numerical values, and they include:
1. % Of Road Accidents with Child Casualties: Shown on a semi-circle gauge with the needle pointing to 25, likely indicating a percentage.
2. Number of Near Security Breaches: Depicted with a horizontal bar, filled up to 63, possibly indicating the count of incidents.
3. Community Satisfaction with Police Services: Represented by a numerical value of 67, which may reflect a percentage score of satisfaction from a survey.
4. Community Perception of Safety: Illustrated with a gauge showing a reading of 83 out of 100, suggesting a high level of perceived safety within the community.
5. Number of Security Breaches: A bar chart showing a current value of 31, against a possible full scale of 65.
% of Road Accidents with Adult Casualties: A numerical and percentage indicator showing 22.3%, with a note indicating a change from the last measurement (7.5% Last).
Use Cases:
This type of dashboard is useful for various stakeholders to quickly assess the performance and impact of emergency and law enforcement services. Here are seven industries where such a slide could be useful:
1. Public Safety:
Use: Monitoring and improving road safety measures.
Presenter: Traffic Safety Analyst.
Audience: Public Safety Officials.
2. Government:
Use: Assessing the effectiveness of community policing strategies.
Presenter: Police Commissioner.
Audience: City Council, Public.
3. Healthcare:
Use: Planning for emergency services based on accident data.
Presenter: Hospital Administrator.
Audience: Emergency Response Teams.
4. Education:
Use: Evaluating child safety in school zones.
Presenter: School District Superintendent.
Audience: Parents, School Board.
5. Insurance:
Use: Analyzing risk factors for road accidents.
Presenter: Risk Assessment Manager.
Audience: Insurance Underwriters.
6. Urban Planning:
Use: Integrating safety data into city development plans.
Presenter: Urban Planner.
Audience: Planning Commission.
7. Transportation:
Use: Addressing safety concerns in public transport policy.
Presenter: Transit Authority Official.
Audience: Transportation Committee, General Public.
28960264 style essentials 2 financials 6 piece powerpoint presentation diagram infographic slide with all 6 slides:
Explore different avenues with our Emergency Police And Justice Dashboard With Community Perception Of Safety. They are good for conducting experiments.
No Reviews


