71364285 style essentials 2 financials 4 piece powerpoint presentation diagram infographic slide
Display intense determination with our Healthcare Dashboard With Customer Satisfaction And Patient Metrics. Demonstrate that you are driven by ambition.
You must be logged in to download this presentation.
 Impress your
 audience
Editable
of Time
PowerPoint presentation slides
Presenting this set of slides with name - Healthcare Dashboard With Customer Satisfaction And Patient Metrics. This is a four stage process. The stages in this process are Healthcare, Health Improvement, Medical Care.
Content of this Powerpoint Presentation
Description:
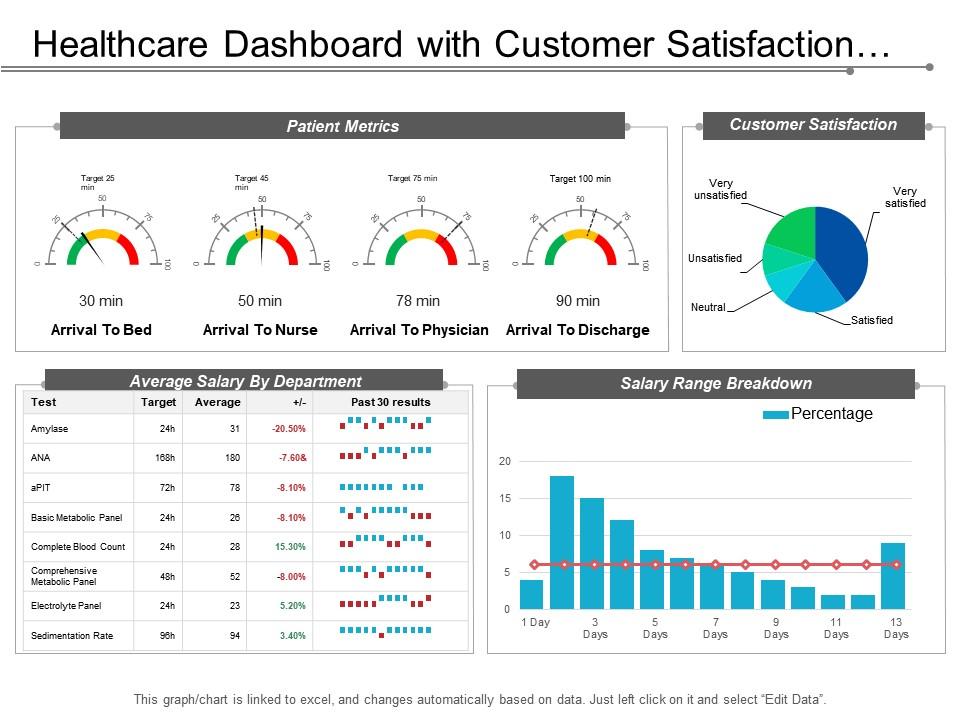
The image depicts a slide from a healthcare dashboard focused on customer satisfaction and patient metrics.
The dashboard is divided into various sections, each representing different data points:
1. Patient Metrics:
This section contains gauges displaying time metrics such as 'Arrival to Bed', 'Arrival to Nurse', 'Arrival to Physician', and 'Arrival to Discharge'. Each gauge has a target time and shows the actual time in minutes, with color coding representing the performance relative to the target.
2. Customer Satisfaction:
Here, a pie chart illustrates patient satisfaction levels, ranging from 'Very unsatisfied' to 'Very satisfied'. The size of each slice indicates the proportion of responses in each category.
3. Average Salary By Department:
A table lists various tests or departments, their target and average salary figures, and a visual representation of the past 30 results. The '+/-' column shows the percentage difference from the target.
4. Salary Range Breakdown:
A bar graph combined with a line graph (likely indicating a trend over time) shows the salary range distribution across a timeline.
The slide also notes that the graph/chart is linked to Excel and changes automatically based on data, indicating that it is dynamic and can be updated by editing the linked data source.
Use Cases:
Data-driven dashboards are indispensable across industries for monitoring performance, enhancing decision-making, and driving customer satisfaction.
1. Healthcare:
Use: Tracking patient care and satisfaction metrics
Presenter: Hospital Administrator
Audience: Medical Staff, Department Heads
2. Retail:
Use: Analyzing customer feedback and sales performance
Presenter: Retail Manager
Audience: Sales Teams, Store Managers
3. Manufacturing:
Use: Overseeing production efficiency and worker productivity
Presenter: Operations Manager
Audience: Production Supervisors, Quality Assurance Teams
4. Hospitality:
Use: Gauging guest satisfaction and service delivery times
Presenter: Hotel General Manager
Audience: Service Staff, Department Leads
5. Finance:
Use: Monitoring transaction processing times and client feedback
Presenter: Bank Manager
Audience: Customer Service Reps, Financial Analysts
6. Education:
Use: Tracking student services and satisfaction levels
Presenter: University Registrar
Audience: Academic Advisors, Administrative Staff
7. Technology:
Use: Measuring support response times and user satisfaction
Presenter: Customer Support Director
Audience: Support Teams, Product Managers
71364285 style essentials 2 financials 4 piece powerpoint presentation diagram infographic slide with all 6 slides:
Our Healthcare Dashboard With Customer Satisfaction And Patient Metrics are aesthetically designed to attract attention. We guarantee that they will grab all the eyeballs you need.
-
Great product with highly impressive and engaging designs.
-
Topic best represented with attractive design.


