Finest Range 9 Step All Essential Financial Presentation Diagram
-
 11007326 style essentials 2 financials 9 piece powerpoint presentation diagram infographic slide
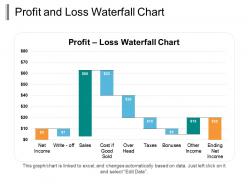
Presenting the Profit And Loss Waterfall Chart PPT Infographic Template. You can edit this template in PowerPoint. The PPT layout is customizable. You can link the slide to your excel sheet and the graph will change accordingly. The slide is available in both standard and wide screen formats. You can change the colors of the chart and bars and the background as well to suit your needs. So go ahead and make your presentation with a few clicks.
-
 45829420 style essentials 2 financials 9 piece powerpoint presentation diagram infographic slide
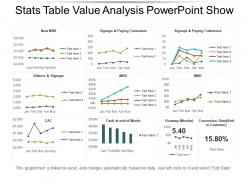
Presenting stats table value analysis PowerPoint show. This layout offers you plenty of space to put in titles and sub titles. High resolution-based layout, does not change the image even after resizing. This presentation icon is fully compatible with Google slides. Quick downloading speed and simple editing options in color text and fonts.PPT icons can easily be changed into JPEG and PDF applications. This diagram has been designed for entrepreneurs, corporate and business managers. Easy to use, edit and you can design attractive slides within few minutes.
-
 9641474 style essentials 2 financials 9 piece powerpoint presentation diagram infographic slide
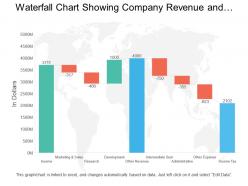
Presenting the revenue presentation template. This creative template is ready-to-use and is professionally designed. You can easily modify the font color and font size as the template is fully customizable. The template can be edited in PowerPoint and can be saved into the JPG or PDF file format. To download this PPT template, click on the download tab provided below.
-
 93401630 style essentials 2 financials 9 piece powerpoint presentation diagram infographic slide
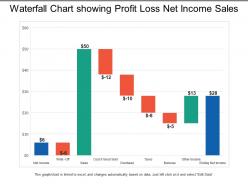
Presenting this set of slides with name - Waterfall Chart Showing Profit Loss Net Income Sales. This is a nine stage process. The stages in this process are Agile, Waterfall, Scrum, Sprint.
-
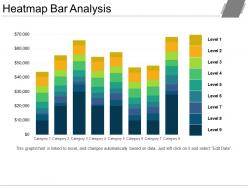 55988225 style essentials 2 financials 9 piece powerpoint presentation diagram template slide
Presenting the Heatmap Bar Analysis PowerPoint slide. This ready to use PowerPoint presentation can be downloaded in various formats like PDF, JPG and PNG. You can change the color, font size, font type and shapes of this PPT layout according to your needs. This PPT template is compatible with Google Slides and is available in both 4:3 and 16:9 aspect ratios.
-
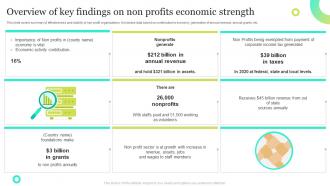 Overview Of Key Findings On Non Profits Economic Strength
This slide covers summary of effectiveness and viability of non profit organizations. It includes data based on contribution to economy, generation of annual revenue, annual grants, etc. Presenting our set of slides with Overview Of Key Findings On Non Profits Economic Strength. This exhibits information on nine stages of the process. This is an easy to edit and innovatively designed PowerPoint template. So download immediately and highlight information on Economic Activity, Annual Revenue, State Sources.
-
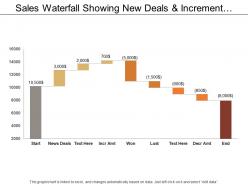 80725208 style essentials 2 financials 9 piece powerpoint presentation diagram infographic slide
Presenting this set of slides with name - Sales Waterfall Showing New Deals And Increment Amount. This is a nine stage process. The stages in this process are Sales Waterfall, Waterfall Chart.
-
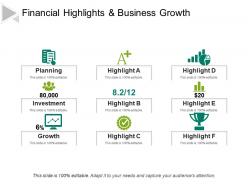 53096845 style essentials 2 financials 9 piece powerpoint presentation diagram infographic slide
We present to you our PowerPoint template on financial highlights and business growth. Our presentation has high resolution graphics and you can edit these to precisely match your style. All the images are 100 % editable in PowerPoint. The colors can also be customized according to the presenter. This template can be saved in either PDF or JPG format. So, hurry and download our presentation and grow your business.
-
 35054386 style essentials 2 financials 9 piece powerpoint presentation diagram infographic slide
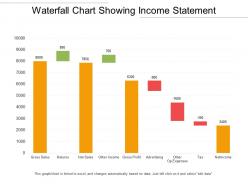
Presenting this set of slides with name - Waterfall Chart Showing Income Statement. This is a nine stage process. The stages in this process are Agile, Waterfall, Scrum, Sprint.
-
 16228225 style essentials 2 financials 9 piece powerpoint presentation diagram infographic slide
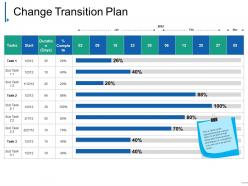
Presenting change transition plan powerpoint slide themes. This is a change transition plan powerpoint slide themes. This is a nine stage process. The stages in this process are task, sub task, complete, duration, percentage.
-
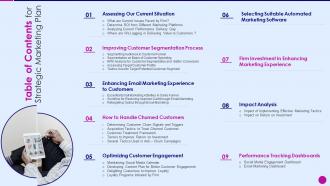 Table of contents for strategic marketing plan ppt slides picture
Increase audience engagement and knowledge by dispensing information using Table Of Contents For Strategic Marketing Plan Ppt Slides Picture. This template helps you present information on nine stages. You can also present information on Assessing Our Current Situation, Improving Customer Segmentation Process, Optimizing Customer Engagement, Impact Analysis, Performance Tracking Dashboards using this PPT design. This layout is completely editable so personaize it now to meet your audiences expectations.
-
 42579406 style division pie 9 piece powerpoint presentation diagram infographic slide
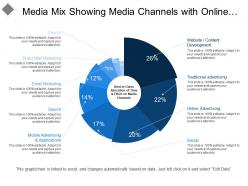
Presenting this set of slides with name - Media Mix Showing Media Channels With Online And Traditional Advertising. This is a nine stage process. The stages in this process are Media Mix, Communication Channel, Mass Media.
-
 97728521 style concepts 1 growth 9 piece powerpoint presentation diagram infographic slide
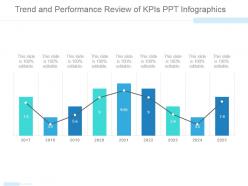
Presenting trend and performance review of kpis ppt infographics. This is a trend and performance review of kpis ppt infographics. This is a nine stage process. The stages in this process are graph, finance, business, marketing, year.
-
 10539998 style essentials 2 financials 9 piece powerpoint presentation diagram infographic slide
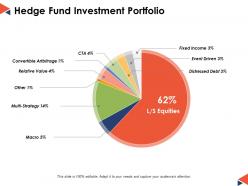
This is a nine stages process. The stages in this process are Pie Chart, Percentage, Marketing, Business, Analysis.
-
 29416083 style essentials 2 financials 9 piece powerpoint presentation diagram infographic slide
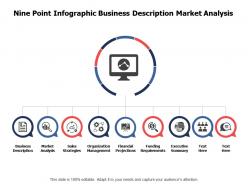
Presenting nine point infographic business description market analysis PowerPoint template. Access to edit the content, style, size and orientation of the PPT slides. Extremely spacious to cover all the aspects of the company profile. High resolution images do not pixelate when projected on wide screen. Personalize the PPT with your company name and logo. Modify the presentation elements as per the need of an hour. Compatible with numerous software and format options. Used by entrepreneurs, marketers, managerial department, stakeholders and students.
-
 15995718 style essentials 2 financials 9 piece powerpoint presentation diagram infographic slide
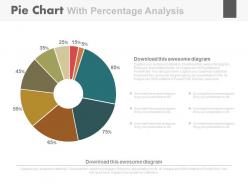
Presenting pie chart with percentage analysis and icons powerpoint slides. This Power Point template diagram has been crafted with graphic of pie chart and percentage diagram. This PPT diagram contains the concept of percentage analysis representation. Use this PPT diagram for business and finance related presentations.
-
 22552255 style essentials 2 financials 9 piece powerpoint presentation diagram infographic slide
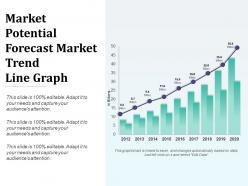
Presenting market potential forecast market trend ppt templates. This is a market potential forecast market trend ppt templates. This is a nine stage process. The stages in this process are business, bar graph, finance, strategy, marketing, success.
-
 Improve the finance and accounting function overview for finance outsourcing
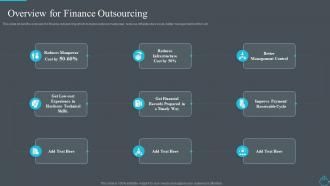
This slide shows the overview for finance outsourcing which includes reduces manpower, reduces infrastructure costs, better management control, etc. Introducing Improve The Finance And Accounting Function Overview For Finance Outsourcing to increase your presentation threshold. Encompassed with nine stages, this template is a great option to educate and entice your audience. Dispence information on Reduces Manpower, Cost Reduces Infrastructure, Cost Better Management Control, Improve Payment, Receivable Cycle, Get Financial Records Prepared, Timely Way, Get Low Cost Experience, Hardcore Technical Skills, using this template. Grab it now to reap its full benefits.
-
 Mortgage analysis real estate market snapshot price ppt powerpoint templates
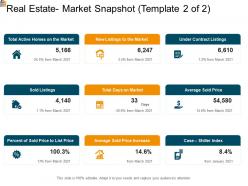
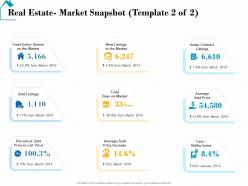
Introducing Mortgage Analysis Real Estate Market Snapshot Price Ppt Powerpoint Templates to increase your presentation threshold. Encompassed with nine stages, this template is a great option to educate and entice your audience. Dispence information on Price, Market, Sold Listings, Average Sold Price Increase, using this template. Grab it now to reap its full benefits.
-
 28330964 style essentials 2 financials 9 piece powerpoint presentation diagram infographic slide
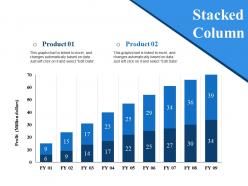
Presenting this set of slides with name - Stacked Column Ppt Styles. This is a nine stage process. The stages in this process are Stacked Column, Business, Marketing, Strategy, Management.
-
 89673727 style essentials 2 financials 9 piece powerpoint presentation diagram infographic slide
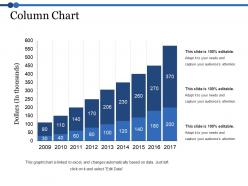
Presenting this set of slides with name - Column Chart Ppt Themes. This is a nine stage process. The stages in this process are Bar Graph, Finance, Planning, Strategy, Analysis.
-
 Implementing Employee Engagement Benefits Of High Employee Engagement Rate To The Company
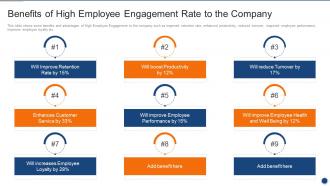
This slide shows some benefits and advantages of High Employee Engagement to the company such as improved retention rate, enhanced productivity, reduced turnover, improved employee performance, improves employee loyalty etc. Increase audience engagement and knowledge by dispensing information using Implementing Employee Engagement Benefits Of High Employee Engagement Rate To The Company. This template helps you present information on nine stages. You can also present information on Boost Productivity, Reduce Turnover, Improve Employee Health, Increases Employee Loyalty, Enhances Customer Service using this PPT design. This layout is completely editable so personaize it now to meet your audiences expectations.
-
 58282222 style essentials 2 financials 9 piece powerpoint presentation diagram infographic slide
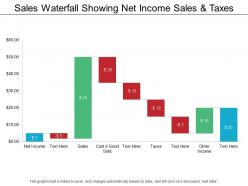
Presenting this set of slides with name - Sales Waterfall Showing Net Income Sales And Taxes. This is a nine stage process. The stages in this process are Sales Waterfall, Waterfall Chart.
-
 3396647 style cluster surround 9 piece powerpoint presentation diagram infographic slide
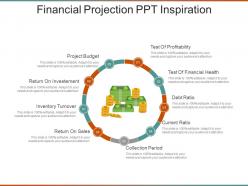
Presenting financial projection ppt inspiration. This is a financial projection ppt inspiration. This is a nine stage process. The stages in this process are test of profitability, test of financial health, debt ratio, current ratio, collection period, return on sales, inventory turnover, return on investment, project budget.
-
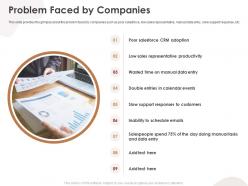 Problem faced by companies crm application ppt clipart
This slide provides the glimpse about the problem faced by companies such as poor salesforce, low sales representative, manual data entry, slow support response, etc. Introducing Problem Faced By Companies CRM Application Ppt Clipart to increase your presentation threshold. Encompassed with nine stages, this template is a great option to educate and entice your audience. Dispence information on Low Sales, Productivity, Manual Data Entry, Customers, Manual Tasks, using this template. Grab it now to reap its full benefits.
-
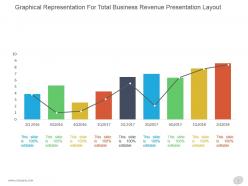 7637951 style essentials 2 financials 9 piece powerpoint presentation diagram infographic slide
Presenting graphical representation for total business revenue presentation layout. This is a graphical representation for total business revenue presentation layout. This is a nine stage process. The stages in this process are graph, success, business, marketing, growth, management.
-
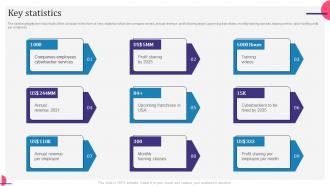 Online Business Service Company Profile Key Statistics CP SS V
The slide highlights the major facts of the company in the form of keys statistics which are company served, annual revenue, profit sharing target, upcoming franchises, monthly training classes, training videos, and monthly profit per employee Introducing Online Business Service Company Profile Key Statistics CP SS V to increase your presentation threshold. Encompassed with nine stages, this template is a great option to educate and entice your audience. Dispence information on Profit, Employees, Statistics, using this template. Grab it now to reap its full benefits.
-
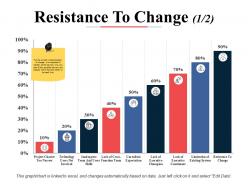 50534518 style essentials 2 financials 9 piece powerpoint presentation diagram infographic slide
This is a nine stages process. The stages in this process are Finance, Marketing, Management, Investment, Analysis.
-
 2307493 style essentials 2 financials 9 piece powerpoint presentation diagram infographic slide
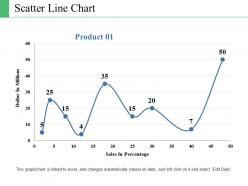
Presenting scatter line chart PowerPoint slide graphics PPT slide. The scatter plot behavior chart presentation slide designed by the professionals of SlideTeam to illustrate combination of all different values. The scatter plot diagram PPT template is fully editable in PowerPoint. The scatter chart analysis presentation slide also compatible with Google Slide and you can share with others as well. A user can make changes in the font size, font type, color as well as dimensions of the charts in scatter plot chart example PPT template as per his requirement.
-
 27932225 style essentials 2 financials 9 piece powerpoint presentation diagram infographic slide
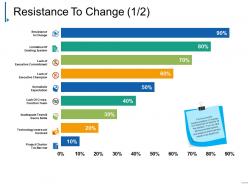
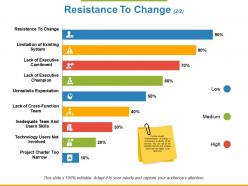
Presenting resistance to change ppt slide design. This is a resistance to change ppt slide design. This is a nine stage process. The stages in this process are resistance to change, limitation of existing system, lack of executive commitment, unrealistic expectation, project charter too narrow.
-
 29701378 style essentials 2 financials 9 piece powerpoint presentation diagram infographic slide
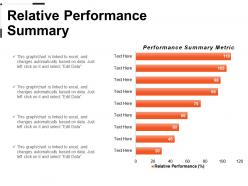
Presenting relative performance summary ppt slide design. This is a relative performance summary ppt slide design. This is a nine stage process. The stages in this process are performance analysis, performance assessment, performance evaluation, performance summary.
-
 Real estate market snapshot market real estate detailed analysis ppt show
Increase audience engagement and knowledge by dispensing information using Real Estate Market Snapshot Market Real Estate Detailed Analysis Ppt Show. This template helps you present information on nine stages. You can also present information on Total Active Homes On The Market, New Listings To The Market, Under Contract Listings, Sold Listings, Total Days On Market using this PPT design. This layout is completely editable so personaize it now to meet your audiences expectations.
-
 52593334 style essentials 2 financials 9 piece powerpoint presentation diagram infographic slide
This is a nine stages process. The stages in this process are Finance, Marketing, Management, Investment, Analysis.
-
 Key Statistics Unschool Company Profile Ppt Powerpoint Presentation Icon Good
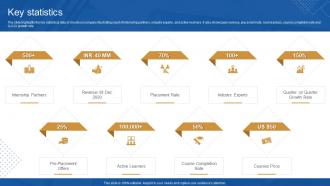
The slide highlights the key statistical data of Unschool company illustrating count of internship partners, industry experts, and active learners. It also showcases revenue, placement rate, course prices, course completion rate and Q-O-Q growth rate. Increase audience engagement and knowledge by dispensing information using Key Statistics Unschool Company Profile Ppt Powerpoint Presentation Icon Good. This template helps you present information on nine stages. You can also present information on Internship Partners, Placement Rate, Industry Experts using this PPT design. This layout is completely editable so personaize it now to meet your audiences expectations.
-
 53115163 style essentials 2 financials 9 piece powerpoint presentation diagram infographic slide
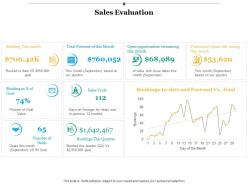
Presenting this set of slides with name - Sales Evaluation Sales Cycle Ppt Infographics Example Introduction. This is a nine stage process. The stages in this process are Finance, Analysis, Business, Investment, Marketing.
-
 6317957 style essentials 2 financials 9 piece powerpoint presentation diagram infographic slide
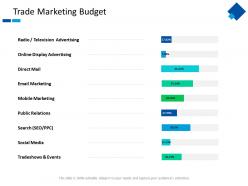
Presenting this set of slides with name - Trade Marketing Budget Mobile Marketing Ppt Powerpoint Presentation Layouts Files. This is a nine stages process.The stages in this process are Mobile Marketing, Public Relations, Social Media, Online Display Advertising, Email Marketing.
-
 68757033 style layered vertical 9 piece powerpoint presentation diagram infographic slide
Presenting this set of slides with name - Technical Industry Mobile Data Market Drivers With Percentages. This is a nine stage process. The stages in this process are Growth Drivers, Growth Opportunity, Market Drivers.
-
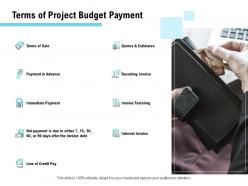 Terms of project budget payment ppt powerpoint presentation gallery background image
Presenting this set of slides with name Terms Of Project Budget Payment Ppt Powerpoint Presentation Gallery Background Image. This is a nine stage process. The stages in this process are Terms Of Sale, Payment In Advance, Immediate Payment, Quotes And Estimates, Recurring Invoice, Invoice Factoring, Interest Invoice. This is a completely editable PowerPoint presentation and is available for immediate download. Download now and impress your audience.
-
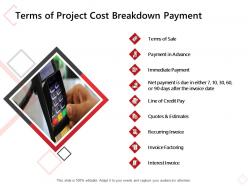 Terms of project cost breakdown payment ppt powerpoint presentation ideas grid
Presenting this set of slides with name Terms Of Project Cost Breakdown Payment Ppt Powerpoint Presentation Ideas Grid. This is a nine stage process. The stages in this process are Terms Of Sale, Payment In Advance, Immediate Payment, Recurring Invoice, Quotes And Estimates, Invoice Factoring, Interest Invoice. This is a completely editable PowerPoint presentation and is available for immediate download. Download now and impress your audience.
-
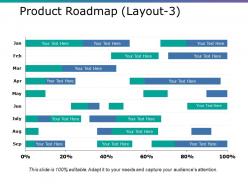 51463442 style layered vertical 9 piece powerpoint presentation diagram infographic slide
Presenting this set of slides with name - Product Roadmap Ppt Styles Example Topics. This is a nine stage process. The stages in this process are Percentage, Finance, Business, Step, Management.
-
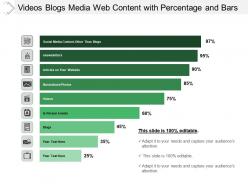 54799339 style essentials 2 financials 9 piece powerpoint presentation diagram infographic slide
Presenting Videos Blogs Media Web Content With Percentage And Bars presentation. This PPT layout is compatible with Google Slides. You can download this PPT theme in various formats like PDF, PNG, and JPG. This PowerPoint template is completely editable and you can modify the font size, font type, and shapes as per your requirements. This PPT slide is available in 4:3 and 16:9 aspect ratios
-
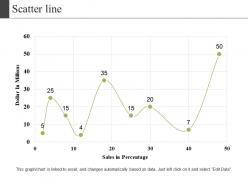 44024444 style essentials 2 financials 9 piece powerpoint presentation diagram infographic slide
Presenting this set of slides with name - Scatter Line Ppt Background. This is a three stage process. The stages in this process are Line, Marketing, Strategy, Finance, Planning.
-
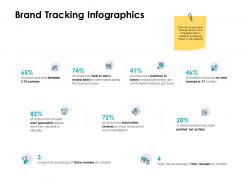 Brand tracking infographics ppt powerpoint presentation pictures
Presenting this set of slides with name Brand Tracking Infographics Ppt Powerpoint Presentation Pictures. This is a nine stage process. The stages in this process are Brand Tracking Infographics. This is a completely editable PowerPoint presentation and is available for immediate download. Download now and impress your audience.
-
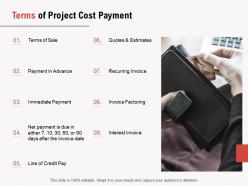 Terms of project cost payment ppt powerpoint presentation infographic template themes
Presenting this set of slides with name Terms Of Project Cost Payment Ppt Powerpoint Presentation Infographic Template Themes. This is a nine stage process. The stages in this process are Terms Sale, Payment Advance, Immediate Payment, Recurring Invoice, Invoice Factoring, Interest Invoice. This is a completely editable PowerPoint presentation and is available for immediate download. Download now and impress your audience.
-
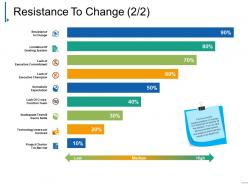 32263176 style essentials 2 financials 9 piece powerpoint presentation diagram infographic slide
Presenting resistance to change ppt slide examples. This is a resistance to change ppt slide examples. This is a nine stage process. The stages in this process are resistance to change, limitation of existing system, lack of executive commitment, unrealistic expectation, project charter too narrow.
-
 96852634 style essentials 2 financials 9 piece powerpoint presentation diagram infographic slide
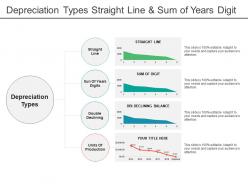
Presenting this set of slides with name - Depreciation Types Straight Line And Sum Of Years Digit. This is a nine stage process. The stages in this process are Depreciation, Devaluation, Decline.
-
 22951405 style essentials 2 financials 9 piece powerpoint presentation diagram infographic slide
Presenting this set of slides with name - Total Sales Brands Revenue And Unsold Stock E Commerce Dashboard. This is a nine stage process. The stages in this process are Mercantilism, Commercialism, Ecommerce.
-
 Table Of Contents For Exploring The Role Of Blockchain Across Diverse Applications BCT SS
Introducing Table Of Contents For Exploring The Role Of Blockchain Across Diverse Applications BCT SS to increase your presentation threshold. Encompassed with nine stages, this template is a great option to educate and entice your audience. Dispence information on Cryptocurrency Market Overview, Cryptocurrency Payments, Crypto Mining, using this template. Grab it now to reap its full benefits.
-
 Cyclic Revenue Model Different Types Of Revenue Models Ppt Professional Brochure
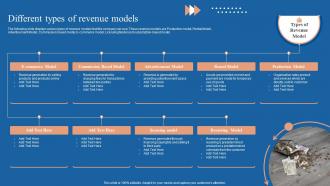
The following slide displays various types of revenue models that the company can use. These revenue models are Production model, Rental Model, Advertisement Model, Commission based model, E-commerce model, Licensing Model and subscription-based model. Introducing Cyclic Revenue Model Different Types Of Revenue Models Ppt Professional Brochure to increase your presentation threshold. Encompassed with nine stages, this template is a great option to educate and entice your audience. Dispence information on E Commerce Model, Commission Based Model, Advertisement Model, using this template. Grab it now to reap its full benefits.
-
 Techniques To Introduce Customer Value Comprehensive Guide To Sustainable Marketing Mkt SS
This slide covers methods to provide value to customers through several marketing activities. It includes techniques such as gathering customer feedback through customer service, providing rewards to customers, creating extra payment methods for convenient shopping experience, etc. Increase audience engagement and knowledge by dispensing information using Techniques To Introduce Customer Value Comprehensive Guide To Sustainable Marketing Mkt SS. This template helps you present information on Nine stages. You can also present information on Convenient Shopping Experience, Interests And Customer Costs, Success Of A Service using this PPT design. This layout is completely editable so personaize it now to meet your audiences expectations.
-
 4598589 style essentials 2 financials 9 piece powerpoint presentation diagram infographic slide
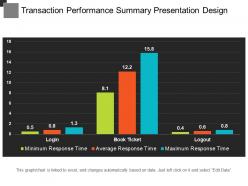
Presenting Transaction Performance Summary Presentation Design. A readymade, completely editable slide which is easy to use. Add the desired content anywhere in the slide. This PPT slide is available in both wide and standard screen sizes. Customize the font style, font color, and font size according to the requirement. The template is compatible with Google Slides. You can convert and save the slide to PDF and JPG formats.
-
 Bank Account Management System Features
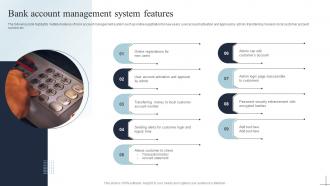
The following slide highlights multiple features of bank account management system such as online registration for new users, user account activation and approval by admin, transferring money to local customer account number etc. Increase audience engagement and knowledge by dispensing information using Bank Account Management System Features. This template helps you present information on nine stages. You can also present information on Online Registrations, Account Activation, Transferring using this PPT design. This layout is completely editable so personaize it now to meet your audiences expectations.
-
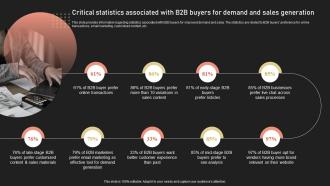 Critical Statistics Associated With B2B Buyers For Demand And Sales Generation
This slide provides information regarding statistics associated with B2B buyers for improved demand and sales. The statistics are related to B2B buyers preference for online transactions, email marketing, customized content, etc. Increase audience engagement and knowledge by dispensing information using Critical Statistics Associated With B2B Buyers For Demand And Sales Generation. This template helps you present information on nine stages. You can also present information on Online Transactions, Variations In Sales Content, Buyers Prefer Listicles using this PPT design. This layout is completely editable so personaize it now to meet your audiences expectations.
-
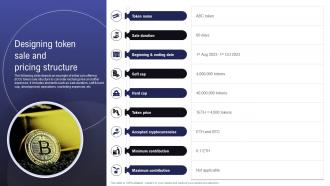 Comprehensive Guide To Raise Designing Token Sale And Pricing Structure BCT SS
The following slide depicts an example of initial coin offering ICO token sale structure to consider exchange fee and other expenses. It includes elements such as sale duration, soft and hard cap, development, operations, marketing expenses, etc. Introducing Comprehensive Guide To Raise Designing Token Sale And Pricing Structure BCT SS to increase your presentation threshold. Encompassed with Nine stages, this template is a great option to educate and entice your audience. Dispence information on Token Sale, Pricing Structure using this template. Grab it now to reap its full benefits.
-
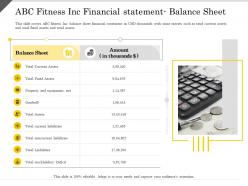 Abc fitness inc financial statement balance sheet property ppt powerpoint presentation inspiration
This slide covers ABC fitness Inc. balance sheet financial statement in USD thousands with some entries such as total current assets and total fixed assets and total assets Introducing ABC Fitness Inc Financial Statement Balance Sheet Property Ppt Powerpoint Presentation Inspiration to increase your presentation threshold. Encompassed with nine stages, this template is a great option to educate and entice your audience. Dispence information on ABC Fitness Inc Financial Statement Balance Sheet , using this template. Grab it now to reap its full benefits.
-
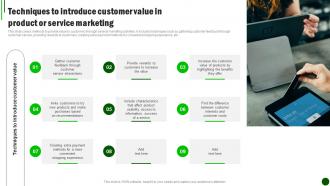 Sustainable Marketing Strategies Techniques To Introduce Customer MKT SS V
This slide covers methods to provide value to customers through several marketing activities. It includes techniques such as gathering customer feedback through customer service, providing rewards to customers, creating extra payment methods for convenient shopping experience, etc.Increase audience engagement and knowledge by dispensing information using Sustainable Marketing Strategies Techniques To Introduce Customer MKT SS V. This template helps you present information on nine stages. You can also present information on Service Interactions, Gather Customer, Purchases Based using this PPT design. This layout is completely editable so personaize it now to meet your audiences expectations.
-
 Activities To Receive Effective Feedback KPMG Operational And Marketing Strategy SS V
This slide covers activities conducted to receive feedback to enhance quality of audits for KPMG company. The purpose of this template is to provide an overview on activities used to improve audit operations of the company. It includes activities such as using client collaboration portal, following on global people survey, etc. Introducing Activities To Receive Effective Feedback KPMG Operational And Marketing Strategy SS V to increase your presentation threshold. Encompassed with nine stages, this template is a great option to educate and entice your audience. Dispence information on Portal, Global, Monitoring, using this template. Grab it now to reap its full benefits.
-
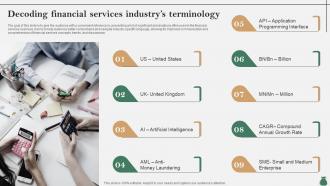 Global Financial Services Industry Decoding Financial Services Industrys IR SS
The goal of this slide is to give the audience with a convenient reference by presenting a list of significant abbreviations often used in the financial services business. It aims to help audience better comprehend and navigate industry specific language, allowing for improved communication and comprehension of financial services concepts, trends, and discussions. Introducing Global Financial Services Industry Decoding Financial Services Industrys IR SS to increase your presentation threshold. Encompassed with nine stages, this template is a great option to educate and entice your audience. Dispence information on Application Programming Interface, Compound Annual Growth Rate, Small Medium Enterprise, using this template. Grab it now to reap its full benefits.
-
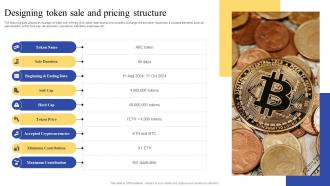 Designing Token Sale And Pricing Ultimate Guide For Initial Coin Offerings BCT SS V
The following slide depicts an example of initial coin offering ICO token sale structure to consider exchange fee and other expenses. It includes elements such as sale duration, soft and hard cap, development, operations, marketing expenses, etc. Introducing Designing Token Sale And Pricing Ultimate Guide For Initial Coin Offerings BCT SS V to increase your presentation threshold. Encompassed with nine stages, this template is a great option to educate and entice your audience. Dispence information on Sale Duration, Soft Cap, Cryptocurrencies, using this template. Grab it now to reap its full benefits.
-
 Best Practices To Effectively Use Hybrid Blockchain Platforms Comprehensive Evaluation BCT SS
This slide covers effectively utilizing hybrid blockchain platforms for multiple users. It includes best tips such as clearly defining purpose and goals for implementing hybrid blockchain, ensuring proper data management and security measures, implementing robust access control mechanism, etc. Introducing Best Practices To Effectively Use Hybrid Blockchain Platforms Comprehensive Evaluation BCT SS to increase your presentation threshold. Encompassed with nine stages, this template is a great option to educate and entice your audience. Dispence information on Blockchain Platform, Data Management, Potential Synergies using this template. Grab it now to reap its full benefits.


