-
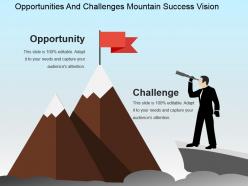 Opportunities and challenges mountain success vision powerpoint slide deck template
Presenting opportunities and challenges mountain success vision powerpoint slide deck template. This is a opportunities and challenges mountain success vision powerpoint slide deck template. This is a two stage process. The stages in this process are problem solution, current state future state, before after, challenges solution, compare, comparison, opportunities and challenges, opportunities and threats.
-
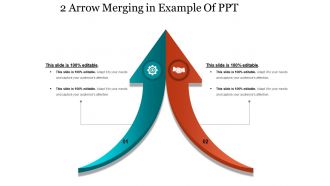 2 arrow merging in example of ppt
Presenting 2 arrow merging in example of ppt. This is a 2 arrow merging in example of ppt. This is a two stage process. The stages in this process are curved arrows, converging arrow, arrow merging.
-
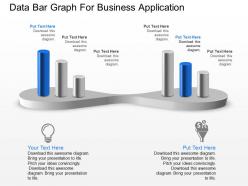 Data bar graph for business application powerpoint template slide
Presenting, data bar graph for business application PowerPoint template slide. Modifiable PPT Slide, edit the bar colors shown and personalize the text with your data. Convertible into various format options like JPEG, JPG or PDF. Display option available such as standard and widescreen view, available in 4:3 standard and full screen version 16:9. Liberty to customize it with company name and logo. Helpful for business professionals, students, teachers, business analysts and strategists. Compatible with google slides as well.
-
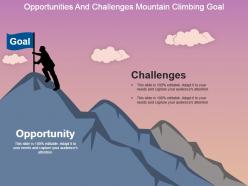 Opportunities and challenges mountain climbing goal powerpoint slide deck samples
Presenting opportunities and challenges mountain climbing goal powerpoint slide deck samples. This is a opportunities and challenges mountain climbing goal powerpoint slide deck samples. This is a two stage process. The stages in this process are problem solution, current state future state, before after, challenges solution, compare, comparison, opportunities and challenges, opportunities and threats.
-
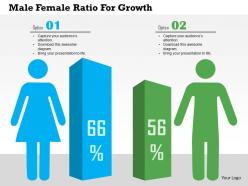 Male female ratio for growth flat powerpoint design
We are proud to present our male female ratio for growth flat powerpoint design. Concept of balance in male and female ratio has been described in this PPT diagram. This PPT diagram contains the graphic of male and female icons with respective bar graphs. Use this PPT diagram for business and social topics related presentations.
-
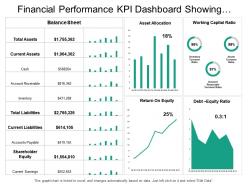 Financial performance kpi dashboard showing asset allocation balance sheet
Presenting this set of slides with name - Financial Performance Kpi Dashboard Showing Asset Allocation Balance Sheet. This is a two stage process. The stages in this process are Financial Performance, Financial Report, Financial Review.
-
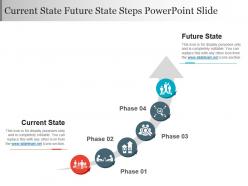 Current state future state steps powerpoint slide
Presenting current state future state steps powerpoint slide. This is a current state future state steps powerpoint slide. This is a two stage process. The stages in this process are problem solution, current state future state, before after, challenges solutions, compare, comparison.
-
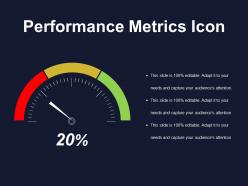 Performance metrics icon powerpoint images
Presenting performance metrics icon PowerPoint images PPT slide. This performance metrics slide is easily downloadable and export it into JPEG or PDF format. A presenter can display this performance metrics icon slide in the standard or widescreen view. You can even amend the color, text, font type & font size, aspect ratio, etc. of performance metrics icon slide. The performance metrics icon template gets 100% synced with Google Slides and fully editable in PowerPoint. You can share this performance metrics icon slide easily with large segment due to its tremendous pixel quality. The performance metrics icon slide gets linked with the excel sheet.
-
 Ij red growth arrow for year 2016 business and finance analysis flat powerpoint design
The PowerPoint presentation ensures proofing and editing with ease. Utmost useful to management professionals, big or small organizations and business startups. Text and graphic can be put to show in the same PPT slide. Supports recasting the color, size and orientation in presentation slide show according to the requirement. High resolution in color and art shape is offered by PPT graphic.
-
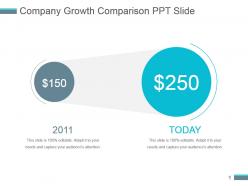 Company growth comparison ppt slide
Presenting company growth comparison ppt slide. Presenting company growth comparison ppt slide. This is a company growth comparison ppt slide. This is a two stage process. The stages in this process are today.
-
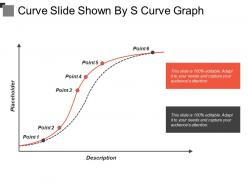 Curve slide shown by s curve graph
Presenting this set of slides with name - Curve Slide Shown By S Curve Graph. This is a two stage process. The stages in this process are Curve Slide, Spiral, Spring.
-
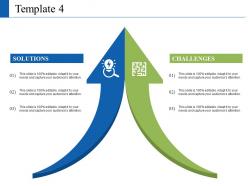 Solution and challenges with arrow ppt designs download
Presenting this set of slides with name - Solution And Challenges With Arrow Ppt Designs Download. This is a two stage process. The stages in this process are Solutions, Challenges, Icons, Marketing, Strategy, Business.
-
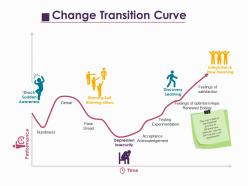 Change transition curve ppt layouts shapes
Presenting this set of slides with name - Change Transition Curve Ppt Layouts Shapes. This is a two stage process. The stages in this process are Business, Management, Strategy, Analysis, Icons.
-
 S curve showing launch growth and decline
Presenting this set of slides with name - S Curve Showing Launch Growth And Decline. This is a two stage process. The stages in this process are S Curve, Adoption Curve, S Loop.
-
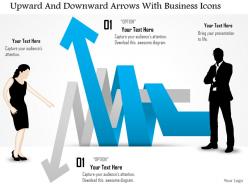 Ds upward and downward arrows with business icons powerpoint template
Easily amendable Presentation template as color, text and font are alterable. Access to insert or exclude the business related aspects such as logo, icon and image. PowerPoint diagram can be downloaded and saved into JPEG and PDF document. Similar designs obtainable with different stages. Adaptable to wide screen view without the problem of pixilation.
-
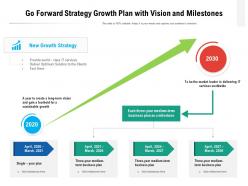 Go forward strategy growth plan with vision and milestones
Presenting our set of slides with Go Forward Strategy Growth Plan With Vision And Milestones. This exhibits information on two stages of the process. This is an easy-to-edit and innovatively designed PowerPoint template. So download immediately and highlight information on Growth Strategy, Vision, IT Services.
-
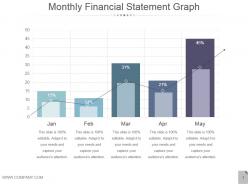 Monthly financial statement graph ppt examples slides
Presenting monthly financial statement graph ppt examples slides. This is a monthly financial statement graph ppt examples slides. This is a two stage process. The stages in this process are jan, feb, mar, apr, may.
-
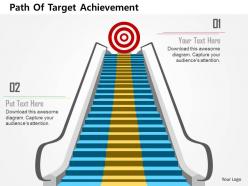 Path of target achievement flat powerpoint design
We are proud to present our path of target achievement flat powerpoint design. This power point template diagram has been crafted with graphic of target dart and stairs. This PPT diagram contains the concept of target achievement. Use this PPT diagram for business and marketing related presentations.
-
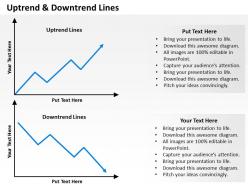 Uptrend and downtrend lines powerpoint template slide
We are proud to present our uptrend and downtrend lines powerpoint template slide. This PowerPoint template comes with different slide designs and layouts that you can use in your presentations, for example you can copy the balloons or callouts to represent business goal in a strategy PowerPoint presentation or communicate a message thanks to the business silhouette.
-
 World travel icon showing globe with plane
Presenting this set of slides with name - World Travel Icon Showing Globe With Plane. This is a two stage process. The stages in this process are World Travel,World Tour,Global Travel.
-
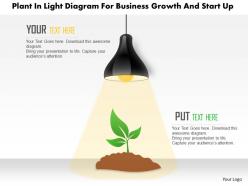 0115 plant in light diagram for business growth and start up powerpoint template
Perfect resolution of the icons and the pictures in the slides. Allow instant downloading of the slide template. Trouble-free insertion of the brand name in the background. Compatible with Microsoft Office programs and Google Slides. Offer 100% access to edit and modify the slide design. Beneficial for the Sales and Marketing professionals and the business managers.
-
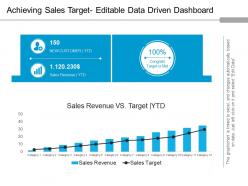 Achieving sales target editable data driven dashboard Snapshot powerpoint ideas
The design allows full editing. You can modify and customize the design the way you want. The design makes use of excel linked chart, where you need to include business related facts on excel sheet and it will automatically get changed in the PPT design. Quick and easy downloading available. You can download the design into JPEG and PDF formats. Design template is fully compatible with Google Slides and MS PowerPoint software.
-
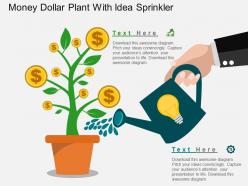 Bm money dollar plant with idea sprinkler flat powerpoint design
Presenting bm money dollar plant with idea sprinkler flat powerpoint design. This Power Point template diagram has been crafted with graphic of money dollar plant and sprinkler. This PPT diagram contains the concept of financial growth indication. Use this PPT diagram for business and finance related presentations.
-
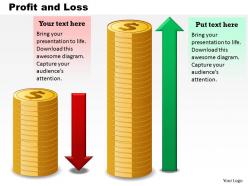 Profit and loss powerpoint template slide
These are isolated PPT image conducive for the business executives, trade specialists, company analysts etc. The scheme, intensity, context, symbols etc. can be handily ameliorated according to your need. These Presentation graphics are simply exportable to different files compositions like PDF or JPG. These are immensely high quality PPT slides which are well compatible with all Google slides.
-
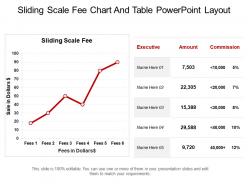 Sliding scale fee chart and table powerpoint layout
Presenting sliding scale fee chart and table powerpoint layout. This is a sliding scale fee chart and table powerpoint layout. This is a stage process. The stages in this process are executive, amount, commission, sale in dollars.
-
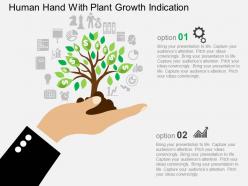 Human hand with plant growth indication flat powerpoint design
We are proud to present our human hand with plant growth indication flat powerpoint design. Graphic of human hand with plant growth has been used to design this power point template diagram. This PPT diagram contains the concept of growth indication. Use this PPT diagram for business and marketing related presentations.
-
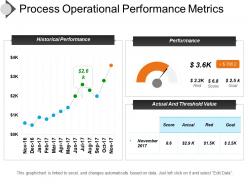 Process operational performance metrics presentation slides
Presenting process operational performance metrics presentation slides. PPT is useful in process performance measurement and improvement related slideshows. You can open the design template with Google Slides and PowerPoint. Images are fully supported on standard and wide screen views. Diagrams are fully editable in PowerPoint. You can change all the design components including font type, color, size, shape, background, images etc.
-
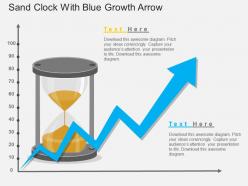 Bm sand clock with blue growth arrow flat powerpoint design
Presenting bm sand clock with blue growth arrow flat powerpoint design. This Power Point template diagram has been crafted with graphic of sand clock and blue growth arrow . This PPT diagram contains the concept of growth analysis and time management .Use this PPT diagram for business and marketing related presentations.
-
 Company market size comparison chart ppt slide
Presenting company market size comparison chart ppt slide. This is a company market size comparison chart ppt slide. This is a two stage process. The stages in this process are business, success, strategy, finance, growth, success.
-
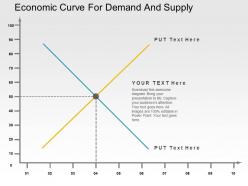 Economic curve for demand and supply flat powerpoint design
We are proud to present our economic curve for demand and supply flat powerpoint design. Explain the concept of demand and supply with this unique PPT diagram. This PPT diagram contains the graphic of economic curve. Use this PPT diagram for economic and production related presentations.
-
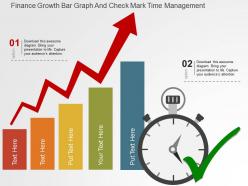 Finance growth bar graph and check mark time management flat powerpoint design
We are proud to present our finance growth bar graph and check mark time management flat powerpoint design. Graphic of bar graph and check mark has been used to craft this power point template diagram. This PPT diagram contains the concept of financial growth and time management. This PPT diagram can be used for business and finance related presentations.
-
 S curve old new newer using 3 curves
Presenting this set of slides with name - S Curve Old New Newer Using 3 Curves. This is a two stage process. The stages in this process are S Curve, Adoption Curve, S Loop.
-
 0314 business ppt diagram arrows showing upwards trend powerpoint template
Pre designed professionally proficient slide design background. Compatible with numerous slide design software options available both online and offline. Compatible with multiple format options. Clarity in deciphering information as mentioned on topic. Flawless designing. High resolution visuals do not deter in quality when projected on wide screen. Thoroughly editable slide design. Ease of inclusion and exclusion of content at sole discretion. Used by business analysts, strategists, financiers, students and teachers.
-
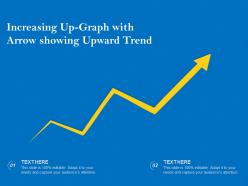 Increasing up graph with arrow showing upward trend
Presenting our set of slides with name Increasing Up Graph With Arrow Showing Upward Trend. This exhibits information on two stages of the process. This is an easy-to-edit and innovatively designed PowerPoint template. So download immediately and highlight information on Increasing Up Graph With Arrow Showing Upward Trend.
-
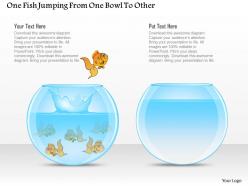 One fish jumping from one bowl to other powerpoint template
We are proud to present our one fish jumping from one bowl to other powerpoint template. Graphic of fish bowl diagram has been used to craft this power point template. This PPT diagram contains the concept of business growth. Use this PPT diagram for business and marketing related presentations.
-
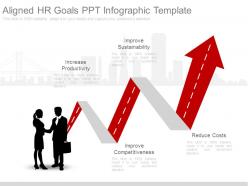 Aligned hr goals ppt infographic template
Presenting aligned hr goals ppt infographic template. This is a aligned hr goals ppt infographic template. This is a two stage process. The stages in this process are improve sustainability, increase productivity, improve competitiveness, reduce costs.
-
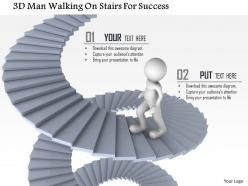 1214 kaizen small improvements in business for success powerpoint template
We are proud to present our 1214 kaizen small improvements in business for success powerpoint template. This Power Point template has been designed with graphic of 3d man and stairs. This PPT also contains the concept of success in any field. This PPT can be used to show success and achievement. Use this PPT for business and game related presentations.
-
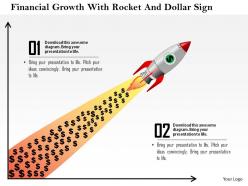 1114 financial growth with rocket and dollar sign powerpoint template
We are proud to present our 1114 financial growth with rocket and dollar sign powerpoint template. This Power Point template has been designed with graphic of dollars and rocket. This PPT slide contains the concept of financial growth. Use this PPT slide for your business and finance related presentations.
-
 Measure success icon rocket and men
Presenting this set of slides with name - Measure Success Icon Rocket And Men. This is a two stage process. The stages in this process are Measure Success, Measure Growth, Measure Improvement.
-
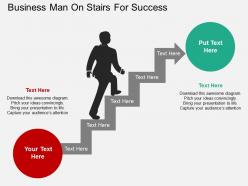 Ge business man on stairs for success flat powerpoint design
Presenting ge business man on stairs for success flat powerpoint design. This Power Point template diagram has been crafted with graphic of business man on stairs This PPT diagram contains the concept of business success representation. Use this PPT diagram for business and marketing related presentations.
-
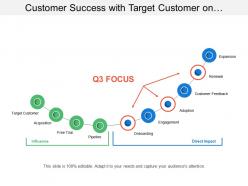 Customer success with target customer on boarding adaption renewal
Presenting this set of slides with name - Customer Success With Target Customer On Boarding Adaption Renewal. This is a two stage process. The stages in this process are Customer Success, Customer Achievements, Cs Lifecycle.
-
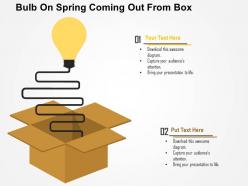 Bulb on spring coming out from box flat powerpoint design
We are proud to present our bulb on spring coming out from box flat powerpoint design. Graphic of bulb on spring coming out from the box has been used to design this power point template diagram. This PPT diagram can be used for idea generation related topics in any presentation.
-
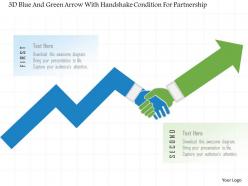 1214 3d blue and green arrow with handshake condition for partnership powerpoint template
We are proud to present our 1214 3d blue and green arrow with handshake condition for partnership powerpoint template. This Power Point template has been designed with graphic of 3d blue and green arrow in handshake condition. This PPT contains the concept of partnership. Use this PPT for your business and marketing partnership related presentations.
-
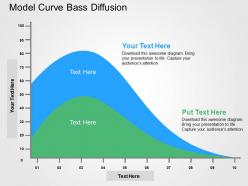 Model curve bass diffusion flat powerpoint design
We are proud to present our model curve bass diffusion flat powerpoint design. Graphic of model curve bass diffusion has been used to design this power point template diagram. This PPT diagram contains the concept of analysis. Use this PPT diagram for business and marketing presentations.
-
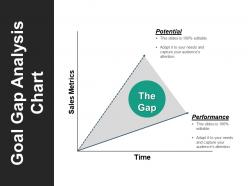 Goal gap analysis chart sample of ppt
Presenting goal gap analysis chart sample of PPT slide. You can download this funnel diagram template and save it into JPG & PDF format. Display this gap analysis template in the standard & widescreen view. You can edit the graph design slide such as color, text, font type, font size and aspect ratio. The chart design template gets fully synced with Google Slides and completely editable in PowerPoint. You can share this template with large segment due to its superb pixel quality. You can insert the appropriate context in text placeholder of this slide.
-
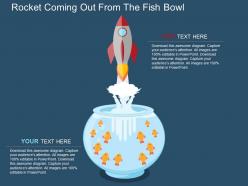 Rocket coming out from the fish bowl flat powerpoint design
We are proud to present our rocket coming out from the fish bowl flat powerpoint design. This power point template diagram has been crafted with graphic of rocket coming out from the fish bowl .This PPT diagram contains the concept of growth and problem solving. Use this PPT diagram for business and marketing related presentations.
-
 Value creation icon presentation slide
Presenting this set of slides with name - Value Creation Icon Presentation Slide. This is a two stage process. The stages in this process are Value Generation, Value Creation, Value Management.
-
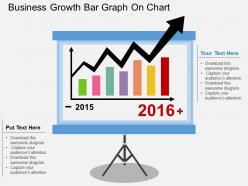 Aj business growth bar graph on chart flat powerpoint design
Presenting aj business growth bar graph on chart flat powerpoint design. This Power Point template diagram has been crafted with graphic of business bar graph and chart diagram. This PPT diagram contains the concept of business growth analysis representation. Use this PPT diagram for business and marketing related presentations.
-
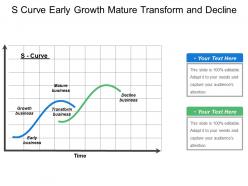 S curve early growth mature transform and decline
Presenting this set of slides with name - S Curve Early Growth Mature Transform And Decline. This is a two stage process. The stages in this process are S Curve, Adoption Curve, S Loop.
-
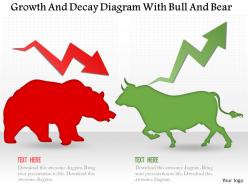 0115 growth and decay diagram with bull and bear powerpoint template
We are proud to present our 0115 growth and decay diagram with bull and bear powerpoint template. This power point template slide has been designed with graphic of bull and bear. This PPT contains the concept of growth and decay. Use this PPT for business and marketing related presentations.
-
 Air force jet icon
Presenting air force jet icon. This is a air force jet icon. This is a two stage process. The stages in this process are aerospace force, air army, air force.
-
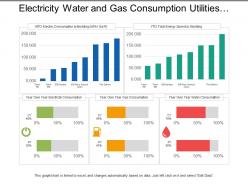 Electricity water and gas consumption utilities dashboard
Presenting this set of slides with name - Electricity Water And Gas Consumption Utilities Dashboard. This is a two stage process. The stages in this process are Utilities, Use, Advantage.
-
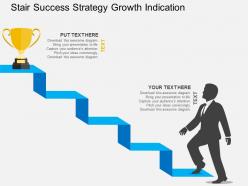 Stair success strategy growth indication flat powerpoint design
We are proud to present our stair success strategy growth indication flat powerpoint design. Graphic of stairs has been used to design this power point template diagram. This PPT diagram contains the concept of success and growth strategy indication. Use this PPT diagram for business and sales related presentations.
-
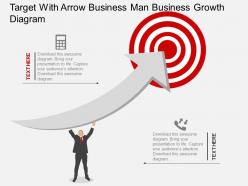 Kp target with arrow business man business growth diagram flat powerpoint design
Presenting kp target with arrow business man business growth diagram flat powerpoint design. This Power Point template diagram has been crafted with graphic of target, business man and arrow diagram. This Power Point template diagram contains the concept of business growth and target representation. Use this icon template for business and marketing related presentations.
-
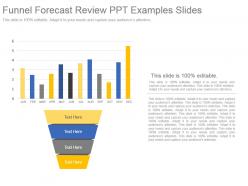 Funnel forecast review ppt examples slides
Presenting funnel forecast review ppt examples slides. This is a funnel forecast review ppt examples slides. This is a two stage process. The stages in this process are jan, feb, mar, apr, may, jun, jul, aug, sep, oct, nov, dec.
-
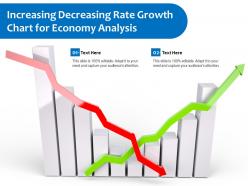 Increasing decreasing rate growth chart for economy analysis
Introducing our premium set of slides with Increasing Decreasing Rate Growth Chart For Economy Analysis. Ellicudate the two stage and present information using this PPT slide. This is a completely adaptable PowerPoint template design that can be used to interpret topics like Increasing Decreasing Rate Growth Chart For Economy Analysis. So download instantly and tailor it with your information.
-
 Service improvement icons example of ppt
Presenting this set of slides with name - Service Improvement Icons Example Of Ppt. This is a two stage process. The stages in this process are Service Improvement, Service Management, Service Development.
-
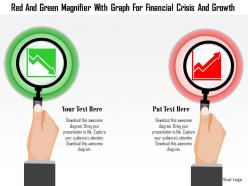 0115 red and green magnifier with graph for financial crisis and growth powerpoint template
We are proud to present our 0115 red and green magnifier with graph for financial crisis and growth powerpoint template. Graphic of red and green magnifier has been used to craft this power point template. This PPT contains the concept of analyzing the financial crisis and growth with the help of graph. This PPT can be used for business and finance related presentations.
-
 Website launch define objectives user needs actionable steps
Presenting this set of slides with name - Website Launch Define Objectives User Needs Actionable Steps. This is a two stage process. The stages in this process are Website Launch, Market A Website, Website Introduction.
-
 Data conversion data enhancements process optimization metadata management
Presenting this set of slides with name - Data Conversion Data Enhancements Process Optimization Metadata Management. This is an editable two stages graphic that deals with topics like Data Conversion, Data Enhancements, Process Optimization, Metadata Management to help convey your message better graphically. This product is a premium product available for immediate download, and is 100 percent editable in Powerpoint. Download this now and use it in your presentations to impress your audience.
Toggle Nav

Skip to Content

Search
5
Notifications 5
-
 SlideTeam has published a new blog titled "Top 10 Next Steps Slide Templates with Samples and Examples".
11 hours ago
-
 SlideTeam has published a new blog titled "Top 10 Learning Journey Templates with Examples and Samples".
11 hours ago
-
 SlideTeam has published a new blog titled "Top 10 Benchmarking Presentation Templates with Examples and Samples".
11 hours ago
-
 SlideTeam has published a new blog titled "Top 7 Team Name Templates with Samples and Examples".
11 hours ago
-
 SlideTeam added 1063 new products (e.g. Completely Researched Decks, Documents, Slide Bundles, etc), which included 17008 slides in total in the past 24 hours.
15 hours ago


